Charts like this, from your own numbers.
Connect a spreadsheet or the tools you run on, and Parity builds the dashboard and writes the report, with every number checked.
Try Parity freeIn 1991, 74% of Vietnam's workers were in agriculture. By 2025 the figure was 25%. In one working lifetime, a country of farmers became one where three workers in four do something else, in a factory, a shop, an office or a port.
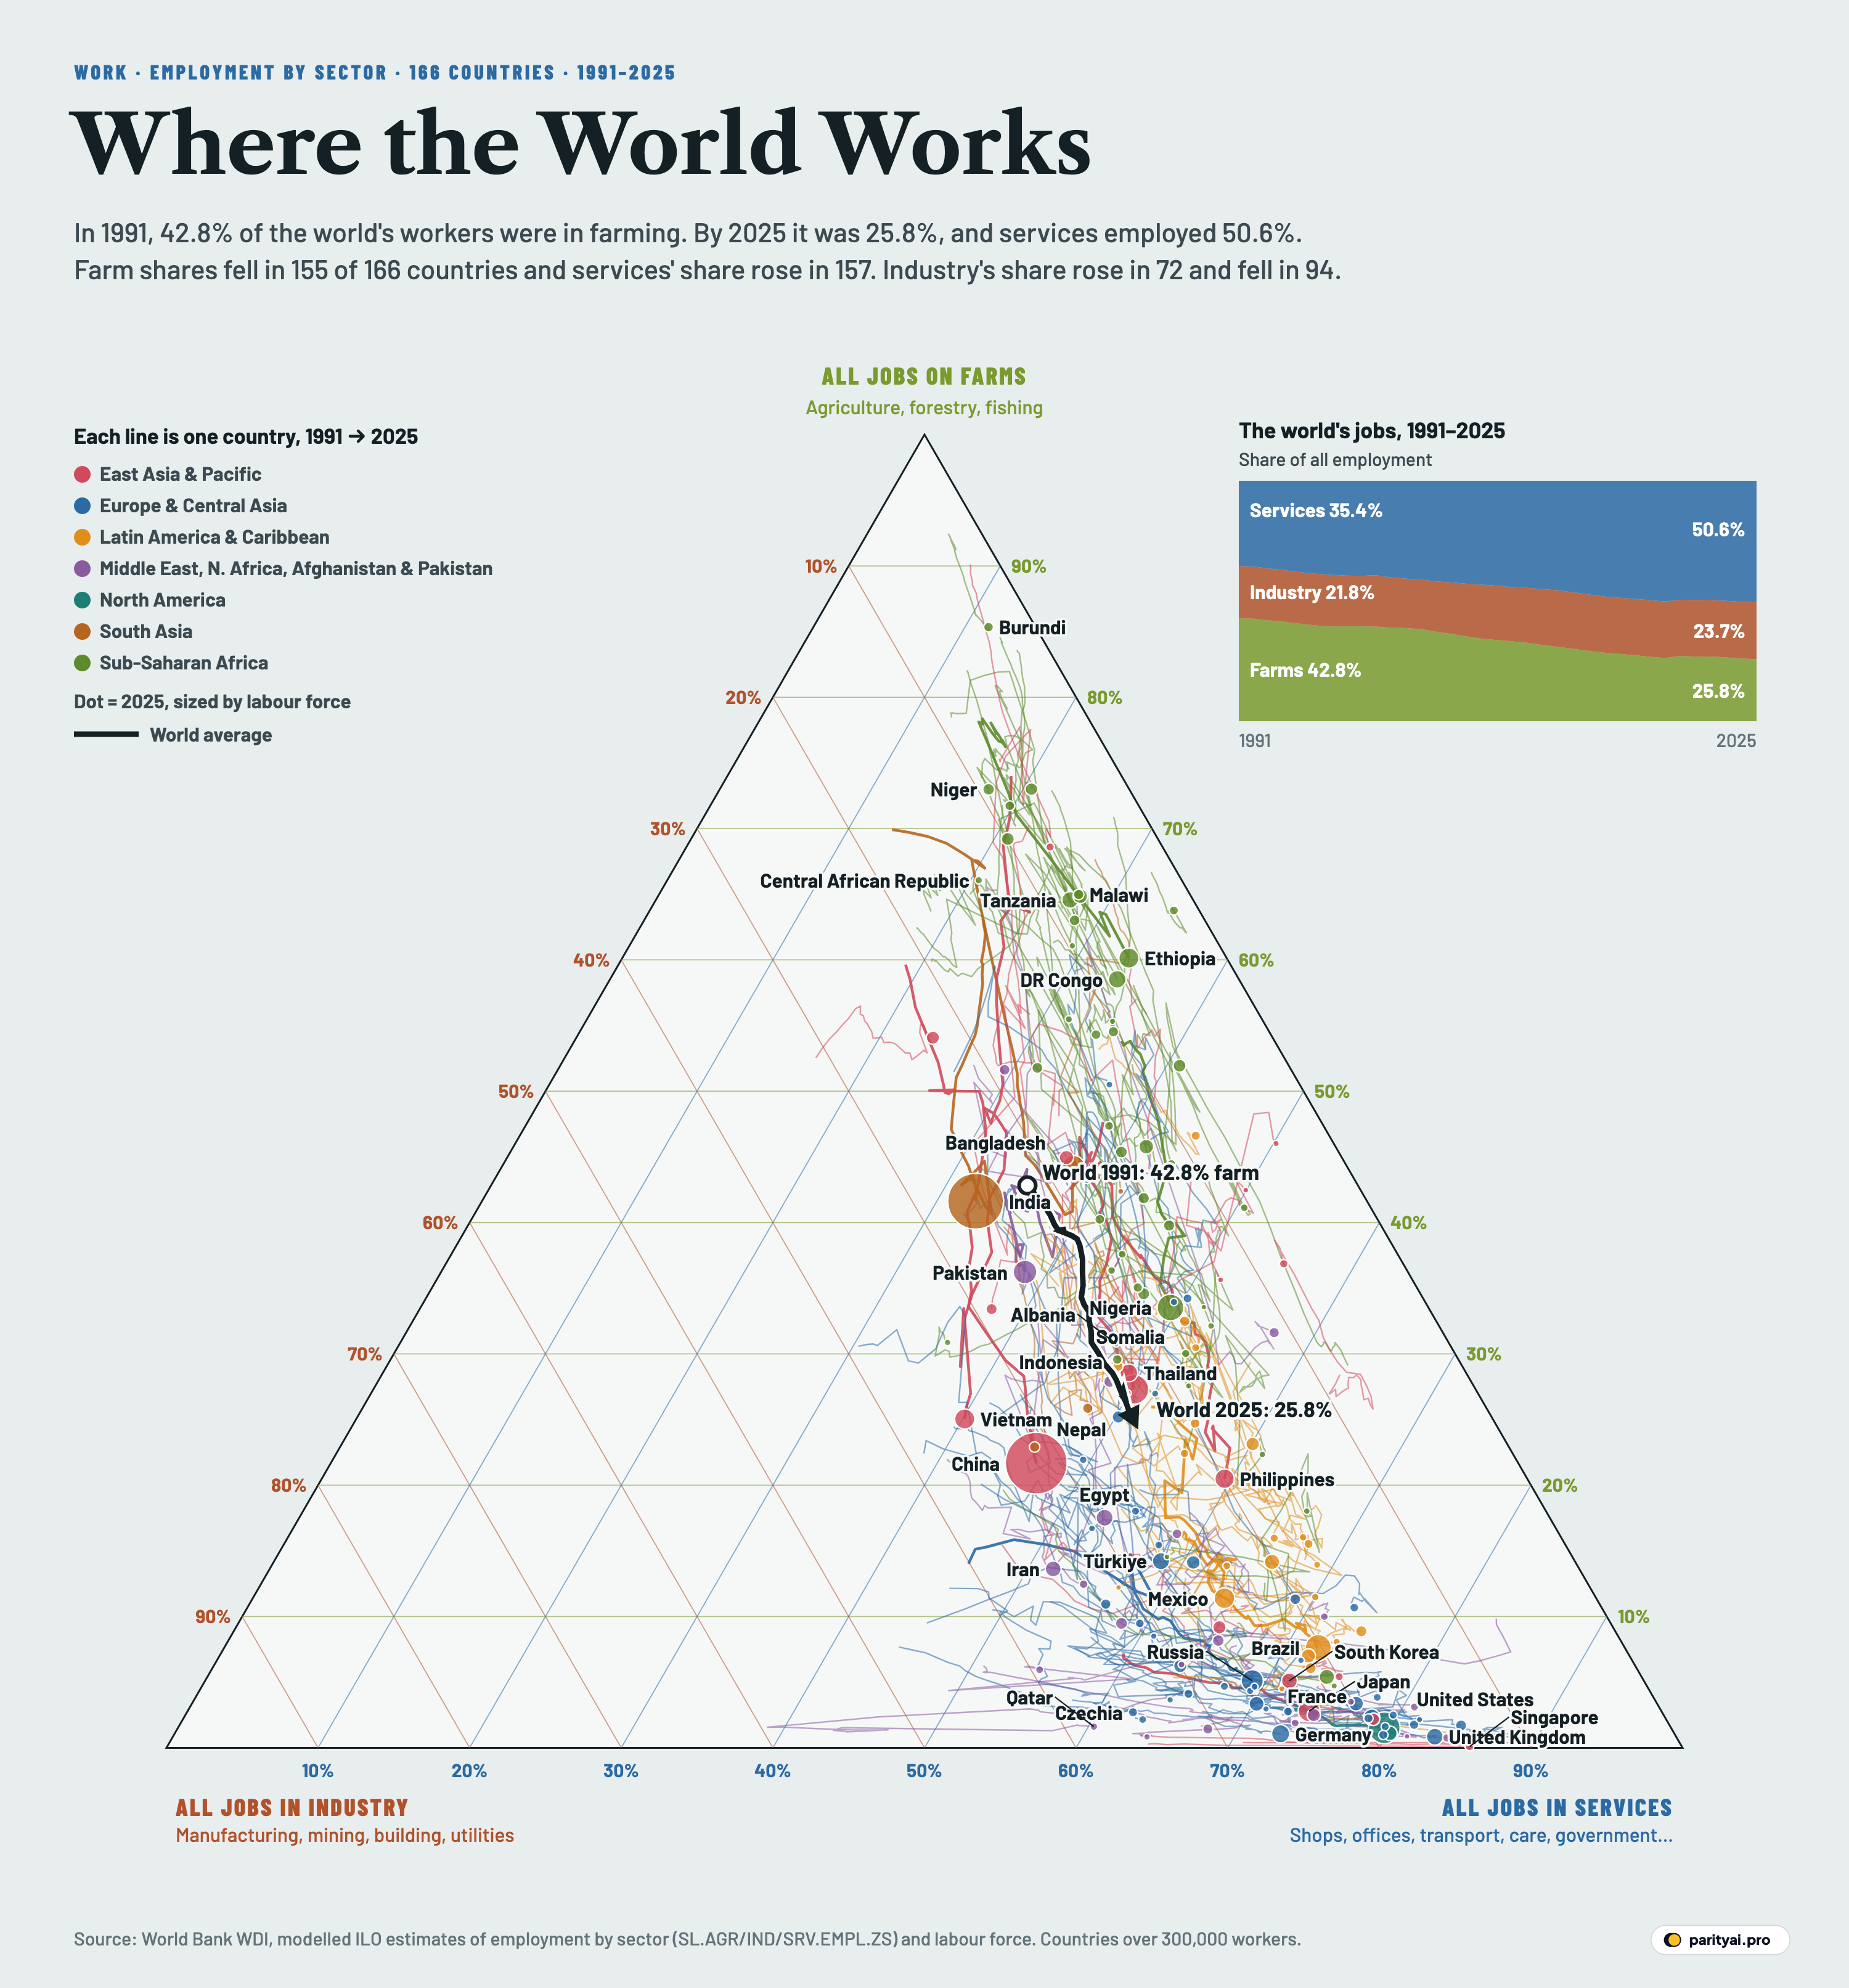
That kind of shift can be drawn. Every job falls into one of three broad sectors: agriculture (farming, forestry and fishing), industry (manufacturing, mining, construction and utilities) and services (everything else, from shops and transport to schools, hospitals and government). Any country's workforce is three shares that add up to 100, and any three such numbers can be drawn as a single point inside a triangle.
That is what the chart above does. The top corner of the triangle is a country where everyone farms. The bottom-left corner is a country where everyone works in industry; the bottom-right, one where everyone works in services. A country's position shows its mix, and the thin coloured line behind each dot shows how that mix moved from 1991 to 2025, using the modelled estimates of the International Labour Organization published by the World Bank. Dots are sized by the size of each country's labour force. The thick black line is the world as a whole.
In 1991, 42.8% of the world's workers were in agriculture, 21.8% in industry and 35.4% in services. By 2025 the figures were 25.8%, 23.7% and 50.6%. Services overtook agriculture as the largest of the three in the current data in 1999, and have stayed ahead since 2001. (When the ILO first reported the crossover, in its Global Employment Trends 2007, it dated it to 2006; the modelled series has been revised many times since.) Since 2019, more than half the world's workers have been in services.
The more interesting story is in the direction each line travels. Think of the triangle as a map, with farms to the north, factories to the south-west and services to the south-east.
South: leaving the fields for both at once
A line that runs straight down means a country lost farm jobs and gained industry and services jobs in roughly equal measure. That is the classic picture of development in economics textbooks. In 1954 the economist Arthur Lewis described a modern "capitalist" sector that grows by drawing labour from a non-capitalist 'subsistence' sector, in practice, from the farms.
Vietnam is the clearest example on the chart, and it has the longest southward line of any large country. Its farm share fell by 49% percentage points, the biggest of any country with more than two million workers. Industry's share went from 7% to 35%, its highest in the series, and services from 19% to 40%. Cambodia, third on the list with a drop of 42% points, followed a similar path: agriculture from 75% to 33%, industry from 7% to 29%. Rwanda is second, with a drop of 44% points.
India's line also runs roughly south, though it is shorter. Its farm share fell from 63% to 42%, while industry went from 15% to 26% and services from 22% to 33%. Economists Tianyu Fan, Michael Peters and Fabrizio Zilibotti describe India's path as a rapid rise in services but limited industrialization, and they find that the gains were "heavily skewed toward high-income urban dwellers".
South-east: skipping the factory
Most lines on the chart lean right as they fall. Of the 166 countries drawn, the services share rose in 157, while industry's share rose in only 72 and fell in 94.
China's line, the big red dot, starts as one of the south-runners and bends south-east. In 1991, 60% of its workers were on farms, 21% in industry and 19% in services. By 2025 the farm share was 22%, industry 32% and services 47%, so services gained more than industry did. A San Francisco Federal Reserve paper documented that agriculture's share of Chinese employment had already decreased from over 70 percent to less than 50 percent between 1978 and 2003, so the line on the chart is the second half of a longer walk.
Bangladesh is a sharper case. It is known for its garment factories, yet in the ILO's data industry's share of jobs barely moved, from 17% in 1991 to 18% in 2025, after peaking at 21% in 2013. Almost the whole drop in farming, from 70% to 44%, went to services, which rose from 13% to 38%. Nigeria's industry share rose from 10% to 17%, but services gained more, from 36% to 49%.
Dani Rodrik, the Harvard economist, gave this pattern a name in 2015: premature deindustrialisation. Countries, he wrote, "are running out of industrialization opportunities sooner and at much lower levels of income" than the early industrialisers did, and Latin America has been "especially hard hit". Mexico's industry share peaked at 25% in 2000 and Brazil's was highest at the start of the series, at 25%; Brazil's is 20% today.
| Country | Farm 1991 | Farm 2025 | Farm share 1991–2025 | Change, points | Industry 2025 | Services 2025 |
|---|---|---|---|---|---|---|
| China | 60% | 22% | ▼ 38 | 32% | 47% | |
| India | 63% | 42% | ▼ 22 | 26% | 33% | |
| United States | 3% | 2% | ▼ 1 | 19% | 80% | |
| Indonesia | 48% | 27% | ▼ 20 | 23% | 50% | |
| Nigeria | 54% | 34% | ▼ 20 | 17% | 49% | |
| Brazil | 16% | 8% | ▼ 8 | 20% | 72% | |
| Pakistan | 41% | 36% | ▼ 4 | 25% | 39% | |
| Bangladesh | 70% | 44% | ▼ 26 | 18% | 38% | |
| Russia | 14% | 5% | ▼ 9 | 26% | 69% | |
| Japan | 7% | 3% | ▼ 4 | 23% | 74% | |
| Mexico | 26% | 11% | ▼ 15 | 25% | 64% | |
| Vietnam | 74% | 25% | ▼ 49 | 35% | 40% | |
| Ethiopia | 77% | 60% | ▼ 17 | 6% | 33% | |
| Philippines | 44% | 20% | ▼ 24 | 20% | 60% | |
| Germany | 4% | 1% | ▼ 3 | 26% | 73% | |
| Thailand | 56% | 29% | ▼ 27 | 22% | 49% | |
| DR Congo | 59% | 59% | ▼ 0 | 8% | 33% | |
| Türkiye | 46% | 14% | ▼ 32 | 27% | 58% | |
| Egypt | 40% | 18% | ▼ 22 | 29% | 53% | |
| United Kingdom | 2% | 1% | ▼ 2 | 16% | 83% | |
| Tanzania | 74% | 65% | ▼ 9 | 8% | 27% | |
| France | 5% | 2% | ▼ 3 | 19% | 78% | |
| South Korea | 15% | 5% | ▼ 10 | 23% | 72% | |
| Iran | 22% | 14% | ▼ 8 | 35% | 52% | |
| Colombia | 20% | 14% | ▼ 6 | 20% | 66% | |
| South Africa | 9% | 5% | ▼ 4 | 21% | 74% | |
| Italy | 8% | 3% | ▼ 5 | 26% | 70% | |
| Spain | 11% | 3% | ▼ 7 | 20% | 77% | |
| Kenya | 61% | 46% | ▼ 16 | 12% | 42% | |
| Uganda | 62% | 65% | ▲ 2 | 7% | 28% |
The 30 largest labour forces. Shares of total employment, modelled ILO estimates via the World Bank.
East along the bottom edge: the rich world's slide
At the bottom of the triangle, where farm shares are already in single digits, the lines run sideways, from left to right. These are countries swapping industry for services.
The United Kingdom's industry share halved, from 31% in 1991 to 16% in 2025, and services rose from 67% to 83%. Germany's industry share fell from 38% to 26%, South Korea's from 37% to 23%, and America's from 24% to 19%. For the United States, the Bureau of Labor Statistics adds a longer view: manufacturing alone was 22 percent of nonfarm jobs at its peak in June 1979, and 9 percent by June 2019.
Poland combines both movements. Its farm share fell from 26% to 6% while industry eased from 33% to 30%; nearly all the change went to services, up from 41% to 64%.
The most service-heavy economy on the chart is Luxembourg (91%). The most industrial is Oman (39%).
South-west: the few heading for the factory corner
A handful of countries moved left, towards industry, more than they moved right. Qatar's line is one of the most striking, though it starts near the bottom edge: in the ILO's estimates, industry's share of Qatari jobs reached 60% in 2008, and it is 38% today. The ILO's definition of industry includes construction, and the data do not separate a building boom from manufacturing.
China's industry share is at the highest point in its series in 2025, at 32%, as are Vietnam's and Cambodia's. So is the world's: at 23.7%, industry's share of global employment is the highest it has been since 1991. The factory age is not over; it has moved.
| Country | Peak share | Peak year | 2025 |
|---|---|---|---|
| China | 2025 | 31.8% | |
| Vietnam | 2025 | 34.8% | |
| India | 2022 | 25.8% | |
| Bangladesh | 2013 | 18.0% | |
| Indonesia | 2025 | 22.5% | |
| Thailand | 2016 | 22.2% | |
| South Korea | 1991 | 23.4% | |
| Poland | 1991 | 30.0% | |
| Czechia | 1991 | 34.9% | |
| Germany | 1991 | 26.0% | |
| Mexico | 2000 | 24.5% | |
| Türkiye | 2008 | 27.3% | |
| Brazil | 1991 | 20.2% | |
| United States | 1991 | 18.9% | |
| United Kingdom | 1991 | 15.9% | |
| Japan | 1992 | 23.2% |
Highest industry share between 1991 and 2025. Industry includes construction, mining and utilities as well as manufacturing.
Barely moving: the northern cluster
The cluster near the top of the triangle has the shortest lines. In 2025, 24 of the 166 countries on the chart still have at least half their workers in agriculture, down from 46 in 1991. 20 of those 24 are in sub-Saharan Africa.
Burundi (85%) has the highest farm share of any country drawn; in 1991 it was 91%. Niger's farm share went from 75% to 73% in 34 years. Ethiopia moved further, from 77% to 60%, but almost entirely into services, which rose from 16% to 33%; its industry share is 6%, lower than in 1991. An IMF paper on the region found that employment has predominantly shifted out of agriculture into services, much of it in small household enterprises rather than in industry.
North: the lines that went backwards
Farm shares fell in 155 of the 166 countries. In the rest, the line points up the triangle. Among those with more than a million workers, they are Angola, Botswana, Central African Republic, Ecuador, Moldova, Mali, Papua New Guinea, North Korea, Uganda, Zimbabwe. The reasons are not in this data, and in several of these countries the estimates rest on few surveys.
The world line itself turned north once. Between 2019 and 2020 the global farm share rose from 26.3% to 27.2%, the year of the pandemic, before falling again to 26.9% in 2021.
How firm the ground is
This chart is built on modelled estimates, and the model matters. Where a country has not run a labour-force survey in a given year, the ILO fills the gap with econometric models. The World Bank's metadata for the series warns that such imputed values "should not be used for country comparisons or rankings". For countries with few surveys, especially low-income ones, the smooth lines on the chart are smoother than reality would be.
There is also a measurement bias against farming. The same metadata notes that where figures come from surveys of businesses, or cover only urban areas, unpaid family and self-employed farm work drops out, and "the employment share of the agricultural sector is severely underreported". We rescaled the three shares to add up to exactly 100 before plotting, which moves no country by more than a sliver. And the three buckets are broad. "Services" holds both a software engineer and a street vendor; "industry" holds both a car plant and a building site.
A smaller corner
Draw the world's line once more in your head. It starts at 42.8% agriculture, a little south of the middle of the triangle's height, and ends at 25.8%, heading south-east the whole way. If it kept going in that direction it would end in the services corner, where the United Kingdom, the United States and Luxembourg already sit. But many of the countries with the most farm workers left, in the northern cluster, are also the ones whose lines are shortest. Where the world's line goes next depends less on Shanghai or Ho Chi Minh City than on Kinshasa, Addis Ababa and Niamey.
Sources and method
- World Bank, World Development Indicators: Employment in agriculture, industry and services, % of total employment (modelled ILO estimate). SL.AGR.EMPL.ZS, SL.IND.EMPL.ZS, SL.SRV.EMPL.ZS, 1991–2025, API updated October 8, 2026
- World Bank, Labor force, total (SL.TLF.TOTL.IN). Used to size the dots
- ILOSTAT, ILO modelled estimates
Shares are the ILO's modelled estimates of employment by broad sector, published by the World Bank: agriculture (including forestry and fishing), industry (mining, manufacturing, construction and utilities) and services. Where a country lacks surveys the ILO imputes values from models, so the paths of countries with few surveys are smoothed estimates rather than measurements, and the World Bank advises against using imputed values to rank countries. The three shares are rescaled to add up to exactly 100 before plotting. Dots are sized by the 2025 labour force (or the latest year available). Regions follow the World Bank's classification. Economies without a labour-force estimate or under 300,000 workers are in the data file but not drawn.
Charts like this, from your own numbers.
Connect a spreadsheet or the tools you run on, and Parity builds the dashboard and writes the report, with every number checked.
Try Parity free

