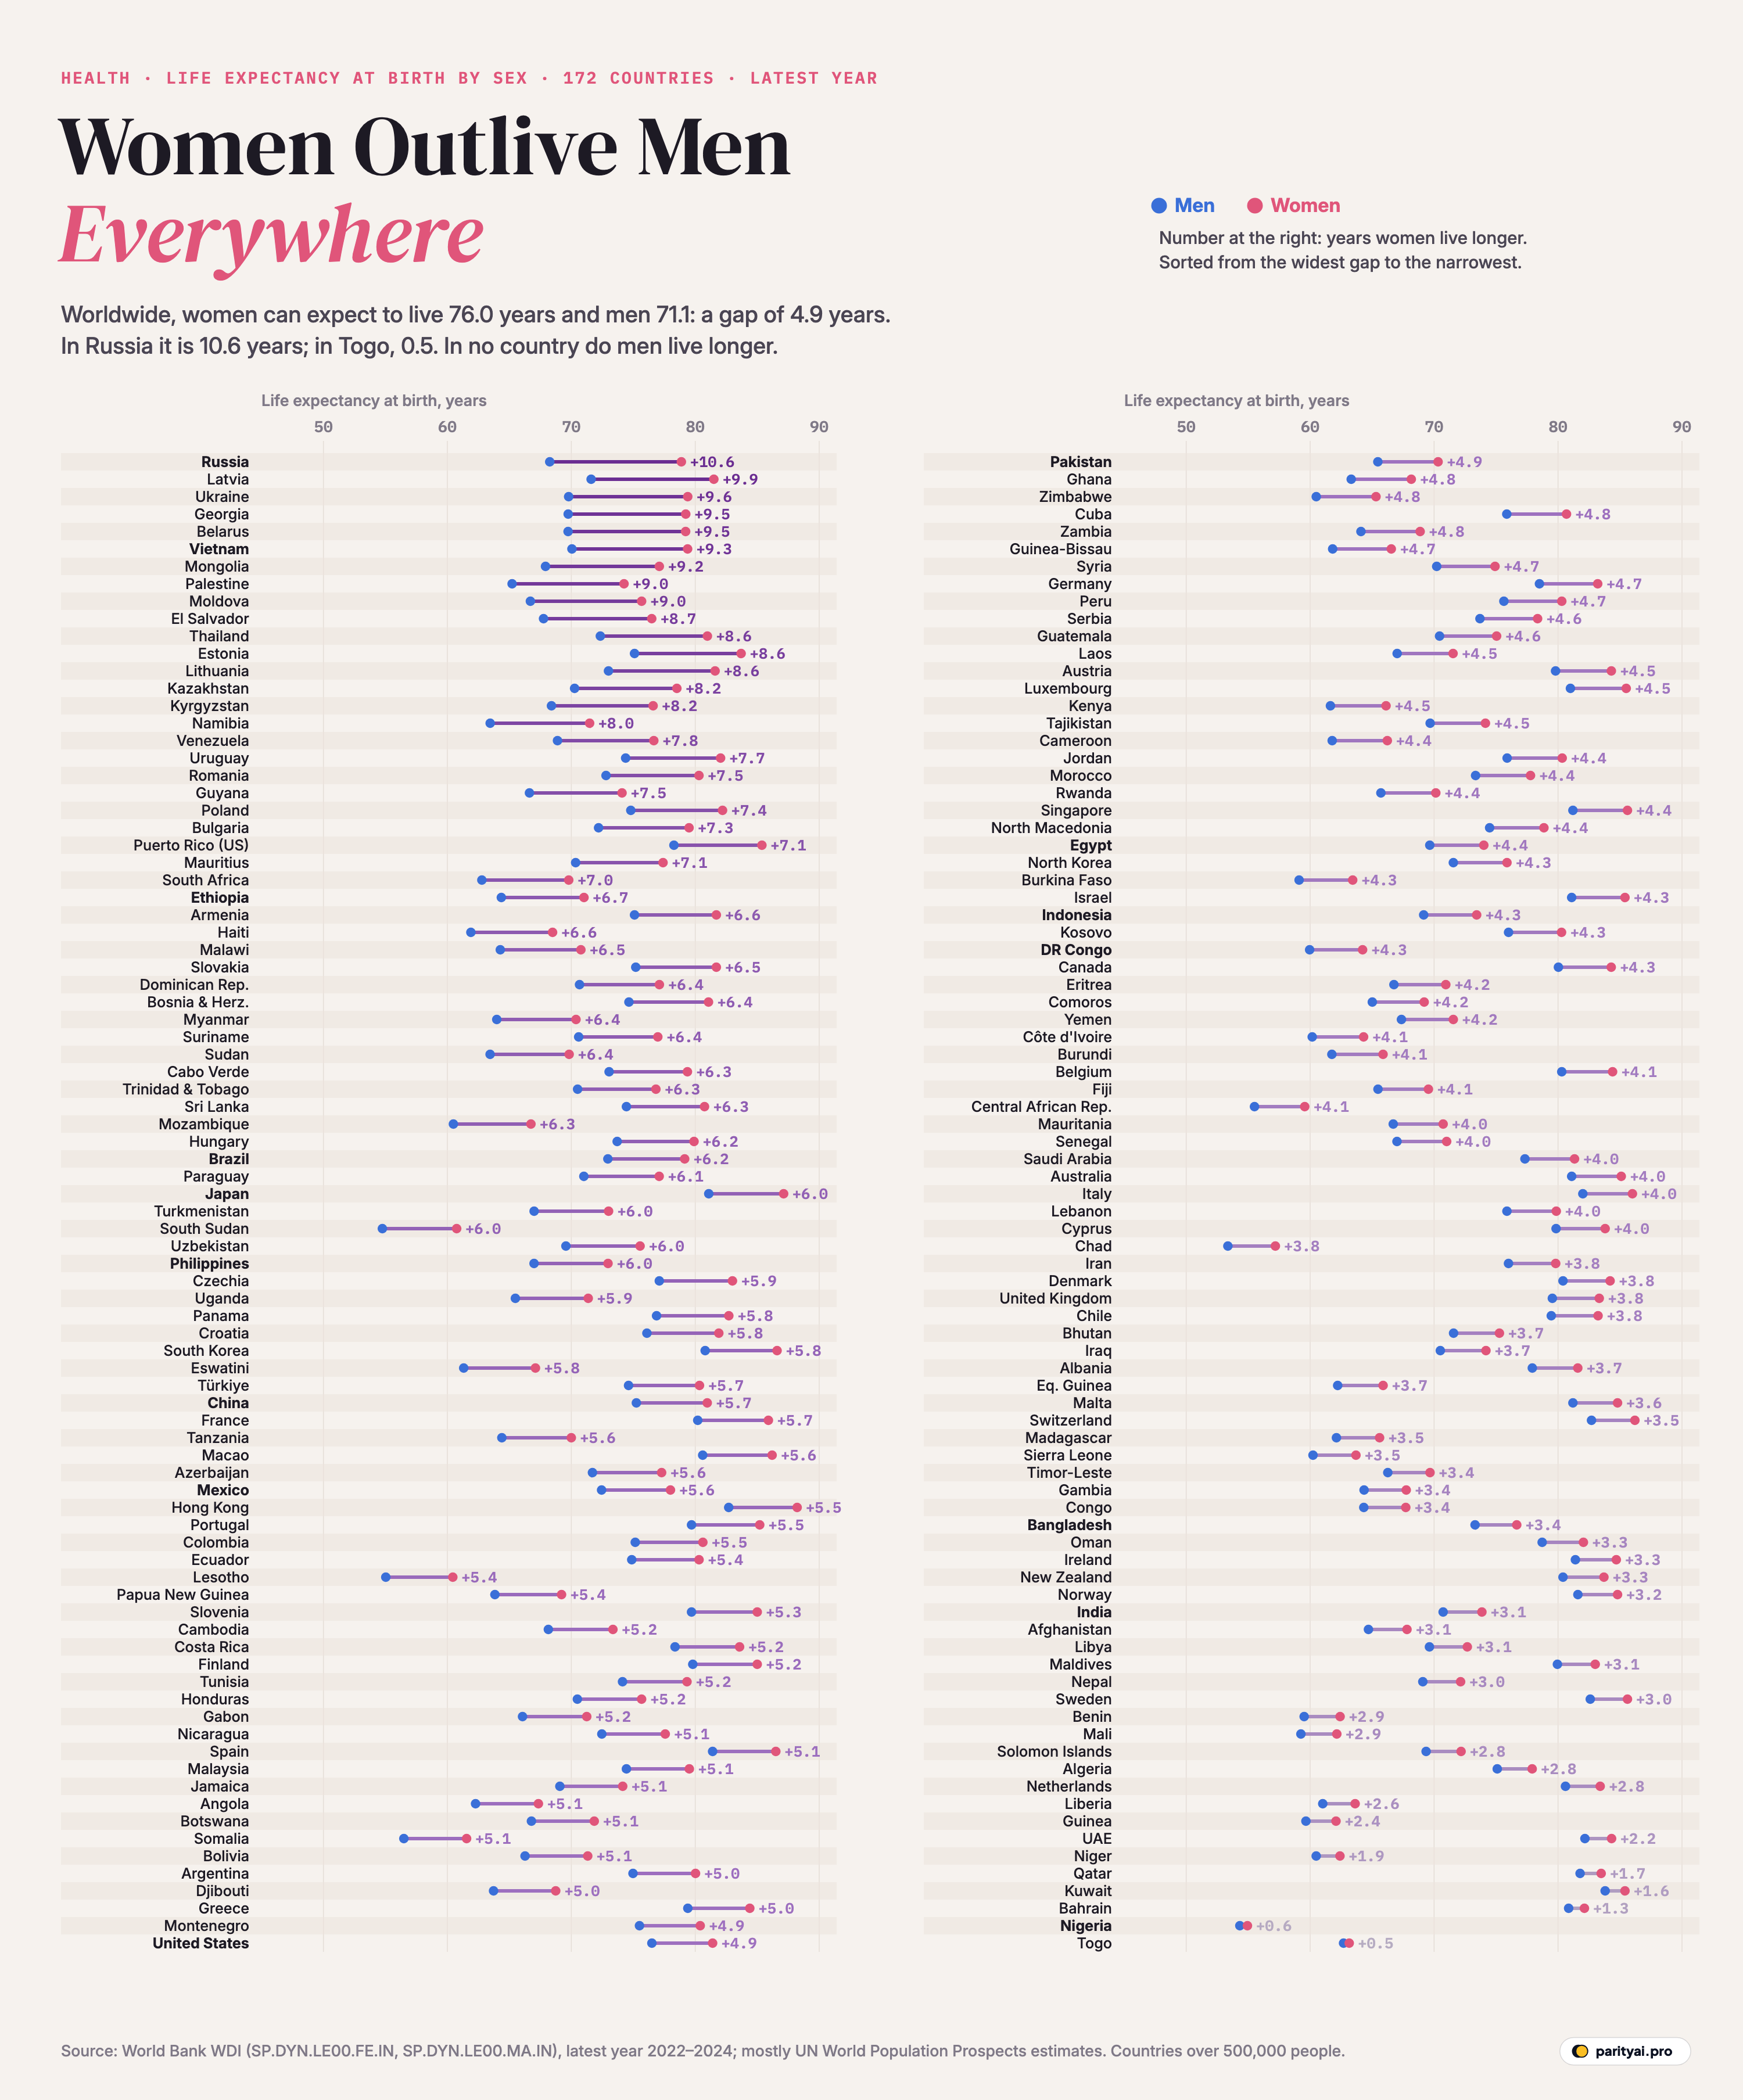
There is one rule in global health that holds almost everywhere: women outlive men. In 2024, the average newborn girl in the world could expect to live 76.0 years and the average newborn boy 71.1, a gap of 4.9 years, according to the World Bank's estimates.
The chart above shows that rule country by country. Each row is one of 172 countries, with a blue dot for men's life expectancy at birth and a pink dot for women's, joined by a line. The number at the end of each line is the gap in years. Rows are sorted from the widest gap, top left, to the narrowest, bottom right. In every single row, the pink dot is to the right of the blue one.
But the size of that gap varies enormously, from more than ten years in Russia to barely half a year in Togo. The reasons why tell you a good deal about what kills men early, and about what keeps women from living even longer.
Part of it is biology
Some of the advantage starts before birth. Our World in Data, summarising the research, notes that baby boys are more likely to be born prematurely and are more vulnerable to infections in their first year, and that women's second X chromosome and hormones may give some protection against disease. Women's advantage shows up at every age, in almost every period and place where good records exist.
That biological edge seems to be worth a few years. It explains why, even in countries with excellent health care and fairly equal lifestyles, a gap remains. In Sweden, women can expect to live 85.6 years and men 82.6, a gap of 3.0; in Iceland, 3.3; in Australia, 4.0.
But biology doesn't explain why the gap is three years in some countries and ten in others. For that, look at the top of the chart.
Most of it is behaviour
The widest gaps on the chart are concentrated in a single part of the world: the countries of the former Soviet Union. Russia has the widest gap of all, 10.6 years: women there can expect to live 78.9 years, men only 68.3. Latvia (9.9), Ukraine (9.6), Georgia (9.5) and Belarus (9.5) follow. Of the 172 countries, 16 have a gap of eight years or more, and most of them were once part of the USSR.
The explanation lies mainly in how men live, and die. Heavy drinking, especially of spirits, and smoking are far more common among men in these countries than among women. In Russia, men account for about 80% of the 150,000 to 200,000 deaths attributed to alcohol each year, and working-age men die from heart disease at about three times the rate of women. Injuries, accidents, violence and suicide add to the toll.
The World Health Organization has found that 33 of the 40 leading causes of death reduce men's life expectancy more than women's. Its latest World Health Statistics report shows that women's lower death rates from heart disease, stroke, lung disease and lung cancer, all closely linked to smoking and drinking, account for much of their advantage.
War widens it
Our World in Data notes that the gap between men and women spikes during wars, because far more men than women are killed. That may be part of the story in Ukraine (9.6 years) and Russia, whose estimates for recent years cover the period of the war that began in 2022, and in Palestine, where the gap is 9.0 years.
Estimates of life expectancy in countries at war are particularly uncertain, and many are modelled rather than measured. But the direction is consistent: conflict shortens men's lives much more than women's.
| # | Widest gap | Years | Narrowest gap | Years |
|---|---|---|---|---|
| 1 | Russia | Togo | ||
| 2 | Latvia | Nigeria | ||
| 3 | Ukraine | Bahrain | ||
| 4 | Georgia | Kuwait | ||
| 5 | Belarus | Qatar | ||
| 6 | Vietnam | Niger | ||
| 7 | Mongolia | UAE | ||
| 8 | Palestine | Guinea | ||
| 9 | Moldova | Liberia | ||
| 10 | El Salvador | Netherlands | ||
| 11 | Thailand | Algeria | ||
| 12 | Estonia | Solomon Islands |
Women's minus men's life expectancy at birth, latest year (2022–2024). Countries over 500,000 people.
The surprises near the top
Not every wide gap is in the former Soviet Union. Vietnam has a gap of 9.3 years, among the widest in the world, and Mongolia 9.2. South Africa's gap is 7.0 years, and Brazil's is 6.2. In parts of Latin America, high rates of violent death among young men are often cited as one reason the male figure lags so far behind.
Rich countries aren't immune either. In Japan, where women have one of the longest life expectancies on the chart, 87.1 years, the gap is 6.0 years, wider than the global average. In Hong Kong, where women live longest of all, 88.2 years, it is 5.5; South Korea's is 5.8 and France's 5.7. In the United States, the CDC's latest figures put women's life expectancy at 81.4 years and men's at 76.5, a gap of 4.9 years, close to the world average; the World Bank's figures, used in the chart, are the same.
Asia's wide gaps
The chart's top rows also include two countries far from the former Soviet Union. Vietnam, where women can expect to live 79.4 years and men 70.1, has one of the widest gaps in the world. Mongolia, next door to Russia and China, is close behind. Thailand, Kazakhstan and El Salvador also have gaps of more than eight years.
Each has its own mix of causes, but the same culprits appear again and again in research on men's health: smoking rates among men that are many times higher than among women, heavy drinking, road deaths, which fall mostly on young men, and violence. None of these is a matter of biology.
Region by region
Averaging across countries, weighted by population, the gap is widest in Europe & Central Asia, at 6.3 years, driven by the former Soviet states, and narrowest in South Asia, at 3.2 years. The regions in between cluster around the world average of about five years.
The table below gives the figure for each region. Because these are averages of very different countries, the spread within a region is often wider than the difference between regions: Europe holds both Latvia, at 9.9 years, and Sweden, at 3.0.
The narrowest gaps
At the bottom of the chart, the gap almost disappears. Togo (0.5 years) and Nigeria (0.6) have the smallest, followed by Bahrain (1.3), Kuwait (1.6), Qatar (1.7) and Niger (1.9). Only 6 countries on the chart have a gap of less than two years.
These countries fall into two quite different groups. In the first, which includes Togo, Nigeria and Niger, life expectancy is low for everyone, and women face risks that men don't, above all in pregnancy and childbirth. Where maternal mortality is high, it eats into women's natural advantage. WHO has noted that the gap tends to be narrowest where women lack access to health services.
The second group is the wealthy Gulf states. In Qatar, Kuwait, Bahrain and the UAE, life expectancy is high and the gap is small. Large shares of their populations are foreign workers, many of whom come for a few years and go home before old age, which makes life expectancy harder to estimate. The small gaps here should be read with care.
Once, men lived longer
The chart shows no country where men outlive women. That wasn't always the case. Until fairly recently, men had a higher life expectancy than women in a few countries, including India, Bangladesh, Pakistan and Iran, according to Our World in Data, largely because of the poor health care and nutrition available to girls and women. Today women live longer in all of them: by 3.1 years in India, 3.4 in Bangladesh, 4.9 in Pakistan and 3.8 in Iran. That reversal is one of the quieter success stories in global health.
| Region | Gap, years | Countries |
|---|---|---|
| Europe & Central Asia | 48 | |
| East Asia & Pacific | 22 | |
| Latin America & Caribbean | 25 | |
| North America | 2 | |
| Sub-Saharan Africa | 46 | |
| Middle East, North Africa, Afghanistan & Pakistan | 23 | |
| South Asia | 6 |
How to read the chart
- Life expectancy at birth is the average number of years a newborn would live if today's death rates at each age stayed the same for the rest of their life. It is a summary of current conditions, not a forecast.
- Latest year. Most countries' figures are for 2024; a few are for 2022 or 2023. Many are estimates modelled by the UN rather than calculated from complete death records.
- Small countries left out. Economies with fewer than 500,000 people are not shown, to keep the chart readable; they are in the data file.
- Sorted by gap. Countries are ordered by the gap in years, not by life expectancy. A country near the bottom can still have a short life expectancy for both sexes.
A gap worth closing, from one side
Public health usually aims to narrow gaps between groups. This one is different. Nobody wants women to live shorter lives; the hope is that men's lives get longer. The chart shows how much room there is. If men in Russia lived as long, relative to women, as men in Sweden do, they would gain about seven years of life. Most of that difference comes down to cigarettes, alcohol, road accidents and violence, which are, at least in principle, things that can change. There is evidence it can: in many rich countries the gap has narrowed over recent decades as men's smoking rates fell, and the countries at the top of this chart are the ones with the most room to follow.
Sources and method
- World Bank, World Development Indicators: Life expectancy at birth, female (SP.DYN.LE00.FE.IN) and male (SP.DYN.LE00.MA.IN). Latest year 2022–2024 per country, API updated October 8, 2026
- Our World in Data, Why do women live longer than men?
Life expectancy at birth is the number of years a newborn would live if death rates at each age stayed as they were in that year. Values are World Bank estimates, largely from the UN World Population Prospects; recent years are modelled for many countries. For each economy we use the latest year (2022 or later) with both a female and a male figure. Economies with fewer than 500,000 people are left out to keep the chart readable; they are in the data file. The gap is women's life expectancy minus men's.
Charts like this, from your own numbers.
Connect a spreadsheet or the tools you run on, and Parity builds the dashboard and writes the report, with every number checked.
Try Parity free