Charts like this, from your own numbers.
Connect a spreadsheet or the tools you run on, and Parity builds the dashboard and writes the report, with every number checked.
Try Parity freeIn 1990 the World Bank's annual World Development Report fixed a number that would shape the next three decades of development policy: $370 a year. Lyn Squire, who directed that report, later wrote that national "poverty lines in the least developed countries clustered around a single figure — $370 a year", and that the famous phrase came from the press office, not the text: "The dollar-a-day poverty line was never mentioned in the report." The phrase was used at the report's press conference on July 5, 1990, and a dollar a day stuck.
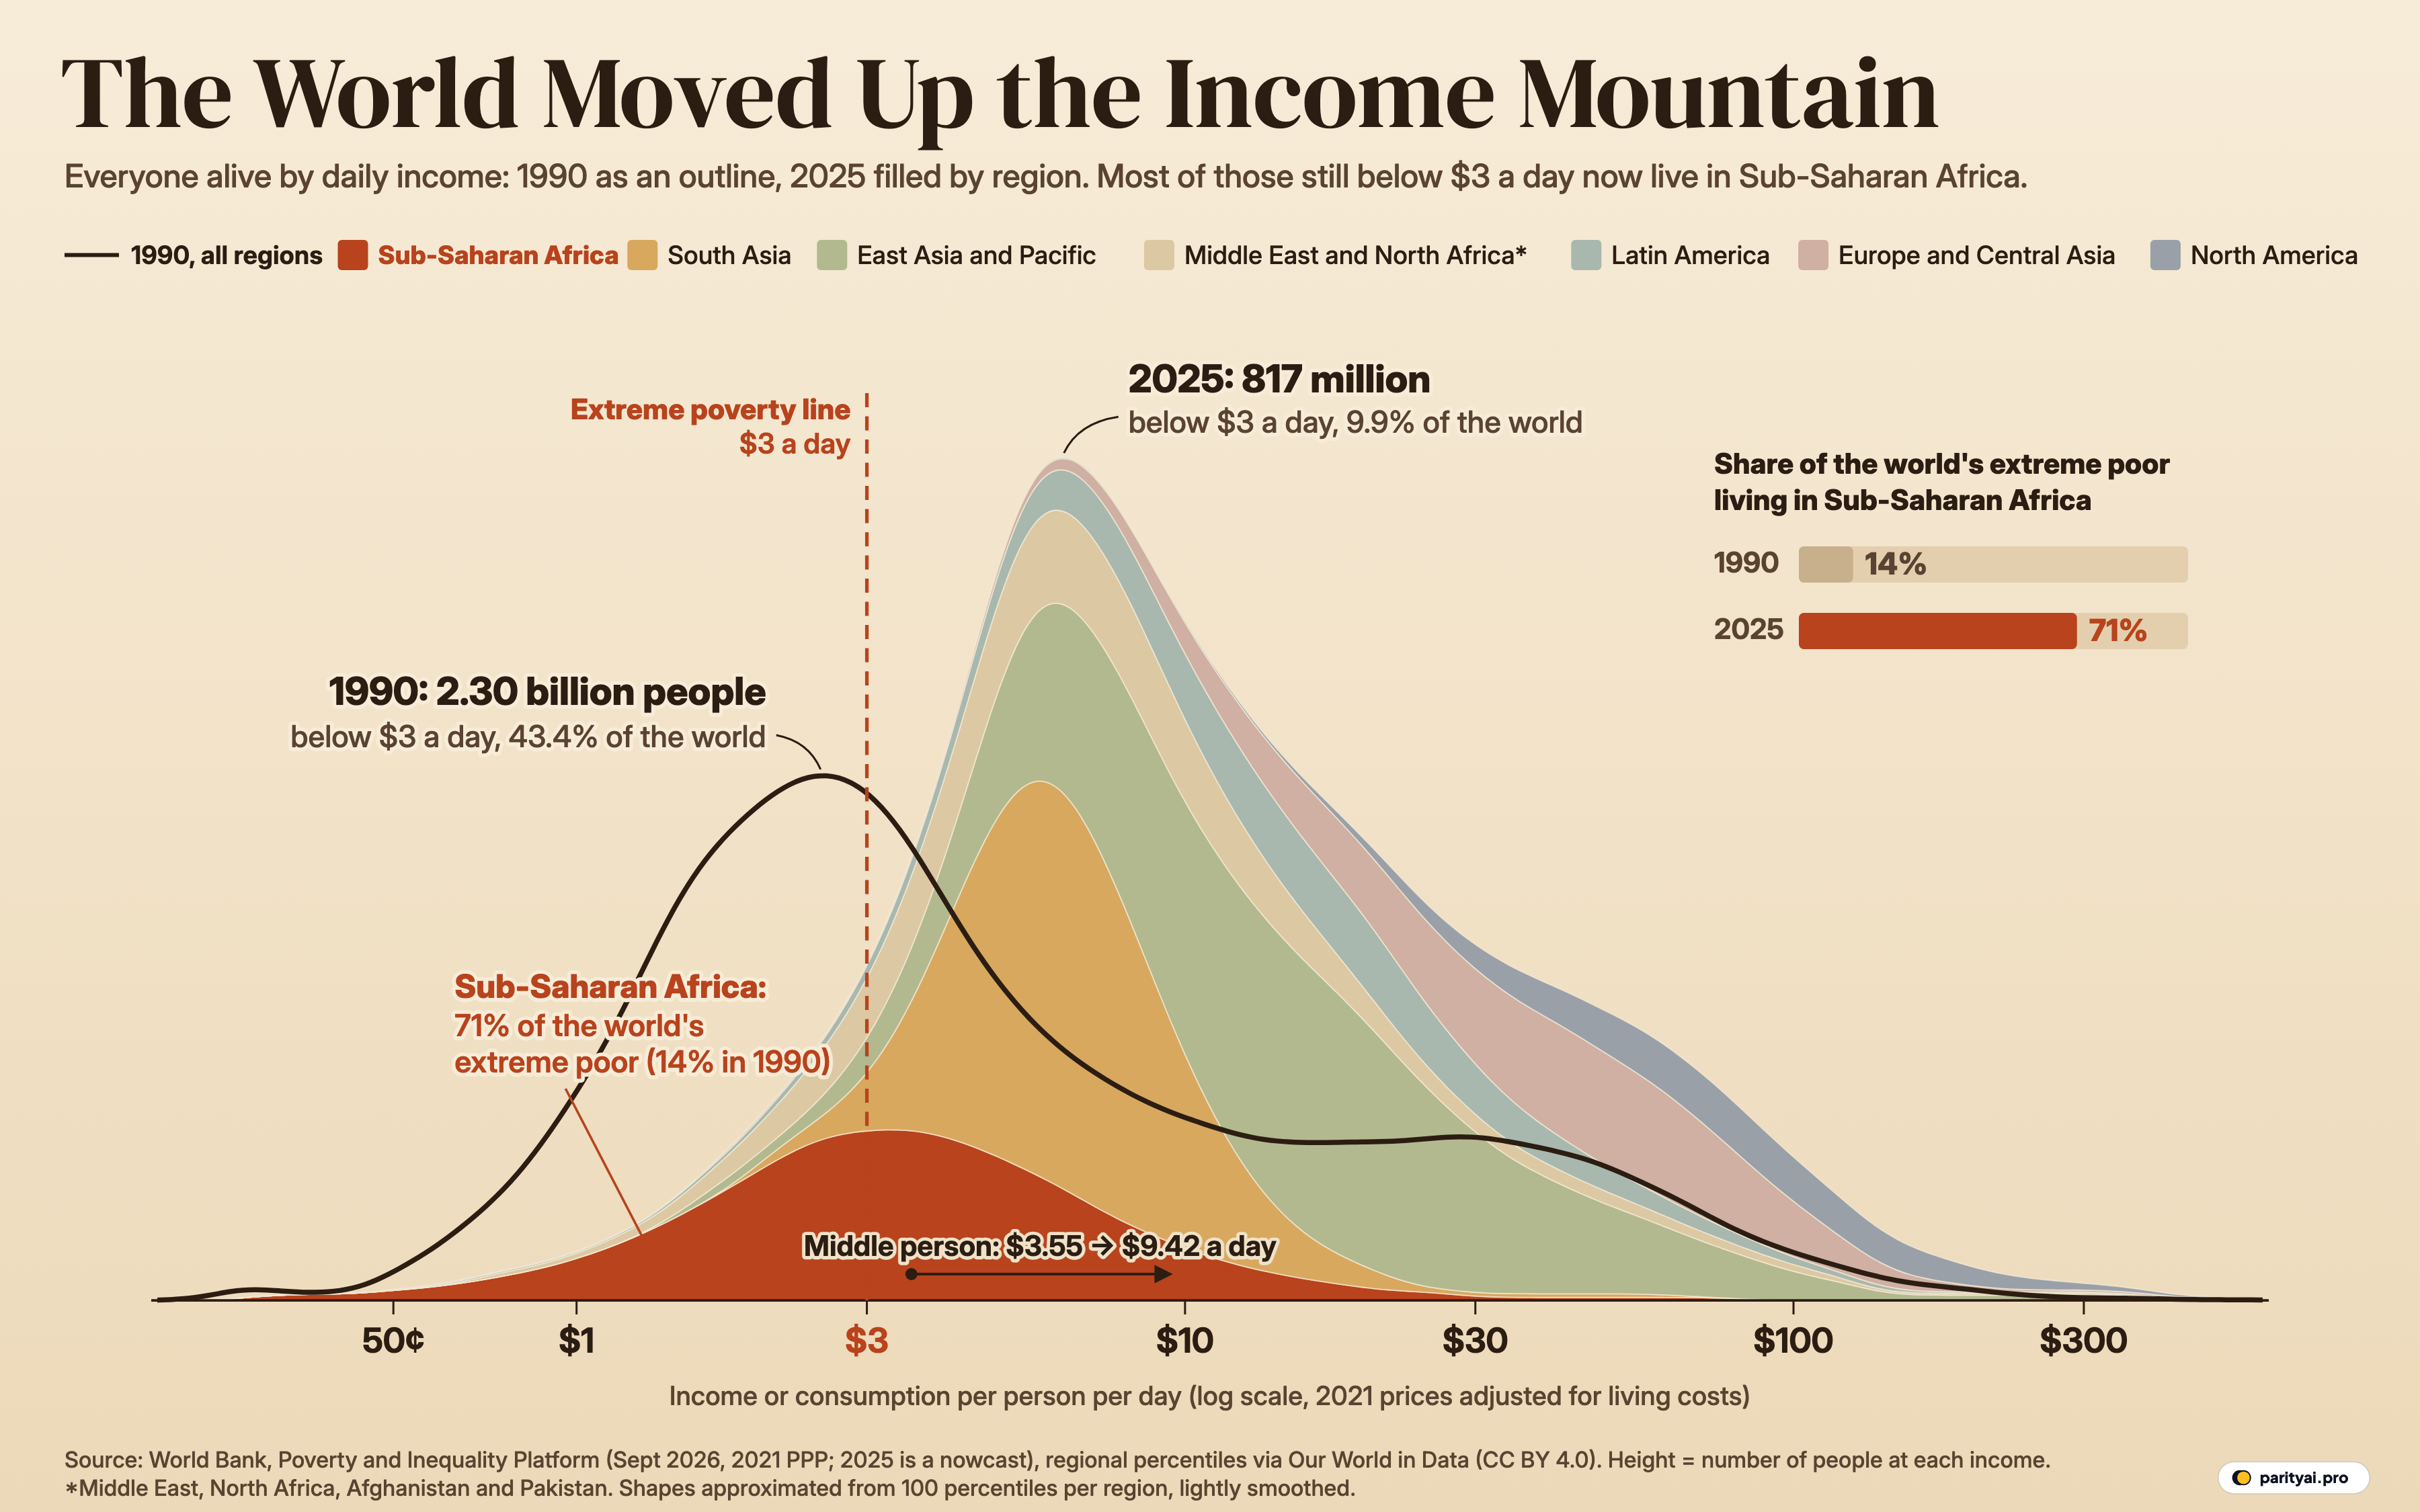
The line has been redrawn since, as prices and survey methods changed. Today it sits at $3.00 a day in 2021 prices, adjusted for what money buys in each country. Measured against that line, 2.30 billion people, 43.4% of everyone alive, were extremely poor in 1990. The World Bank's latest estimate for 2025 is about 817 million, or 9.9%. That is 1.48 billion fewer people below the line, a fall of 64%, while the world's population grew by 2.91 billion.
The same numbers hide a second change, which is the reason for the colour in the chart above. In 1990, Sub-Saharan Africa was home to 14% of the world's extreme poor. In 2025 it is home to 71%.
This piece walks up the income axis of that chart, one marker at a time, from a dollar a day to a hundred.
Reading the mountain before the walk
The graphic lines up everyone on Earth by how much they live on per day. The horizontal axis is income or consumption per person per day, from the World Bank's Poverty and Inequality Platform (PIP), in international dollars at 2021 prices. It is a logarithmic axis: each step from $1 to $3 to $10 to $30 to $100 is roughly a tripling, so a family moving from $1 to $3 a day travels the same distance on the page as one moving from $10 to $30.
The height of the shape at any point is the number of people living at that income. The dark outline is 1990. The filled shape is 2025, stacked by World Bank region, with Sub-Saharan Africa at the bottom in terracotta. The dashed vertical line is the extreme poverty line at $3.
Two things jump out. The whole mass has moved right: the busiest income in 1990 was around $2.58 a day, and in 2025 it is around $6.18. And the 2025 mountain is taller, because there are more people and they are packed into a narrower band of middle incomes. The person exactly in the middle of the world's distribution lived on $3.55 a day in 1990 and lives on $9.42 now, 2.7 times as much.
At $1 a day, the valley floor has almost emptied
Start at the far left, at a dollar a day, a third of today's extreme poverty line. In 1990, about 6% of the world lived on less. In 2025, the share is about 1.2%.
The tail of the outline that trails off to the left of the $1 tick is households whose entire consumption was valued at less than a dollar a day. That includes food they grew themselves: in poorer countries many people produce food for their own use, and, as Our World in Data's notes on the PIP data explain, the surveys estimate what such goods would have cost if bought in a market and count that value.
The poorest tenth of humanity in 1990 lived below $1.22 a day. In 2025, the cut-off for the poorest tenth is $3.01, which means the bottom 10% of the world now sits almost exactly on the extreme poverty line rather than far beneath it.
At $3 a day, the line where the colours change
This is the marker the world has promised to clear. The United Nations' Sustainable Development Goal target 1.1 reads: "By 2030, eradicate extreme poverty for all people everywhere". The $3 figure itself comes from the poorest countries' own standards. The World Bank takes the national poverty lines of 23 low-income countries, finds the median, gets $3.04, and rounds it.
Look at the chart just to the left of the dashed line. In 1990, the outline swells high above it: 2.30 billion people. East Asia and the Pacific held 1,218 million of them, 53% of the world total, and South Asia held 503 million. Sub-Saharan Africa had 321 million.
By 2025, East Asia's count has fallen to 41 million, 1.7% of the region. South Asia's has fallen to 35 million, 2.1% of the region. The region that includes China and Indonesia saw its median person go from $2.09 a day to $14. In South Asia the median rose from $3.01 to $6.35.
Sub-Saharan Africa went the other way in numbers, though not in rates. The share of Africans below $3 fell from 62% in 1990 to 44% in 2025. But the region's population grew from 521 million to 1.32 billion over the same years, so the number of extremely poor people rose from 321 million to 584 million. The 2025 figure is the highest of any year from 1990 to 2025. Sub-Saharan Africa had more extremely poor people than any other region for the first time in 2010, and it has held more than half of the world's total since 2016.
| Region | 1990 | 2025 | Share of region, 2025 | Share of world's extreme poor | Change, millions |
|---|---|---|---|---|---|
| Sub-Saharan Africa | 321m | 584m | 263 | ||
| Middle East, North Africa, Afghanistan and Pakistan | 131m | 121m | ▼ 11 | ||
| East Asia and Pacific | 1,218m | 41m | ▼ 1177 | ||
| South Asia | 503m | 35m | ▼ 468 | ||
| Latin America and the Caribbean | 91m | 27m | ▼ 64 | ||
| Europe and Central Asia | 34m | 5m | ▼ 29 | ||
| North America | 2m | 4m | 2 |
People living on less than $3 a day (2021 prices, adjusted for living costs), from the World Bank's Poverty and Inequality Platform. 2025 values are nowcasts. Middle East and North Africa includes Afghanistan and Pakistan under the World Bank's current regions.
Within the region the burden is uneven. The World Bank splits Sub-Saharan Africa into two halves: Eastern and Southern Africa, with 398 million people below $3 in 2025 (50% of its population), and Western and Central Africa, with 186 million (35%). The second figure deserves a warning. The World Bank says coverage is "particularly limited in West Africa due to the absence of recent data for Nigeria."
The one other region where the count is climbing is the Middle East, North Africa, Afghanistan and Pakistan, as the World Bank now groups it. It had 131 million people below $3 in 1990 and 121 million in 2025, 14.6% of its population and 15% of the global total. The World Bank's September 2026 update notes that extreme poverty rates are below 5% "in all regions except" these two.
The global decline has also slowed. The count was 837 million in 2019, rose to 896 million in 2020, and has drifted down to 817 million in 2025. The World Bank's Poverty, Prosperity, and Planet Report 2026 puts it bluntly: "Global progress on reducing extreme poverty has come to a standstill".
At $10 a day, the world splits almost in half
Climb past $3 and the chart gets crowded. This is where most of humanity now lives. In 1990, 1.58 billion people lived between $3 and $10 a day. In 2025, 3.46 billion do. The peak of the 2025 mountain sits in this stretch, made mostly of South Asia's ochre band and East Asia's green one.
The World Bank draws two more lines on the way up. It uses $4.20 a day as a typical poverty line for lower-middle-income countries and $8.30 for upper-middle-income ones. In 2025, 18% of the world lives below $4.20 and 45% below $8.30. The second number is where the progress looks thinnest: in 1990, 3.73 billion people lived below $8.30, and in 2025, 3.71 billion still do. The share has fallen from 70% to 45%, but because the world added billions of people, the count is almost unchanged. The 2026 report describes it as "Nearly half of humanity, 3.7 billion people".
The $10 marker is roughly where the middle of the world sits today. In 1990, 73% of people lived on less than $10 a day. In 2025, 52% do, so close to half are now above it. In absolute terms, the number above $10 rose from 1.42 billion to 3.93 billion.
For Sub-Saharan Africa, $10 is still near the top of the trail: 92% of the region's people live below it. The region's median person lives on $3.34 a day, up from $2.30 in 1990. That median sits close to the extreme poverty line, which is why the terracotta hump in the chart straddles the dashed line instead of sitting clear of it.
| Daily income | Below it, 1990 | Below it, 2025 | Change, points | Sub-Saharan Africa below it, 2025 | North America below it, 2025 |
|---|---|---|---|---|---|
| $1 a day | ▼ 5 | 5.9% | 0.5% | ||
| $3 a day | ▼ 33 | 44.1% | 1.0% | ||
| $10 a day | ▼ 21 | 91.9% | 2.0% | ||
| $30 a day | ▼ 7 | 99.1% | 12.4% | ||
| $100 a day | ▼ 2 | 100.0% | 67.8% |
Interpolated from the World Bank's world and regional percentile thresholds (pooled 1000-bin distributions, 2021 prices). These shares can differ by a fraction of a point from the headcounts in the other tables, which come straight from PIP.
At $30 a day, the slope thins out
Past $10 the mountain falls away steadily. At $30 a day, a little under $11,000 a year per person at 2021 prices, the pink and grey bands of Europe and Central Asia (which, in the World Bank's current regions, includes Western Europe) and North America take up a growing share of the right-hand slope.
In 1990, 13% of the world lived above $30 a day. In 2025, 20% do. In North America, 88% of people are above that marker. In Sub-Saharan Africa, 0.9% are.
The median person in Europe and Central Asia lives on $39 a day. In North America the median rose from $52 in 1990 to $72 in 2025. Latin America and the Caribbean sits in between, with a median of $15 and 4.1% of its people below $3.
One thing the chart shows that a single poverty rate cannot is the gap between the two humps. In 1990, the outline had a high peak on the left and a long, low shoulder out toward $30 and $40: a poor world and a rich world with little between them. In 2025, the shoulder has been swallowed by a single mountain whose peak has moved toward the middle. The world's income distribution is far less bimodal than it was.
At $100 a day, a summit few reach
The final marker, $100 a day, is about $36,500 a year per person, before any adjustment for household size. It is well into the incomes of rich countries. In 1990, 1.5% of the world lived above it. In 2025, 3.4% do. In North America the share is 32%.
The richest 1% of the world in 1990 began at $114 a day. In 2025, they begin at $165. The poorest 10% began at $1.22 and now begin at $3.01. Measured this way, the bottom of the distribution has grown faster than the top, which is the rightward shift the chart shows on its left flank. The top of the chart is also the least reliable part, as the next section explains.
What the altimeter can't measure
A few honest limits on everything above.
Income and consumption are mixed. PIP uses household surveys. For most low- and middle-income countries they measure consumption, and for most rich countries income after taxes and benefits. The two are related but not the same, so the mountain mixes two slightly different measures.
The latest years are estimates. The September 2026 release "provides estimates through 2024 and nowcasts for 2025 and 2026," according to the World Bank. Countries without a recent survey are lined up using growth in national accounts. The 2025 shape is therefore partly a projection, and it will be revised.
Revisions can be large. When the line moved to $3, the World Bank revised its 2022 count up by about 125 million, from 713 million to 838 million. Most of that came from Sub-Saharan Africa, which gained 111 million, while South Asia's estimate fell by 45 million. The September 2026 update moved the global rate again, down by 0.3 percentage points. The regional story in this piece holds across those revisions, but exact counts should be read as estimates with a margin.
The shapes are approximated. The counts below $3, and between the other lines, come straight from PIP. The mountain shapes are built from 99 percentile thresholds per region. Our World in Data calculated these by pooling the World Bank's 1000 Binned Global Distribution. We spread each 1% of a region's population evenly between its thresholds on the log axis and smooth the result lightly. The far right tail, the top 1% of each region, rests on a rough assumption about how spread out the richest are. Nothing to the right of $100 should be read too closely.
Regions are current World Bank groupings. Japan, Australia and New Zealand sit in East Asia and Pacific. Western Europe sits in Europe and Central Asia. Afghanistan and Pakistan are grouped with the Middle East and North Africa.
| Year | Below $3 a day | Share of world | In Sub-Saharan Africa | Africa's share of the poor | World median, $/day |
|---|---|---|---|---|---|
| 1990 | 43.4% | 321m | $3.55 | ||
| 1991 | 43.1% | 336m | $3.57 | ||
| 1992 | 42.5% | 351m | $3.61 | ||
| 1993 | 42.1% | 365m | $3.64 | ||
| 1994 | 40.7% | 375m | $3.72 | ||
| 1995 | 39.4% | 384m | $3.82 | ||
| 1996 | 38.1% | 391m | $3.91 | ||
| 1997 | 37.7% | 399m | $3.96 | ||
| 1998 | 37.9% | 410m | $3.96 | ||
| 1999 | 37.3% | 419m | $3.98 | ||
| 2000 | 36.2% | 425m | $4.10 | ||
| 2001 | 35.3% | 428m | $4.21 | ||
| 2002 | 33.7% | 437m | $4.36 | ||
| 2003 | 32.2% | 442m | $4.51 | ||
| 2004 | 30.3% | 432m | $4.72 | ||
| 2005 | 28.3% | 432m | $4.92 | ||
| 2006 | 27.0% | 435m | $5.12 | ||
| 2007 | 25.3% | 437m | $5.36 | ||
| 2008 | 24.1% | 439m | $5.53 | ||
| 2009 | 23.1% | 447m | $5.71 | ||
| 2010 | 21.0% | 442m | $6.03 | ||
| 2011 | 19.1% | 445m | $6.34 | ||
| 2012 | 17.8% | 446m | $6.61 | ||
| 2013 | 15.5% | 448m | $7.00 | ||
| 2014 | 14.5% | 452m | $7.26 | ||
| 2015 | 13.4% | 465m | $7.53 | ||
| 2016 | 12.6% | 475m | $7.77 | ||
| 2017 | 11.8% | 482m | $7.98 | ||
| 2018 | 11.1% | 490m | $8.22 | ||
| 2019 | 10.8% | 500m | $8.39 | ||
| 2020 | 11.4% | 538m | $8.20 | ||
| 2021 | 11.3% | 553m | $8.61 | ||
| 2022 | 10.9% | 561m | $8.70 | ||
| 2023 | 10.5% | 574m | $9.00 | ||
| 2024 | 10.1% | 581m | $9.20 | ||
| 2025 | 9.9% | 584m | $9.42 |
World Bank PIP line-up estimates; recent years are nowcasts and will be revised as new surveys arrive. Sub-Saharan Africa is the World Bank region (Eastern and Southern plus Western and Central Africa).
The trail from here
Scroll down the yearly table and two columns move in opposite directions. The number of extremely poor people falls from 2.30 billion in 1990 to 2.23 billion in 2000 and 1.47 billion in 2010, then keeps falling until the curve flattens near 817 million. Sub-Saharan Africa's share of them climbs every decade: 14%, then 19% in 2000, 30% in 2010, 60% in 2019 and 71% in 2025.
The first column is the success story of the age. The huge hump of poverty in East and South Asia that dominates the left of the 1990 outline is mostly gone. The second column is the unfinished business. The World Bank's 2026 report projects that "by 2030, 87 percent will be in Sub-Saharan Africa, in fragile and conflict-affected situations, or both."
On the chart, the remaining climb is the terracotta band on the left. Sub-Saharan Africa is 16% of the world's population and 71% of its extreme poor. Its median person stands at $3.34 a day, just past the marker everyone else has left behind. Ending extreme poverty by 2030, as the world promised, now depends on that one band moving right.
Sources and method
- World Bank (2026), Poverty and Inequality Platform (version 20260922, 2021 PPP), via Our World in Data. Headcounts of people between poverty lines by World Bank region, 1990–2026, retrieved November 10, 2026. Licence: Creative Commons Attribution 4.0 (CC BY 4.0).
- World Bank (2026), 1000 Binned Global Distribution and PIP: Percentiles; regional percentiles calculated by Our World in Data. Regional income or consumption thresholds for each percentile, 1990–2026. World Bank data licensed CC BY 4.0 (datacatalog.worldbank.org/search/dataset/0064304); Our World in Data processing CC BY 4.0.
Daily income means household income or consumption per person per day, in international dollars at 2021 prices (purchasing power parity), as measured by the World Bank's Poverty and Inequality Platform; most low- and middle-income countries measure consumption, most rich countries income after taxes and benefits. Regional and world figures for years without a recent survey are the World Bank's line-up estimates, and the latest years (including 2025) are nowcasts extrapolated from national accounts growth. Headcounts below $3 a day and population totals come from the PIP headcounts between poverty lines. The mountain shapes come from Our World in Data's regional percentiles, which pool the World Bank's 1000-bin country distributions: each region's population is split into 100 equal groups between consecutive percentile thresholds and spread evenly on a log scale; the bottom group runs from a log-symmetric point below its average up to the first threshold, and the top 1% is spread from the 99th-percentile threshold to three times that value (a simplifying assumption that only affects the far right tail). The curves are then lightly smoothed on the log axis. Regions follow the World Bank's current classification, in which Europe and Central Asia includes Western Europe and East Asia and Pacific includes Japan, Australia and New Zealand.
Charts like this, from your own numbers.
Connect a spreadsheet or the tools you run on, and Parity builds the dashboard and writes the report, with every number checked.
Try Parity free

