Charts like this, from your own numbers.
Connect a spreadsheet or the tools you run on, and Parity builds the dashboard and writes the report, with every number checked.
Try Parity freeEvery country's population changes a little each year: babies are born, people die, people move in and out. Add up all those changes for 2025 and, by the World Bank's estimates, the world ended the year with 74.6 million more people than it started with. The global total went from 8.12 billion to 8.19 billion, growth of 0.9%.
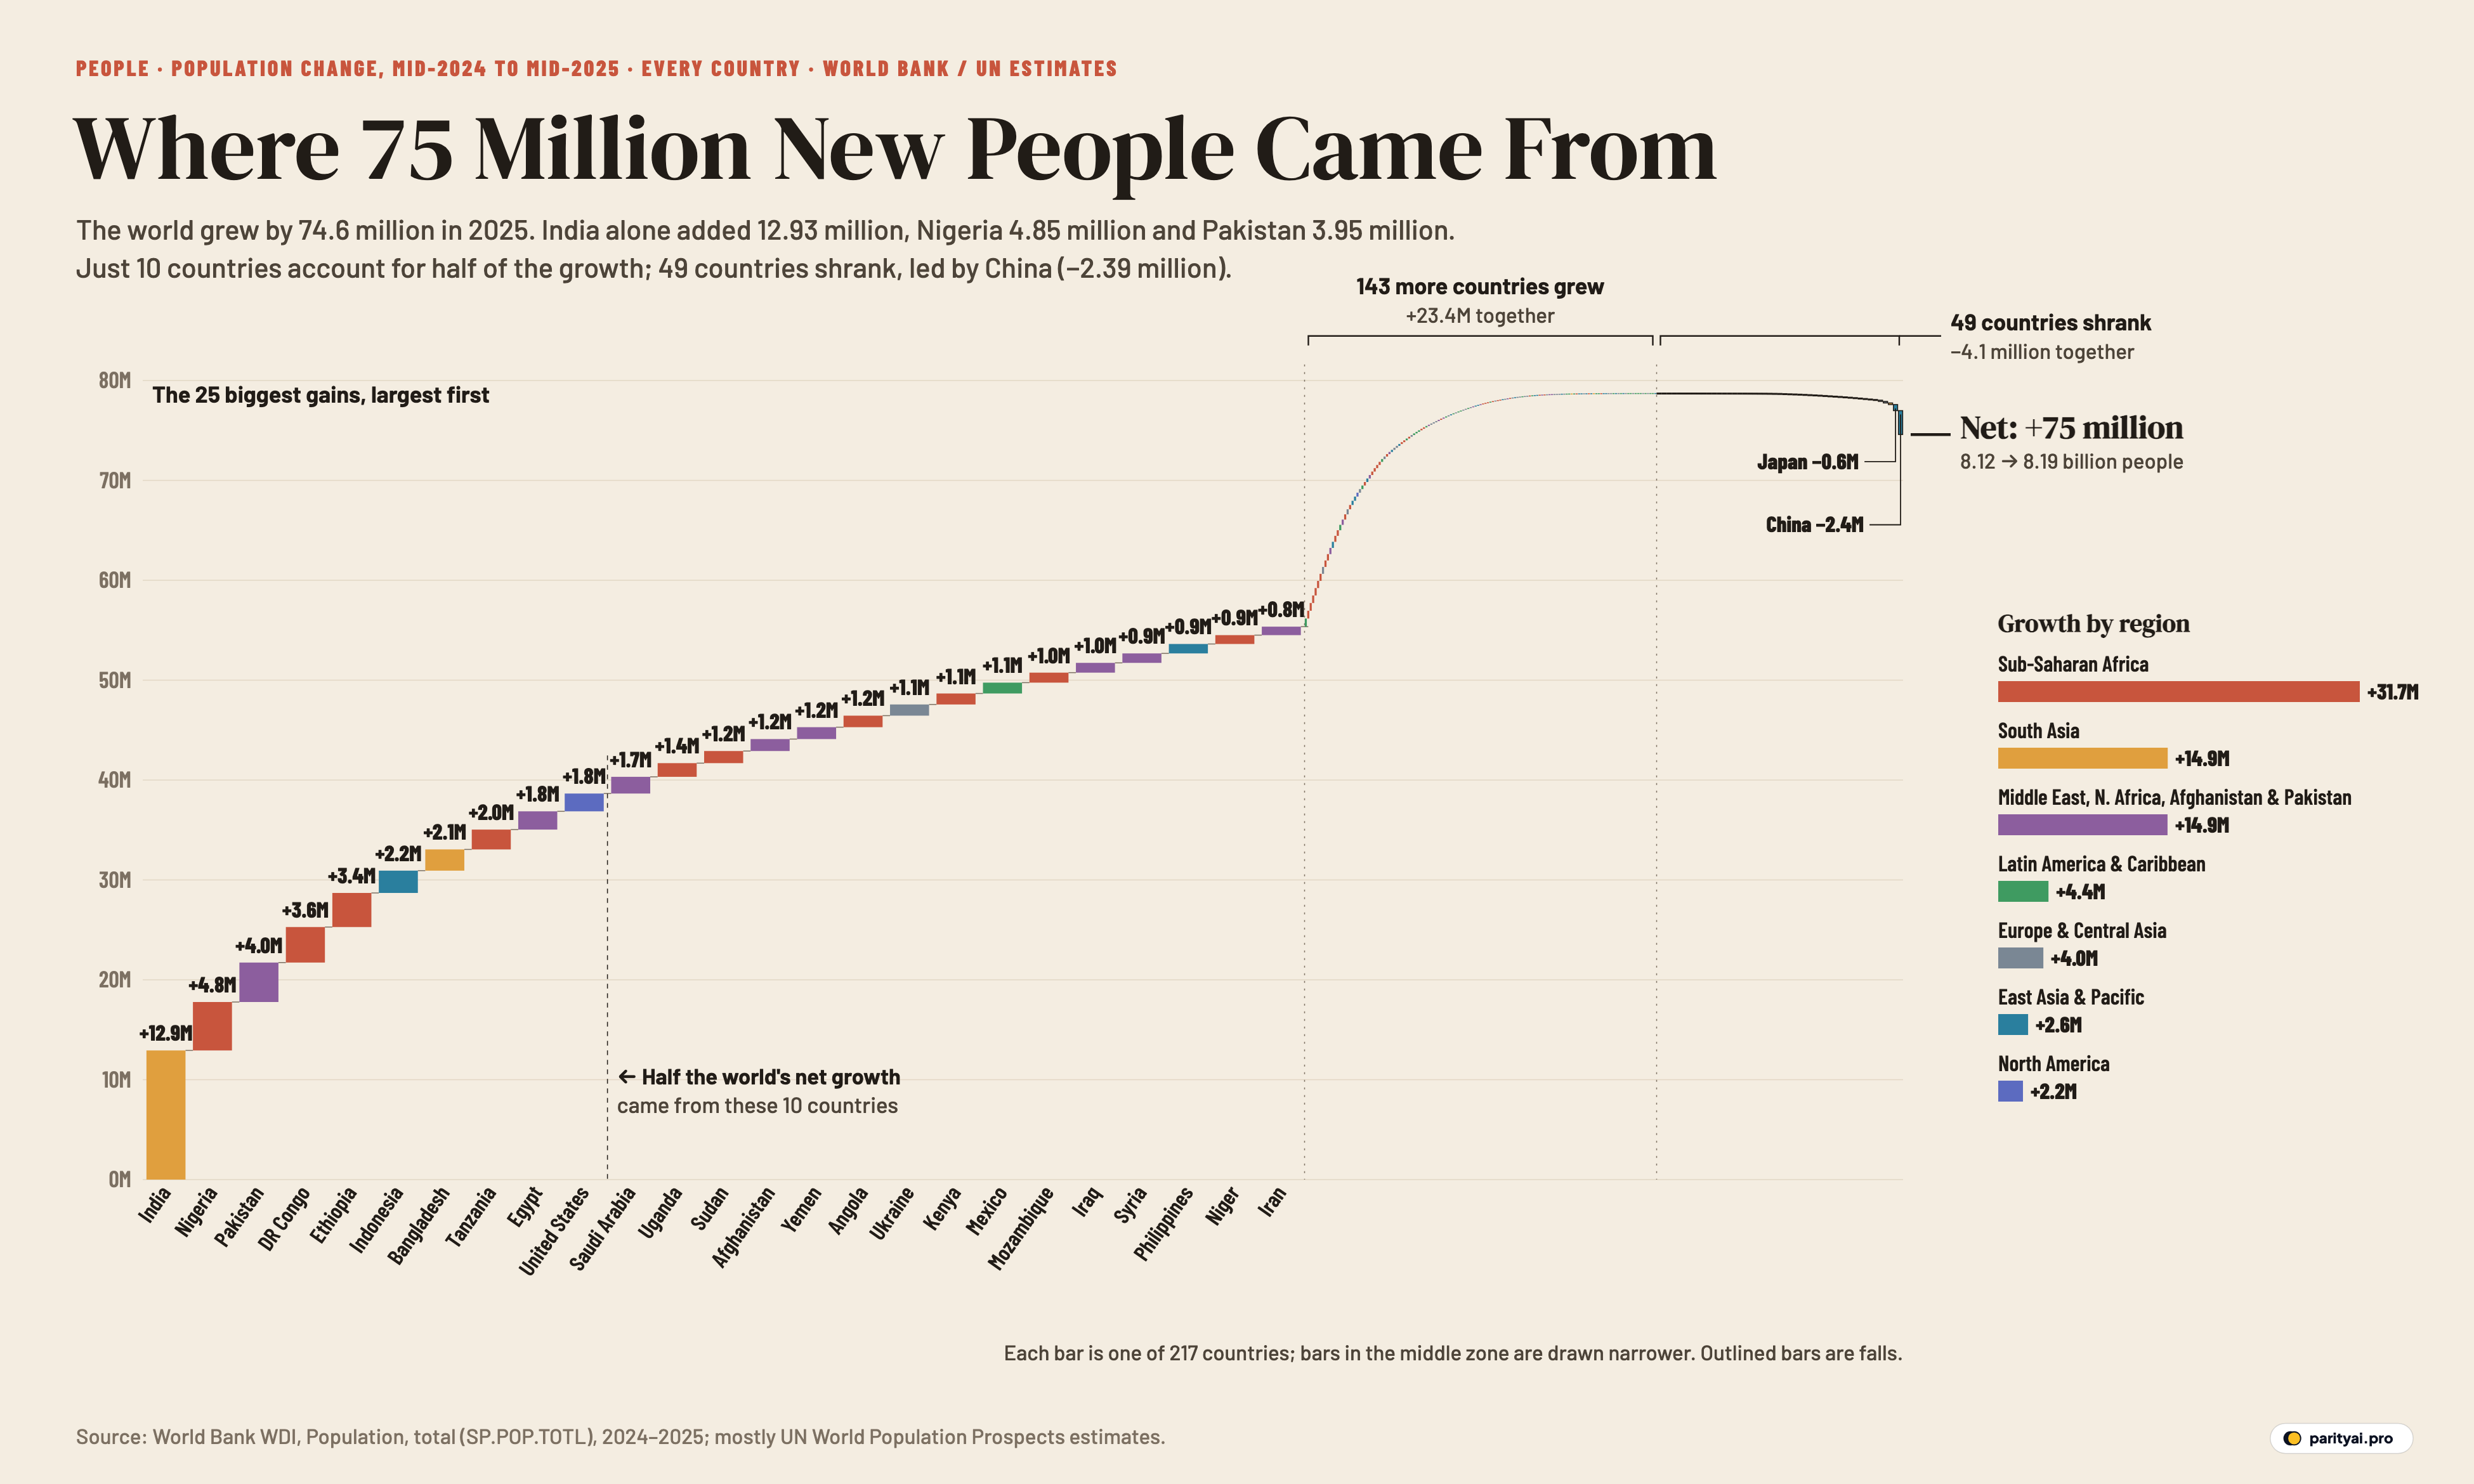
That single number hides a very lopsided distribution. The waterfall chart above breaks it down country by country. Each bar is one of 217 economies, starting from zero at the left. Each country's gain lifts the running total by the height of its bar, like a staircase: the biggest gains come first, then the long tail of small ones, then the countries that shrank, which step the total back down. The final level, on the right, is the world's net growth. To keep the big gains readable, the 25 largest get wide bars, the next 143 are squeezed into the middle, and the 49 countries that lost people are drawn at the far right.
The staircase is easiest to read in bands, from the tallest steps to the ones that go down.
More than 10 million: India
The first step towers over everything else. India's population grew by 12.93 million between mid-2024 and mid-2025, on the World Bank's figures, to about 1463.9 million. That is 17.3% of the world's net growth from one country. India's growth rate is not unusually high, at 0.9% a year, but it is applied to a vast base.
India passed China as the world's most populous country in 2023. The UN projected that in April 2023, China is projected to cede its long-held status as the world's most populous country to India. On these estimates the gap between them was 57.3 million by mid-2025.
Three to five million: Nigeria, Pakistan, DR Congo, Ethiopia
The next four steps are each between three and five million people. Nigeria grew by 4.8 million, Pakistan by 4.0 million, DR Congo by 3.6 million and Ethiopia by 3.4 million.
Here the growth rates are much faster. DR Congo's population grew by 3.3% in a single year, Ethiopia's by 2.6% and Nigeria's by 2.1%. Pakistan's grew by 1.6%, Tanzania's by 2.9%, Uganda's by 2.7% and Egypt's by 1.6%. In the UN's World Population Prospects, the populations of nine places, including DR Congo, Tanzania, Niger and Somalia, are likely to at least double between 2024 and 2054.
By the time the staircase reaches the tenth step, it has covered half of the world's net growth. India, Nigeria, Pakistan, DR Congo, Ethiopia, Indonesia, Bangladesh, Tanzania, Egypt and the United States together added more people than the other 207 economies combined.
One to two and a half million: a mixed group
The next band, between one and two and a half million, is the most varied. It includes Indonesia (2.2 million), Bangladesh (2.1 million), Tanzania (2.0 million) and Egypt (1.8 million). Afghanistan added 1.20 million, Sudan 1.21 million and Kenya 1.10 million. The band also includes the United States and Saudi Arabia.
The United States added 1.78 million, a growth rate of 0.5%. The Census Bureau's own estimate for the same year is similar: it put the population at 341.8 million on July 1, 2025, up 1.8 million, and said net international migration had dropped from 2.7 million to 1.3 million over the year. Saudi Arabia added 1.67 million, a growth rate of 4.7%, one of the fastest in the world among larger countries. The three fastest-growing countries with more than a million people were United Arab Emirates (4.8%), Saudi Arabia (4.7%) and Oman (4.0%), all on the Arabian Peninsula.
Ukraine also appears in this band, with an estimated gain of 1.12 million. That figure should be treated with caution. It is a model estimate for a country at war, where the true number of residents is very uncertain, not a count.
| # | Country | Change, 2024–25 | Growth rate | Population 2025 |
|---|---|---|---|---|
| 1 | India | ▲ 12,929,734 | 0.9% | 1,463,865,525 |
| 2 | Nigeria | ▲ 4,848,304 | 2.1% | 237,527,782 |
| 3 | Pakistan | ▲ 3,950,390 | 1.6% | 255,219,554 |
| 4 | DR Congo | ▲ 3,556,208 | 3.3% | 112,832,473 |
| 5 | Ethiopia | ▲ 3,412,284 | 2.6% | 135,472,051 |
| 6 | Indonesia | ▲ 2,233,305 | 0.8% | 285,721,236 |
| 7 | Bangladesh | ▲ 2,124,535 | 1.2% | 175,686,899 |
| 8 | Tanzania | ▲ 1,985,708 | 2.9% | 70,545,865 |
| 9 | Egypt | ▲ 1,827,737 | 1.6% | 118,365,995 |
| 10 | United States | ▲ 1,781,060 | 0.5% | 341,784,857 |
| 11 | Saudi Arabia | ▲ 1,673,275 | 4.7% | 36,973,555 |
| 12 | Uganda | ▲ 1,369,802 | 2.7% | 51,384,894 |
| 13 | Sudan | ▲ 1,213,184 | 2.4% | 51,662,147 |
| 14 | Afghanistan | ▲ 1,196,619 | 2.8% | 43,844,111 |
| 15 | Yemen | ▲ 1,190,714 | 2.9% | 41,773,878 |
| 16 | Angola | ▲ 1,154,190 | 3.0% | 39,040,039 |
| 17 | Ukraine | ▲ 1,120,155 | 3.0% | 38,980,376 |
| 18 | Kenya | ▲ 1,099,549 | 1.9% | 57,532,493 |
| 19 | Mexico | ▲ 1,085,893 | 0.8% | 131,946,900 |
| 20 | Mozambique | ▲ 999,887 | 2.9% | 35,631,653 |
| Greenland | ▼ 5 | -0.0% | 56,831 | |
| Palau | ▼ 32 | -0.2% | 17,663 | |
| Isle of Man | ▼ 42 | -0.0% | 84,118 | |
| Bermuda | ▼ 81 | -0.1% | 64,555 | |
| Tuvalu | ▼ 154 | -1.6% | 9,492 | |
| Monaco | ▼ 290 | -0.8% | 38,341 | |
| Dominica | ▼ 334 | -0.5% | 65,871 | |
| Montenegro | ▼ 396 | -0.1% | 623,129 | |
| Tonga | ▼ 433 | -0.4% | 103,742 | |
| Trinidad and Tobago | ▼ 569 | -0.0% | 1,367,764 | |
| Virgin Islands (U.S.) | ▼ 585 | -0.6% | 103,792 | |
| St. Vincent and the Grenadines | ▼ 692 | -0.7% | 99,924 | |
| American Samoa | ▼ 736 | -1.6% | 46,029 | |
| Northern Mariana Islands | ▼ 737 | -1.7% | 43,541 | |
| Macao | ▼ 1,100 | -0.2% | 685,900 | |
| St. Martin (French part) | ▼ 1,188 | -4.5% | 24,941 | |
| Marshall Islands | ▼ 1,266 | -3.4% | 36,282 | |
| Uruguay | ▼ 1,900 | -0.1% | 3,384,688 | |
| Mauritius | ▼ 2,038 | -0.2% | 1,243,741 | |
| Jamaica | ▼ 2,098 | -0.1% | 2,837,077 | |
| North Macedonia | ▼ 3,450 | -0.2% | 1,820,909 | |
| Estonia | ▼ 5,866 | -0.4% | 1,366,475 | |
| Bulgaria | ▼ 8,119 | -0.1% | 6,433,302 | |
| Slovakia | ▼ 8,256 | -0.2% | 5,413,813 | |
| Kosovo | ▼ 17,477 | -1.1% | 1,576,876 | |
| Puerto Rico (US) | ▼ 17,686 | -0.6% | 3,184,835 | |
| Czechia | ▼ 18,150 | -0.2% | 10,886,878 | |
| Latvia | ▼ 18,339 | -1.0% | 1,847,785 | |
| Bosnia & Herzegovina | ▼ 24,158 | -0.8% | 3,140,095 | |
| Hong Kong | ▼ 25,200 | -0.3% | 7,498,900 | |
| Germany | ▼ 25,344 | -0.0% | 83,491,249 | |
| Albania | ▼ 27,548 | -1.2% | 2,349,580 | |
| Romania | ▼ 31,533 | -0.2% | 19,020,271 | |
| Kuwait | ▼ 31,965 | -0.7% | 4,865,298 | |
| Jordan | ▼ 32,192 | -0.3% | 11,520,684 | |
| Nepal | ▼ 32,936 | -0.1% | 29,618,118 | |
| Italy | ▼ 37,048 | -0.1% | 58,915,656 | |
| Serbia | ▼ 37,333 | -0.6% | 6,549,143 | |
| Moldova | ▼ 41,779 | -1.7% | 2,360,527 | |
| Cuba | ▼ 42,580 | -0.4% | 10,937,203 | |
| Belarus | ▼ 46,638 | -0.5% | 9,085,991 | |
| Hungary | ▼ 47,814 | -0.5% | 9,514,251 | |
| Thailand | ▼ 48,148 | -0.1% | 71,619,863 | |
| South Korea | ▼ 66,501 | -0.1% | 51,684,564 | |
| Poland | ▼ 123,372 | -0.3% | 36,435,861 | |
| Russia | ▼ 156,320 | -0.1% | 143,513,328 | |
| Sri Lanka | ▼ 160,000 | -0.7% | 21,756,000 | |
| Japan | ▼ 608,637 | -0.5% | 123,366,734 | |
| China | ▼ 2,390,000 | -0.2% | 1,406,585,000 |
Highlighted rows lost population. World Bank (UN WPP-based) mid-year estimates.
Under a million: the long tail
After the first 25 countries, the staircase flattens into a long gentle slope: 168 countries grew in all, most by less than a million. This tail includes most of Latin America, where Brazil added 814,000 and Mexico 1.09 million; the Philippines, at 943,000; and many European countries growing slowly through immigration. The United Kingdom added 206,000 on these estimates, Spain 506,000 and Canada 389,000. For many of these countries, arrivals from abroad matter more than births: the UN expects immigration to be the main driver of population growth in 52 countries and areas through 2054, including Australia, Canada and the United States.
Taken together, these small steps matter. The countries outside the top 25 added about 23 million people between them, almost a third of the world's net growth.
A different ranking: speed
The waterfall ranks countries by how many people they added. Ranked instead by how fast they grew, the list looks different. After the United Arab Emirates, Saudi Arabia and Oman come Qatar (4.0%), Syria (3.8%), Chad (3.5%), Central African Republic (3.4%), Somalia (3.4%), Niger (3.3%) and DR Congo (3.3%). Several of these are small countries, so their bars on the waterfall are short even though their populations are growing faster than India's.
At the other end, among countries with at least a million people, 33 shrank, and the steepest fall in percentage terms was in Moldova, at −1.7%. A growth rate of 2.5% a year doubles a population in about 28 years; a fall of half a percent a year, sustained, takes off a tenth in two decades.
Below zero
At the far right of the chart, the staircase steps down. 49 countries lost population in 2025, removing 4.1 million from the total.
China accounts for most of that. Its population fell by -2.39 million on the World Bank's mid-year estimates, to about 1406.6 million. China's National Bureau of Statistics, which measures at the end of the calendar year, reported a larger fall: the population was 1,404.89 million at the end of 2025, with 7.92 million births and 11.31 million deaths. India's gain this year was 5.4 times the size of China's loss.
Japan comes next, down 609,000. Counting only Japanese nationals, the resident registry fell below 120 million at the start of 2026, down by 917,000 in a year, the largest annual decline since comparable records began in 1968. Japan's 2025 census counted 123.05 million people on October 1 and noted that "the rate of decline accelerated". Then come smaller falls in Sri Lanka (160,000), Russia (156,000), Poland (123,000) and South Korea (67,000). South Korea's decline is slowing: births there rose 6.7 percent in 2025, to 254,300. Italy's population slipped by about 37,000 and Germany's by about 25,000. ISTAT, Italy's statistics office, estimated 355 thousand births in 2025 against 652,000 deaths.
The shrinking countries are concentrated in Europe and East Asia. 22 of the 58 economies in the Europe and Central Asia region lost population, and 12 of the 37 in East Asia and the Pacific. In Sub-Saharan Africa, only one of 48 did.
| Region | Added | Share of world growth | Growth rate | Countries shrinking |
|---|---|---|---|---|
| Sub-Saharan Africa | 42.5% | 2.5% | 1 of 48 | |
| South Asia | 19.9% | 0.9% | 2 of 6 | |
| Middle East, N. Africa, Afghanistan & Pakistan | 19.9% | 1.8% | 2 of 23 | |
| Latin America & Caribbean | 5.9% | 0.7% | 9 of 42 | |
| Europe & Central Asia | 5.3% | 0.4% | 22 of 58 | |
| East Asia & Pacific | 3.5% | 0.1% | 12 of 37 | |
| North America | 2.9% | 0.6% | 1 of 3 |
The regional picture
Group the steps by region and the shape of world population growth is clear. Sub-Saharan Africa added 31.7 million, 42.5% of the net total, with a growth rate of 2.5%. South Asia and the Middle East and North Africa region (which in the World Bank's grouping includes Afghanistan and Pakistan) added about 14.9 million each. Latin America and the Caribbean added 4.4 million, Europe and Central Asia 4.0 million, East Asia and the Pacific 2.6 million and North America 2.2 million.
East Asia and the Pacific, the most populous region on the chart, grew by just 0.1%. Its gains in Indonesia, the Philippines and elsewhere were almost cancelled out by China's and Japan's losses.
What the estimates are
These are mid-year estimates from the World Bank, mostly drawn from the UN's World Population Prospects, and for 2025 many are projections built from the last census and recent trends rather than fresh counts. National statistics offices often publish different figures, measured at different times of year, as the Chinese and American examples show. The change for any one country can be revised by hundreds of thousands when new census data arrive. A year earlier, the same series shows the world growing by 77.9 million, slightly more than in 2025.
The changes also mix three things that the chart does not separate: births, deaths and migration. Migration moves people between countries without changing the world total, so it shifts steps from one country to another; births and deaths are what change the total.
Where the staircase goes
The UN expects the staircase to keep shrinking. In its 2024 projections the world population reaches a peak of around 10.3 billion people in the mid-2080s, and in 63 countries and areas, holding 28% of the world's people, the population has already peaked. As more countries join the right-hand side of the chart, the bars below zero will grow and the final step will fall. For now, the climb is still steep at the start: one country in South Asia and a handful in Africa are doing most of the climbing.
Sources and method
- World Bank, World Development Indicators: Population, total (SP.POP.TOTL). 2024 and 2025, API updated October 8, 2026; mostly UN World Population Prospects estimates
- United Nations, World Population Prospects 2024
Each step is a country's mid-year population in 2025 minus its population in 2024, as published by the World Bank. For most countries these are estimates from the UN's World Population Prospects 2024 and national statistical offices; for 2025 many are projections rather than counts. The change combines births, deaths and net migration. The world total is the sum of the 217 economies with figures for both years. Colours follow the World Bank's regional groups.
Charts like this, from your own numbers.
Connect a spreadsheet or the tools you run on, and Parity builds the dashboard and writes the report, with every number checked.
Try Parity free

