Wrenwood Soap Co., the example business in this guide, makes five products. On a materials-only view, the mini soap trio looks healthy: it sells for $12 and its soap, tins and box cost $4.90, so 59% is left over. Then you add what every online order of it actually costs: $4.20 of shipping and packing time and a $0.40 card fee. What's left per trio is $2.50. The classic bar, at $9, leaves $5.00.
That $2.50 is the trio's contribution margin, and it's the number that tells Wrenwood which products to push, which to fix and which to stop making. This guide shows how to work it out three ways (per unit, in total and as a ratio), how to use it for product decisions, and how it gives you a break-even point in one division.
What contribution margin is, and how it differs from gross margin
Contribution margin is what's left from a sale after paying every cost that comes with that sale. Whatever remains "contributes" to the costs you pay regardless, such as rent, salaries and software, and then to profit.
Contribution margin = sales − variable costs
A variable cost is any cost that rises when you sell one more unit and disappears if you don't: ingredients, packaging, payment processing fees, shipping you pay for, sales commissions, marketplace fees. A fixed cost stays the same within a normal range of sales: rent, salaried staff, insurance, subscriptions. The U.S. Small Business Administration's break-even calculator uses the same split, with rent, salaries, insurance and depreciation as its examples of fixed costs.
Gross margin draws a different line. It subtracts cost of goods sold, which usually includes production labour and usually leaves out shipping to customers and card fees. (Our guide on how to calculate gross margin covers what belongs in COGS.) For a shop that ships almost nothing and pays its makers by the hour, the two numbers are close. For an online seller with free shipping, they can tell opposite stories, as the trio shows.
| Gross margin | Contribution margin | |
|---|---|---|
| Subtracts | Cost of goods sold | All variable costs |
| Salaried production staff | Usually in | Out (fixed) |
| Shipping to customers, card fees, commissions | Usually out | In |
| Shown on your P&L | Yes | No; you build it |
| Best for | Overall pricing health, reporting | Product decisions, break-even |
The contribution margin formula three ways
Per unit
Contribution margin per unit = price − variable cost per unit
Start with one product and list every cost that follows a single sale. For Wrenwood's online orders:
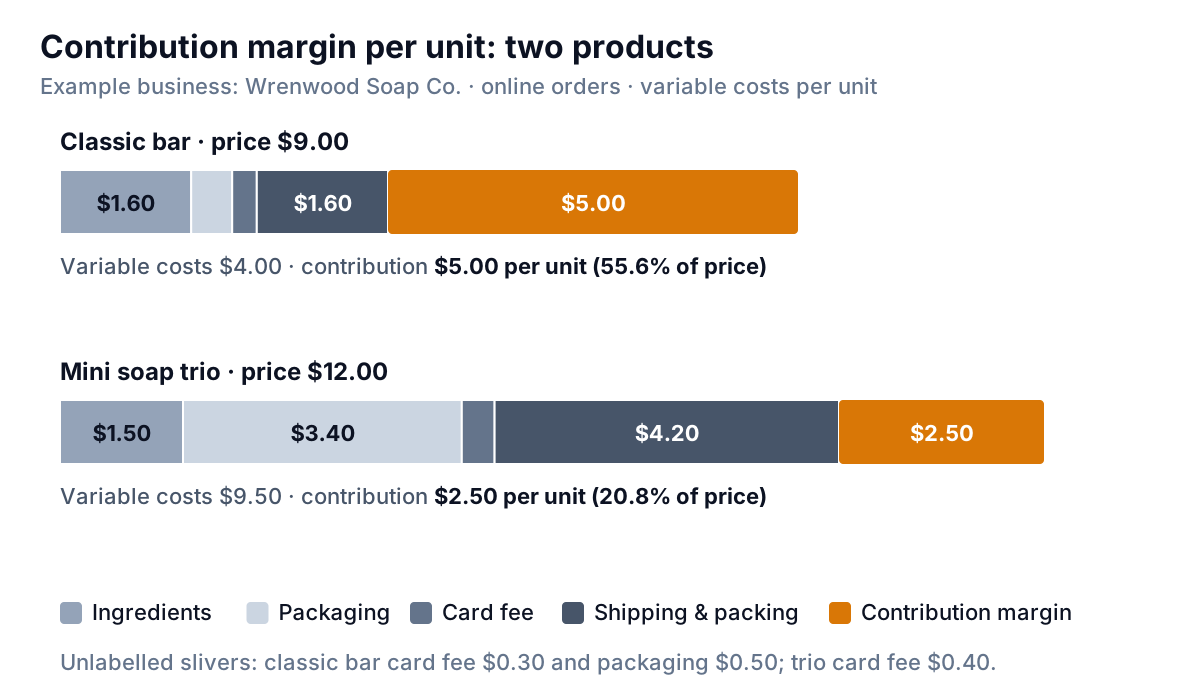
"Shipping and packing" is each product's share of the postage Wrenwood pays on free-shipping orders plus the mailer box, worked out from a month of orders. Spreading it per product takes some judgment: a bar usually travels with other items, while the trio is often bought alone as a gift and ships in its own box. A reasonable, consistent estimate beats leaving it out. If your card processor charges a percentage plus a fixed fee per transaction, spread the fixed part across the average number of items per order.
In total
Total contribution margin = contribution per unit × units sold, or total sales − total variable costs.
This is the one that pays the bills. A product with a modest margin per unit can still bring in more money than a high-margin product that rarely sells.
As a ratio
Contribution margin ratio = contribution margin ÷ sales
The ratio tells you how much of each extra sales dollar you keep. It's what you need for break-even, and it lets you compare products with very different prices. One naming trap: some sources, including the SBA calculator above, use "contribution margin" to mean the ratio rather than the dollar figure. Check which one a template or adviser means.
Contribution margin by product
Here's a full month at Wrenwood, with every product on the same basis.
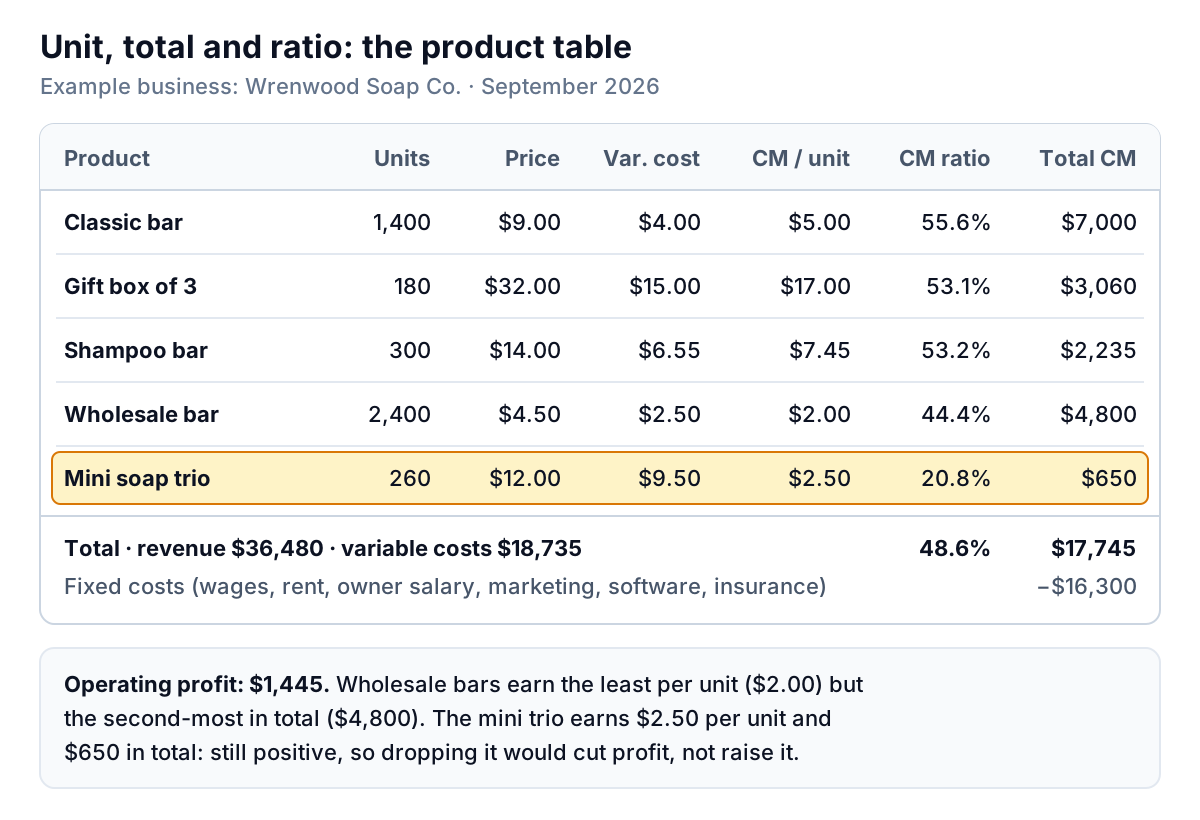
Read across the columns and each one tells you something different:
- Per unit, the gift box wins easily at $17.00. Every extra box sold adds $17 to profit.
- By ratio, the classic bar wins at 55.6%, and the trio is far behind at 20.8%.
- In total, the classic bar brings in $7,000, and the wholesale bar, despite earning only $2.00 a unit, is second at $4,800 because shops buy it by the case.
Add the five products and Wrenwood's contribution for September is $17,745 on $36,480 of sales, a 48.6% ratio. Fixed costs were $16,300: maker wages, workshop rent, the owner's salary, marketing, website and software, and insurance. Operating profit was $1,445. Thin, which is why the product decisions matter. (For how fixed costs show up in operating margin, see that guide.)
Building the table in a spreadsheet
- One row per product, with columns for price (B), variable cost per unit (C) and units sold (E).
- Contribution per unit in D:
=B2-C2. - Ratio in F:
=IFERROR(D2/B2,0). - Total contribution in G:
=D2*E2. - Below the table, total sales
=SUMPRODUCT(B2:B6,E2:E6), total contribution=SUM(G2:G6)and the blended ratio as total contribution ÷ total sales. Then subtract fixed costs to get operating profit.
Units and prices come from your sales or order export. Ingredient and packaging costs come from your recipe costing and supplier invoices. Shipping and fees come from your carrier and payment processor statements. Your accounting software won't label costs as variable or fixed, so go through your expense accounts once and tag each one. Ecommerce platforms' built-in profit reports use the item cost you enter; Shopify, for example, suggests entering the price you paid without shipping, so those reports show a gross figure, not contribution.
Which products to push, fix or drop
Contribution margin turns product decisions into simple rules. Use the last two or three months, not one.
| What you see | What it means | What to do |
|---|---|---|
| Negative contribution per unit | Every sale loses money before fixed costs | Reprice or redesign it now; stop selling it if you can't |
| Positive but low ratio (Wrenwood: under about 30%) | Covers its own costs, contributes little | Fix the price or the variable costs before promoting it |
| High contribution per unit | Each extra sale adds a lot | Push it: feature it, bundle it, put marketing behind it |
| Capacity is the limit | You can't make everything people want | Rank by contribution per unit of the scarce resource |
Applied to Wrenwood:
- Don't drop the trio yet. It still contributes $650 a month. Dropping it saves no fixed costs: the rent, wages and website stay. Profit would fall from $1,445 to $795. Dropping a product with a positive contribution only helps if it frees up something scarce, like curing racks or the maker's time before the holidays, for a product that earns more with it.
- Fix the trio instead. At $15, its card fee rises to $0.50 and contribution becomes $5.40 a unit (36%). Even if sales fell by a fifth, to 208 a month, it would contribute $1,123 instead of $650. Another option: offer it only as an add-on to orders that already ship, so it stops paying for its own box and postage.
- Push the gift box. At $17 a unit, 100 extra boxes in November add $1,700, more than September's entire profit. That's where the holiday marketing should go.
- Use the constraint rule for wholesale. Classic bars and wholesale bars use the same rack space, but an online bar contributes $5.00 and a wholesale bar $2.00. In a month when racks are full and online demand is there, each rack slot is worth more online. In a quiet month, wholesale keeps the racks full and adds $2 a bar that otherwise wouldn't exist. Both choices are right at different times.
From contribution margin to break-even
Break-even is the sales level where contribution exactly covers fixed costs. With the ratio, it takes one division:
Break-even sales = fixed costs ÷ contribution margin ratio
For Wrenwood: $16,300 ÷ 48.6% ≈ $33,510 of sales a month.
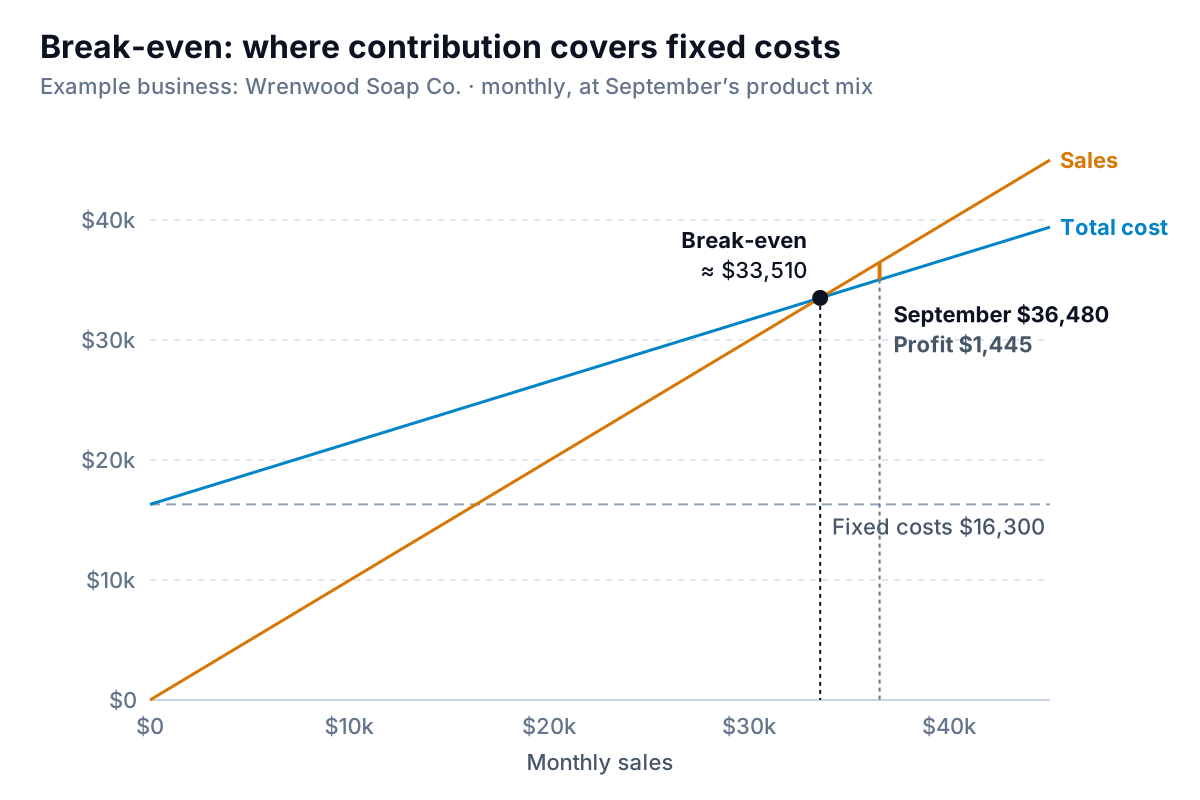
Three ways to use it:
- Margin of safety. September's sales were $2,970 above break-even, about 8%. A slow January that drops sales by 10% would mean a loss. That's the time to have cash set aside or fixed costs under control.
- In units. For a single product, divide fixed costs by contribution per unit. If Wrenwood sold only classic bars, it would need $16,300 ÷ $5.00 = 3,260 bars a month. That's the formula the SBA calculator uses.
- Testing a new fixed cost. A part-time packer at $1,800 a month raises break-even by $1,800 ÷ 48.6% ≈ $3,700 of sales. Ask whether the extra capacity will bring in at least that much.
Break-even depends on the product mix. If wholesale grows and gift boxes shrink, the blended ratio falls and break-even rises, even though nothing about any single product changed. Recalculate it whenever the mix shifts.
Mistakes that make the number misleading
- Treating salaried labour as variable. If the maker is paid the same whether she pours 40 batches or 30, her wages are fixed. Counting them per unit makes every product look worse and hides the true cost of an extra sale.
- Forgetting the variable costs that sit outside COGS. Card fees, marketplace fees, free shipping, commissions. These are exactly what separates contribution from gross margin.
- Dropping a product because of its allocated overhead. Spreading rent across products makes some look unprofitable, but the rent doesn't leave with the product.
- Using one month. A big wholesale order or a holiday spike skews a single month. Use a rolling three-month view.
- Ignoring the mix when quoting break-even. It's a figure for a given mix, not a fixed fact about the business.
Keeping the product table current
The table is only useful if the units and costs are current, which means pulling sales, fees and shipping costs together every month. For an online shop, that's the order export, the payout report and the shipping labels, at minimum.
Parity connects to Shopify, Stripe, Square and QuickBooks Online directly, or takes a CSV or Excel export from anything else, and builds a dashboard: headline numbers with their trends, charts, what explains them, and a table of what needs attention. You can ask it by chat to add contribution per unit by product using your cost assumptions, and every number is checked against queries on the full dataset before you see it. Update it with a newer file next month, or save it as a template. For the wider picture of an online store, our ecommerce dashboard guide shows where product margins fit alongside traffic and repeat customers.
Bring your orders, fees and costs together and get a checked dashboard of contribution by product. Build a report from your data free
A good monthly habit fits in one sentence: "Each extra sale of ___ adds $___, our break-even is $___, and this month we were ___% above it." If you can fill in those blanks, contribution margin is doing its job.