The till report at Pebble & Pine Gift Shop, an example business we'll follow through this guide, says September's gross margin was 49.2%. The accountant's profit and loss statement for the same month says 47.1%. Same shop, same sales, two numbers two points apart. On $24,000 of sales, that gap is $500 of profit that the till thinks exists and the bank account never sees.
Both numbers use the same formula. They differ in what goes into the cost line. This guide shows how to calculate gross margin step by step, for the whole business and for each product or category, in a spreadsheet you can build in twenty minutes. It spends most of its time on the part people get wrong: deciding what counts as cost of goods sold.
How to calculate gross margin, step by step
Gross margin is the share of each sales dollar left after paying for the goods you sold. The formula:
Gross margin % = (net sales − cost of goods sold) ÷ net sales × 100
The top half of that, net sales minus cost of goods sold, is gross profit, a dollar amount. Gross margin is gross profit expressed as a percentage of sales. Here's Pebble & Pine's September in four steps.
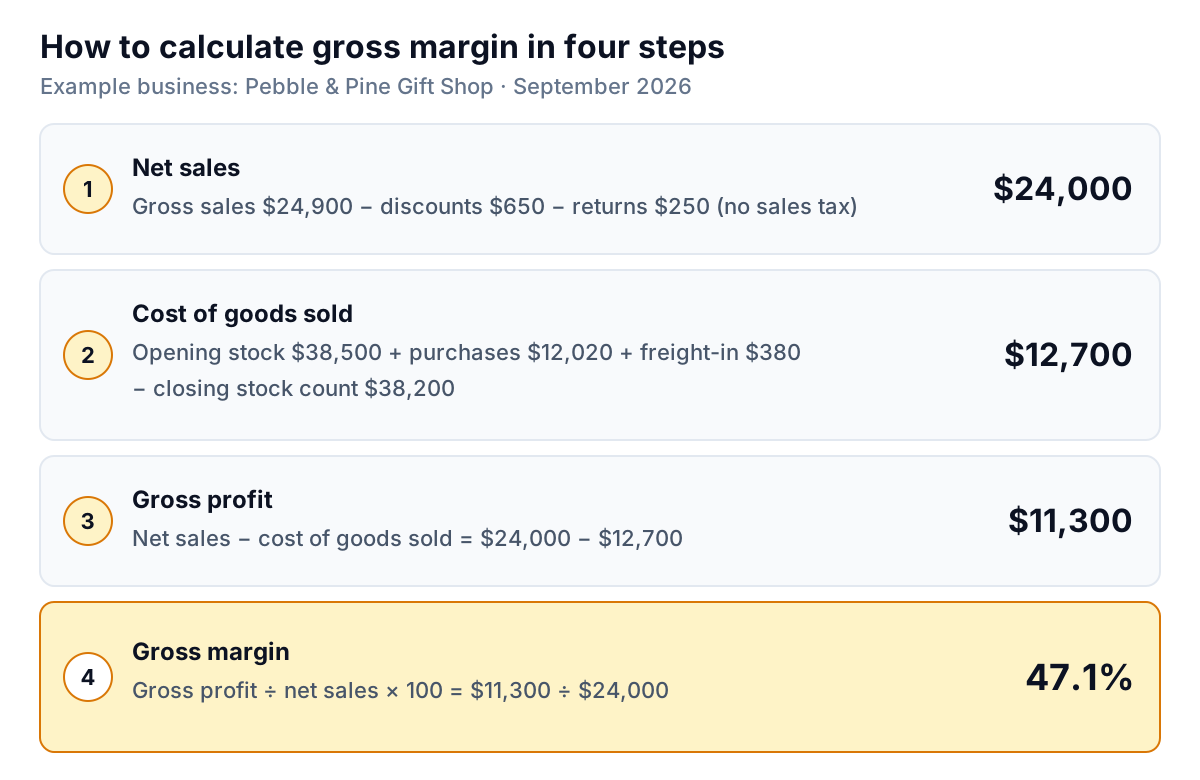
- Start from net sales, not gross sales. Take everything you rang up ($24,900), then subtract discounts ($650) and refunds or returns ($250). Leave sales tax out entirely: you collected it for the state, and it was never your revenue. Net sales: $24,000.
- Work out cost of goods sold for the same period. For a shop that counts its stock, the reliable way is: opening inventory + purchases + inbound freight − closing inventory. For Pebble & Pine that's $38,500 + $12,020 + $380 − $38,200 = $12,700.
- Subtract to get gross profit. $24,000 − $12,700 = $11,300.
- Divide by net sales. $11,300 ÷ $24,000 = 0.471, or 47.1%.
Read it as: of every dollar a customer spent in September, about 47 cents was left after paying for the goods. That 47 cents has to cover rent, wages, card fees, insurance, the website and the owner's pay. What's left after those is operating margin, which is the next number down the profit and loss statement and a separate question.
What goes in cost of goods sold, and what stays out
Cost of goods sold (COGS) is the cost of the specific things you sold in the period. Not the things you bought in the period, and not the cost of running the shop. The test for each cost: would it exist if you hadn't stocked that product? If the cost follows the goods, it's COGS. If it follows the calendar or the building, it's an operating expense.
| Usually in COGS | Usually an operating expense |
|---|---|
| What you paid suppliers for goods you sold, after supplier discounts | Rent, utilities and shop fit-out |
| Inbound shipping and freight to get stock to you ("freight-in") | Shipping orders out to customers (often treated as a selling cost) |
| Customs duties on imported stock | Shop staff wages, unless they make the product |
| Raw materials and direct labour, if you make what you sell | Card processing fees, marketing, software |
| Stock lost to theft, breakage or spoilage (shrinkage) | Shopping bags and tissue paper, in many shops |
The IRS lists the pieces for a sole proprietor's Schedule C in Publication 334: opening inventory, purchases, labour, materials and supplies, and other costs including containers, freight-in and overhead, minus closing inventory. The same publication describes a simpler option for small businesses under a gross receipts test. Tax treatment and management reporting don't always line up, so agree the categories with your accountant once, write them down, and use them every month. Consistency matters more than which side of the line bags and tissue paper land on.
The right-hand column is why gross margin can look healthy while a business struggles. A shop that ships most orders for free and pays 3% on every card sale can have a fine gross margin and very little left over. If those per-sale costs are large for you, look at contribution margin as well, which subtracts every cost that rises with each sale.
Gross margin per product and per category
The overall number tells you how the month went. The per-product numbers tell you what to do about it. The per-item calculation is the same formula on one sale:
Item gross margin = (selling price − unit cost) ÷ selling price
A Pebble & Pine candle: ($28.00 − $12.60) ÷ $28.00 = 55%. For a category, add up sales and costs across all its items first, then divide. Here's September by category, using the item costs held in the till system.
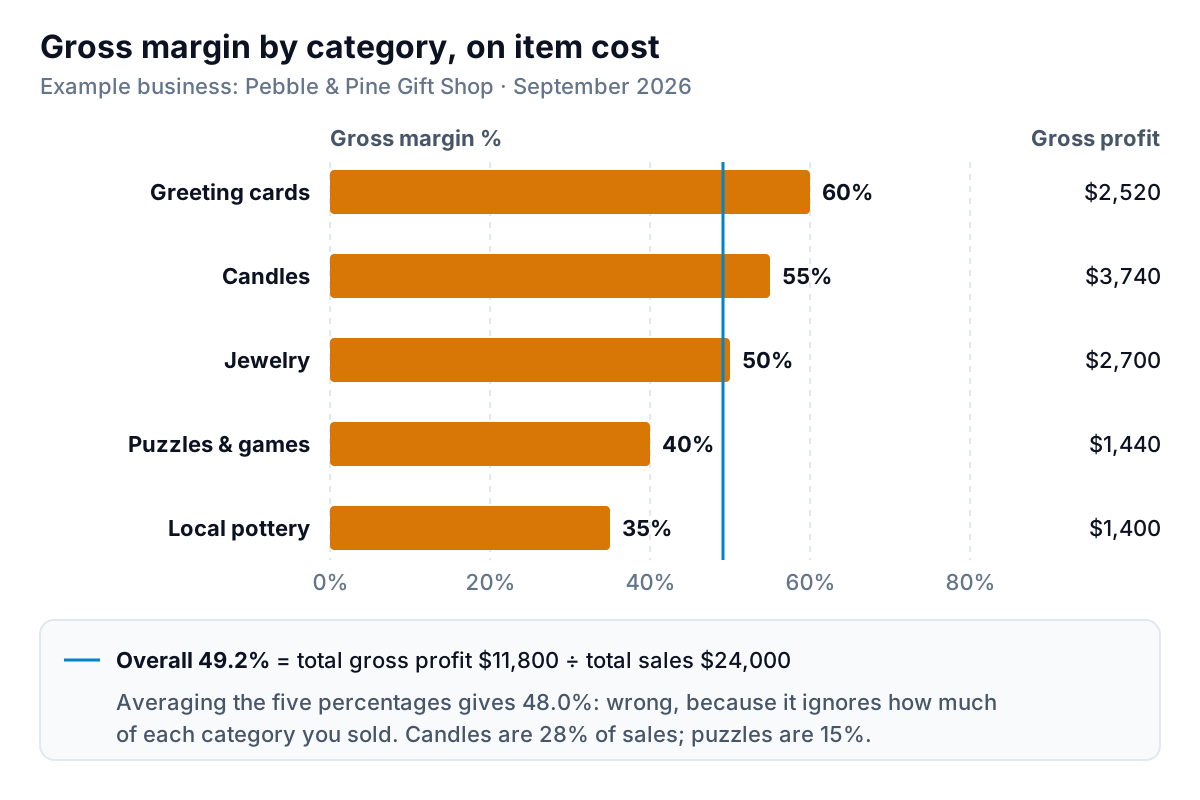
Three things to notice.
- The overall margin is a weighted figure. It's total gross profit over total sales: $11,800 ÷ $24,000 = 49.2%. The simple average of the five category percentages is 48.0%. The average is wrong because it treats $3,600 of puzzles the same as $6,800 of candles. Never average margins; add up dollars and divide once.
- High margin isn't the same as most profit. Cards have the best percentage, but candles earn the most dollars ($3,740) because they sell more. Decisions about shelf space and reordering should look at both.
- Mix moves the total. If next month pottery sells more and cards sell less, the overall margin falls even if no price or cost changed. That's a mix shift, not a problem with any product, and it's the first thing to check when the total moves.
Build it in a spreadsheet
Here is how to calculate gross margin in a spreadsheet so the per-product view and the books agree. You need two exports: sales by product or category for the month, and your cost of goods sold from the books. One sheet holds both.
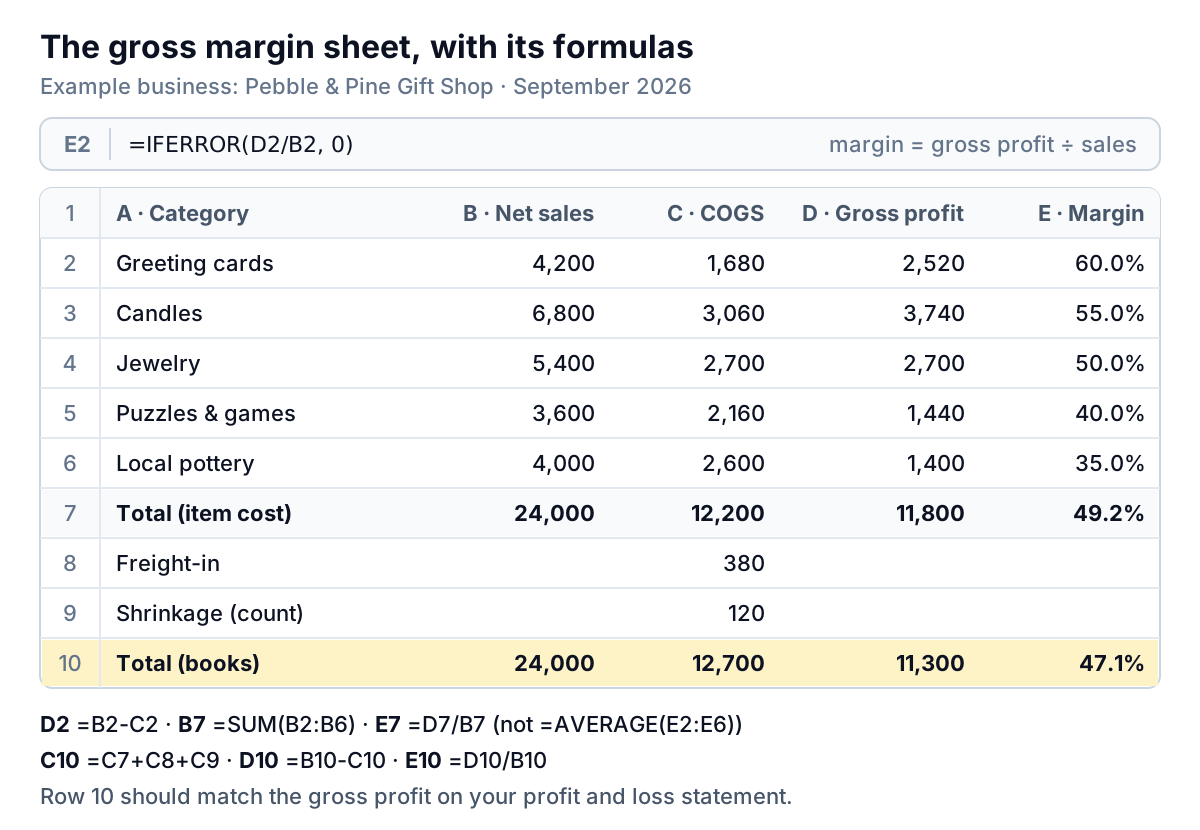
- Column A, category or product. Paste one row per category from your sales report.
- Column B, net sales. After discounts and returns, before sales tax.
- Column C, COGS. Units sold × unit cost, from the same report if your system holds costs.
- Column D, gross profit:
=B2-C2, filled down. - Column E, margin:
=IFERROR(D2/B2,0), formatted as a percentage. The IFERROR stops a category with no sales from showing #DIV/0!. - Total row:
=SUM(B2:B6)for sales, cost and gross profit, then=D7/B7for the margin. Not=AVERAGE(E2:E6). - Reconciliation rows: add the costs the till doesn't see (freight-in, shrinkage found at the stock count) until total COGS matches the books. Pebble & Pine's $12,200 of item costs plus $380 freight-in plus $120 of shrinkage gives the $12,700 on its P&L.
The last step is the one that explains the gap from the opening. Point-of-sale and ecommerce systems calculate margin from the cost you typed against each item. They usually can't see freight bills, stock that walked out the door, or a supplier price rise you never updated. Shopify, for example, says its profit reports only include products that had a cost recorded at the time they were sold, and it suggests entering the price you paid the manufacturer without shipping. Useful for comparing products, but it will run higher than your books. Our Shopify reports guide covers which report to export.
Getting the inputs from your accounting software
- QuickBooks Online: the Profit and Loss report puts your Cost of Goods Sold accounts between Income and Expenses and shows Gross Profit as its own line. Per-product cost tracking needs inventory turned on, which Intuit says is available on QuickBooks Online Plus and Advanced.
- Xero: costs coded to cost of sales (direct cost) accounts sit above the gross profit line on the profit and loss report, as Xero's own P&L example lays out. If gross profit looks too high, check whether freight and duties were coded to an ordinary expense account instead.
- A spreadsheet or shoebox: use the stock-count method from step 2. Count stock at cost on the last day of each month, or at least each quarter, and keep every supplier and freight invoice for the period.
Mistakes that make the number wrong
- Using purchases as COGS. Buying $12,020 of stock in a month is not the same as selling $12,020 of stock. Without the inventory adjustment, margin falls in months you restock and jumps in months you don't.
- Leaving sales tax in revenue. It inflates sales and, with them, the margin.
- Forgetting freight-in and duties. A $28 candle that cost $12.60 at the supplier but $1.40 more to ship in has a 50% margin, not 55%.
- Stale unit costs. Suppliers raise prices; item records don't update themselves. Check your top 20 items' costs against the latest invoices every quarter.
- Averaging percentages across products, stores or months. Add dollars, then divide.
- Comparing yourself to the wrong benchmark. Published averages are mostly from large public companies. NYU Stern's Aswath Damodaran puts the average gross margin of US-listed specialty retailers at 35.30% in his January 2026 data. That's a useful sense check that a gift shop at 47% isn't unusual, but chains buy at volume and a small independent sells a different mix. Your own trend is the better benchmark.
When gross margin moves: what to check, in order
A one-point move on $24,000 of monthly sales is $240 a month, nearly $3,000 a year. Worth a look, not a panic. Work through these in order, because the first ones are the most common:
- Did the mix change? Re-run the category table. If every category's margin held and the total still moved, it's mix. Decide whether the shift is seasonal (pottery before the holidays) or a trend.
- Were there more discounts or returns? A 20%-off weekend cuts margin on everything it touches. Compare discounts as a percentage of gross sales month to month.
- Did a supplier raise prices? Compare unit costs on this month's invoices with last quarter's. If a cost rose 8% and your price didn't, that category's margin fell by several points.
- Is shrinkage growing? Compare COGS from the stock count with item-cost COGS from the till. A gap that widens month after month is theft, breakage or receiving errors.
- Was it a counting or timing error? A missed box in the stock count, or a freight bill posted in the wrong month, can swing a single month by several points. If the next month swings back, that's what it was.
Then act on the category, not the total. At Pebble & Pine, local pottery at 35% is the obvious question. The owner might keep it anyway, because it brings people in and fits the shop, and that's a fair choice. But she should make it on purpose: perhaps raise prices on the pieces that sell fastest, ask the potters about a better wholesale price at higher volume, or give the shelf space by the till to cards, which earn 60 cents on the dollar.
Keeping it current without a monthly rebuild
The spreadsheet works. The trouble is the monthly routine: export sales, update costs, paste, check the formulas still point at the right rows, reconcile to the books. After a few months it's easy to stop.
Parity connects to QuickBooks Online, Shopify and Square directly, or takes a CSV or Excel export from any other till or accounting tool, and builds a dashboard: headline numbers with their trends, charts, what explains them, and a table of what needs attention. You can ask by chat for gross margin by category with the reconciliation to your books, and every number is checked against queries on the full dataset before you see it. Next month, update it with a newer file instead of starting again.
Connect your sales and accounting data, or upload an export, and get a checked dashboard of where your gross profit comes from. Build a report from your data free
Whichever tool you use, how to calculate gross margin comes down to the same habit: end each month with one number you trust, from the books, and one table that explains it, by category. If the two don't reconcile, find out why before you change a price.