Castleton Dental Lab, an example business used throughout this guide, had its best year yet in 2025. Revenue grew 12.7%, from $1.10 million to $1.24 million. Every crown and bridge earned the same gross margin as the year before: 45%. And the lab made less money: operating income fell from $166,000 to $160,000.
Nothing on the sales side explains that. The answer sits one section lower on the profit and loss statement, and the number that catches it is operating margin: the share of revenue left after paying for both the work itself and the cost of running the business. This guide covers the formula, what it shows that gross margin can't, the owner's-pay adjustment most small businesses need to make before they read it, and the fixes that move it most.
The operating margin formula
Operating margin % = operating income ÷ revenue × 100
Where operating income = revenue − cost of goods sold − operating expenses.
Operating income is the profit from running the business, before interest on loans, income tax and anything that isn't part of normal trading. Some people call it operating profit or EBIT (earnings before interest and taxes). For a small business with no investments or one-off gains those are usually the same figure, but EBIT can include non-operating income, so check what's in it before comparing.
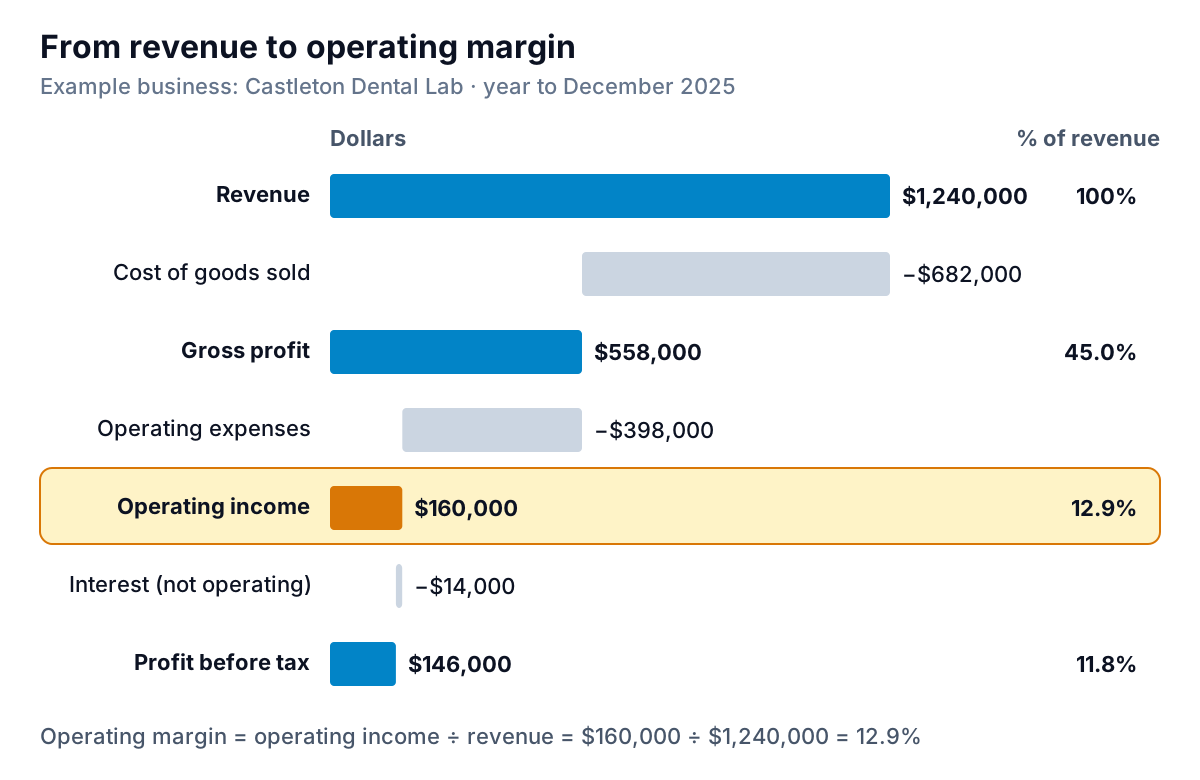
Castleton's 2025 in numbers:
- Revenue: $1,240,000 of cases billed to dental practices.
- Cost of goods sold: $682,000. Materials and outsourced milling ($248,000) plus technicians' wages and payroll taxes ($434,000). These rise and fall with the number of cases.
- Gross profit: $558,000, a 45.0% gross margin. (Our guide on how to calculate gross margin covers this line in detail.)
- Operating expenses: $398,000. Rent and utilities, office staff, courier runs to practices, software and scanner subscriptions, marketing, insurance, depreciation on the milling machine and furnaces, and other overheads.
- Operating income: $558,000 − $398,000 = $160,000.
- Operating margin: $160,000 ÷ $1,240,000 = 12.9%.
Below that line, $14,000 of interest on an equipment loan brings profit before tax to $146,000. That interest is real money, but it's a financing choice: the same lab paying cash for its mill would have the same operating margin and a higher net margin. Keeping the two apart lets you judge how well the lab runs separately from how it's funded.
Finding the inputs in your books
- QuickBooks Online: the Profit and Loss report already has a Net Operating Income line, after Gross Profit and Expenses and before the Other Income and Other Expenses section, as an Intuit team member explains on the QuickBooks community. It's only right if interest and one-off items were posted to "Other Expense" accounts. If loan interest sits in ordinary Expenses, subtract it out yourself.
- Xero: the standard profit and loss report goes from gross profit to operating expenses to net profit, as in Xero's example P&L. Find interest and any non-trading items in the expense list and add them back to get operating income.
- A spreadsheet: take revenue, subtract every expense, then add back interest, income tax and anything that won't recur (a one-time legal settlement, the gain on selling an old van).
What operating margin shows that gross margin can't
Gross margin answers "do we make money on the work?" Operating margin answers "do we make money as a business?" The gap between them is your overhead, and overhead has a habit of growing quietly.
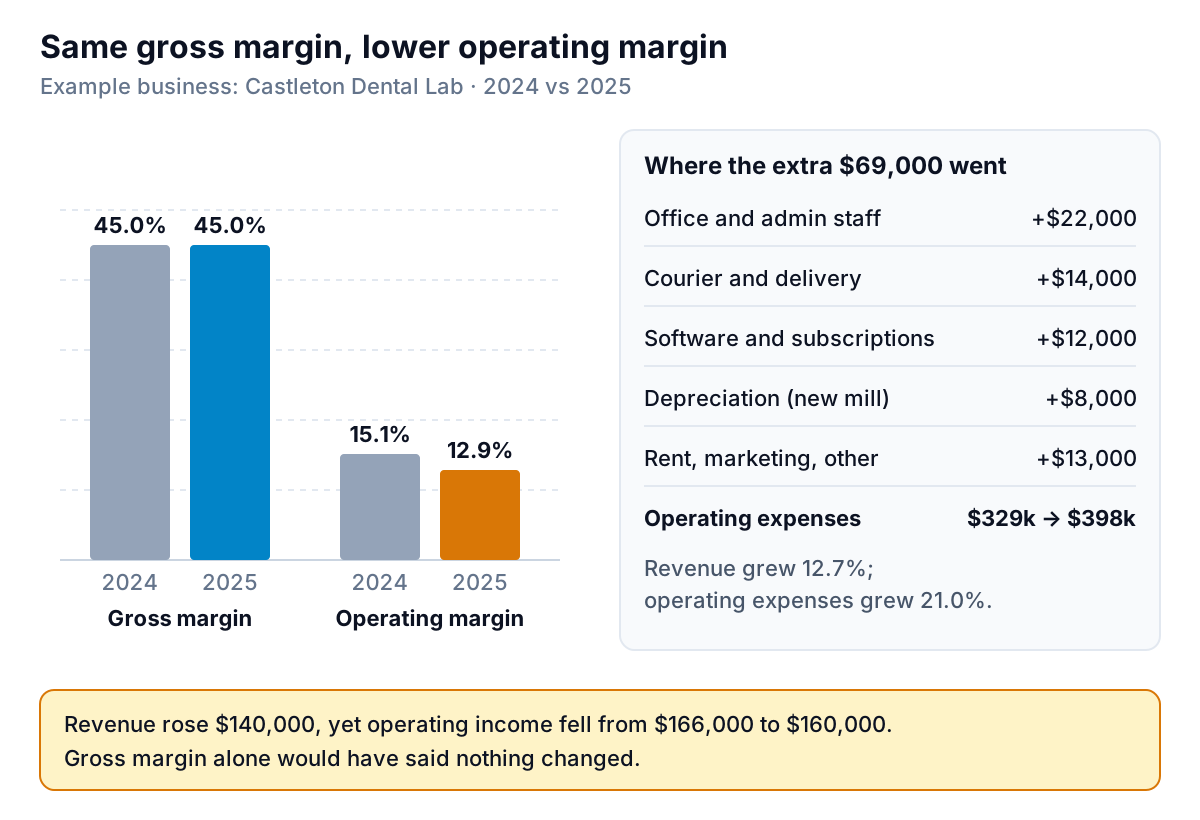
In 2024, Castleton's operating expenses were $329,000. In 2025 they were $398,000, up 21% while revenue rose 12.7%. Each increase had a reason. A second office person was hired to handle more cases. New practices further out meant more courier runs. A new intraoral scan platform added subscriptions. A new milling machine added depreciation. No single decision looked wrong. Together they ate the profit from $140,000 of extra sales.
This is the pattern operating margin exists to catch. When sales grow, some costs should stay flat (rent, insurance, the owner's time) and margin should rise. If operating margin falls while sales grow, overhead is growing faster than the business, and you want to know that in the first quarter it happens, not at tax time.
It works in reverse too. If Castleton's revenue fell 10% next year, gross profit would fall about $56,000, but most of the $398,000 of overhead would stay. Operating income would drop by roughly a third. A business with a thin operating margin and heavy fixed costs has little room for a slow year, which is why lenders look at this number.
Adjust for the owner's pay before you read it
Here's the small-business catch. In many sole proprietorships and partnerships, the owner takes money out as draws, which never appear as an expense on the P&L. So the operating margin includes the owner's pay. That makes small businesses look more profitable than they are, and it makes them impossible to compare with a business that pays a manager.
Say Castleton's owner runs the lab and takes draws, and hiring someone to do that job would cost about $90,000 a year in wages and payroll costs. The adjusted figure:
($160,000 − $90,000) ÷ $1,240,000 = 5.6% adjusted operating margin
12.9% looks comfortable. 5.6% is what the business earns after paying everyone who works in it, including the owner, at market rates. That's the number to use when you ask whether the business is worth what you put into it, whether you could step back, or what a buyer might pay. How owners are paid, and what's deductible, depends on your business structure, so check the treatment with your accountant. For management purposes, a reasonable estimate is enough.
What's a good operating margin?
It depends heavily on the industry, and reliable small-business figures by industry are hard to find. The widely used free dataset is NYU Stern professor Aswath Damodaran's, which puts the average pre-tax operating margin across US-listed companies at 12.82% in January 2026, with wide swings by sector. Those are large public companies with purchasing power and professional management, and they pay their executives salaries, so compare them with your owner-adjusted figure, not the raw one.
Three more useful comparisons than an industry average:
- Your own trend. Track operating margin on a rolling 12-month basis so seasonal months don't throw you. The direction matters more than the level.
- Your gross margin minus your overhead ratio. Operating expenses ÷ revenue is your overhead ratio (Castleton: 32.1%). Gross margin 45.0% − overhead 32.1% = operating margin 12.9%. When the margin moves, this tells you which side moved.
- Your plan. If you set a budget, compare actual overheads line by line. Our budget vs actual guide shows how to lay that out so the overspends stand out.
How to improve operating margin
There are only three levers: charge more, spend less on the work, or spend less on running the business. They're not equal. Here's what one change at a time would do to Castleton's 2025 figures.
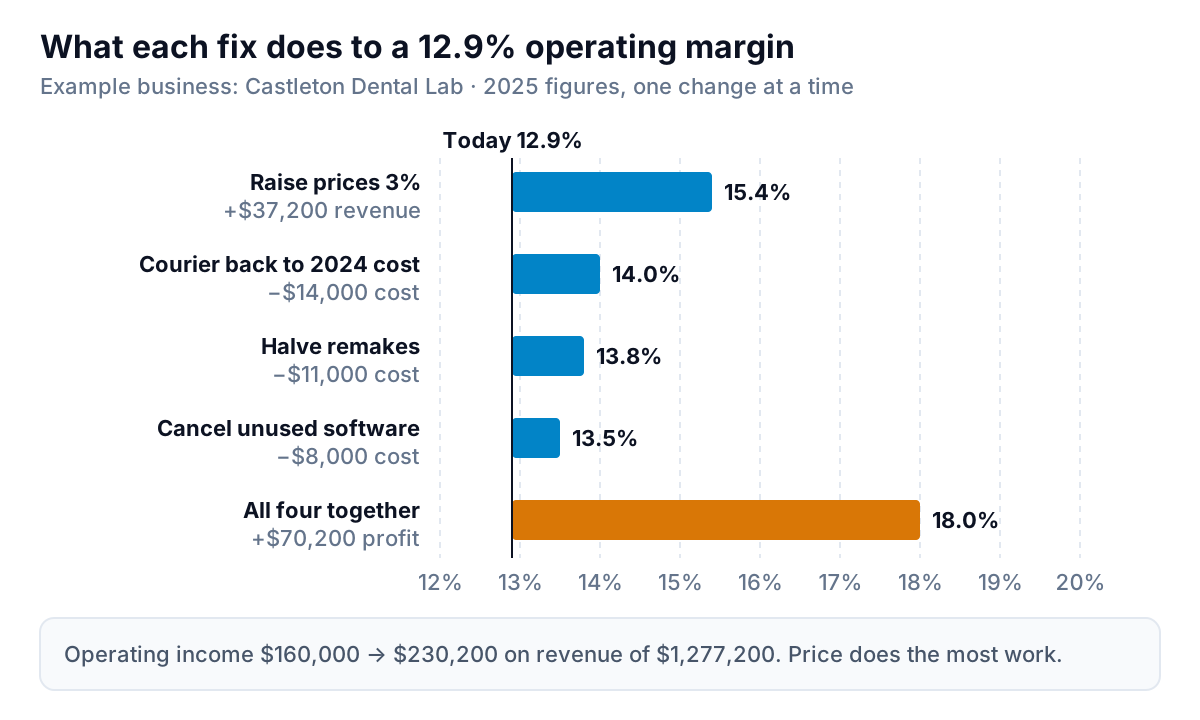
- Price. A 3% increase on $1,240,000 is $37,200, and almost all of it reaches operating income because the cost of the work doesn't change. Margin goes from 12.9% to 15.4%, assuming no practices leave over it. Price rises are uncomfortable, which is why they're often years overdue. If your prices are built from cost, check you're not confusing a markup with a margin when you set them; our margin vs markup guide shows how far off that can put you.
- Cost of the work. Remakes are a dental lab's hidden cost: the materials and technician hours get spent twice for one invoice. Halving them saves Castleton about $11,000 and lifts gross margin as well as operating margin. In other businesses, the equivalent is waste, rework, refunds and free extras.
- Overheads. Go line by line through the operating expenses that grew fastest. For Castleton, the courier routes (+$14,000) are first: consolidating drops into fixed daily runs might win most of it back. Software (+$12,000) is next: list every subscription and who used it last month.
Watch for cuts that move costs rather than remove them. Dropping the second office person saves $50,000 on paper, but if technicians then spend hours on phone calls and paperwork, the cost reappears in slower output. Before cutting a role, check what it actually does each week.
And check that each product or customer type earns its keep before you scale it. Practices far from the lab cost more to serve in courier time. Our guide to contribution margin shows how to work out what each customer or product leaves after the costs that come with it, which is the right test for "should we take on more of this work?"
Mistakes that distort the number
- Interest inside operating expenses. It makes a business with loans look worse-run than an identical one without.
- One-off items left in. A $20,000 legal bill or an insurance payout in one year will make that year look unusually bad or good. Note it and show the margin with and without.
- Cash-basis lumps. An annual insurance premium paid in January makes January's operating margin look terrible. Look at rolling 12 months, or ask your accountant about spreading prepaid costs.
- Owner's pay ignored, as above. Or the reverse: an owner taking a large salary plus a bonus that should be treated as profit share.
- Depreciation skipped. If equipment purchases go straight to the balance sheet and nobody books depreciation, operating income is overstated until the machine needs replacing.
Watching it every month
Operating margin is most useful as a trend: rolling 12 months, alongside gross margin and the overhead ratio, with the fastest-growing expense lines underneath. That's four numbers and one short table, and it would have shown Castleton's problem by the spring of 2025.
Parity can build that view for you. Connect QuickBooks Online, or upload a profit and loss export from Xero or any other tool as a CSV or Excel file, and it builds a dashboard: headline numbers with their trends, charts, what explains them, and a table of what needs attention. Every figure is checked against queries on the full dataset before you see it. Ask by chat to move interest below the line or add an owner's-pay adjustment, and if you need the monthly report for a business partner or lender, ask for that from the same data. Use aggregate financial figures only; Parity is not a HIPAA-covered tool, so patient data stays out.
Turn your profit and loss data into a checked dashboard of gross margin, operating margin and the expenses moving them. Build a report from your data free
If you check one thing each quarter, check this: did operating expenses grow faster than revenue? If they did, operating margin is falling, whatever the sales numbers say.