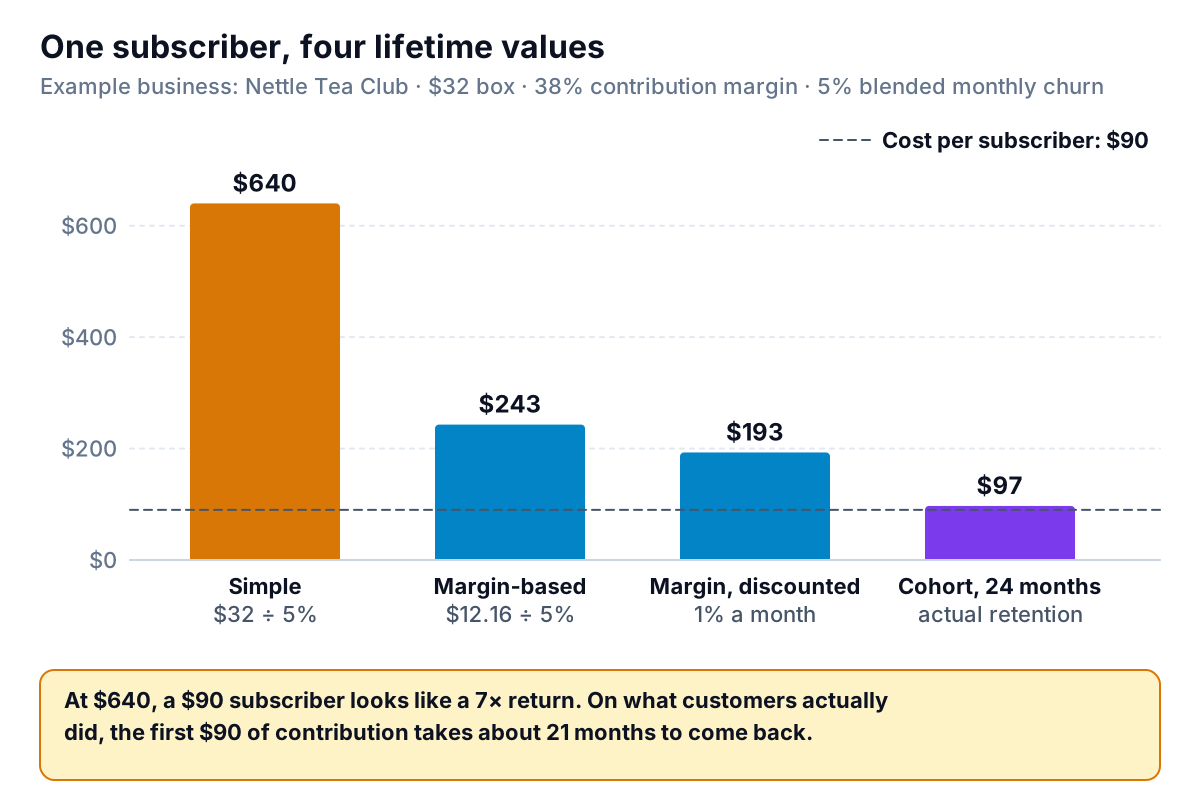
The owner of Nettle Tea Club, an example monthly tea subscription we'll use in this guide, had an email ready to send. An influencer agency would deliver about 100 new subscribers for $9,000, or $90 each. Her spreadsheet said each subscriber was worth $640, so it looked like an easy yes. Before sending it, she worked the customer lifetime value formula three more ways. The most realistic answer was $97 over two years, and it took 21 months to earn back the $90.
Customer lifetime value (CLV, or LTV) is what a customer is worth to you over the whole time they buy from you. The formula you choose decides whether that means revenue or profit, and whether "lifetime" is based on how customers actually behave or on an average that flatters them. This guide works through the simple formula, the margin-based version, and the cohort method using one business's numbers, shows exactly why the simple one overstates, and says which to use for which decision.
Three customer lifetime value formulas, one business
Nettle sends one box of loose-leaf tea a month for $32. Here are its inputs, from its subscription app and its books:
- Average revenue per subscriber: $32 a month.
- Cost to fill and ship a box: $19.84 (tea and botanicals $8.10, tin and packaging $2.30, postage $8.20, card fees $1.24). That leaves a contribution of $12.16 per box, or 38%.
- Monthly churn: 5%. In September, 92 of its 1,840 subscribers cancelled.
- First box: half price, $16, to win sign-ups.
Formula 1: the simple version
CLV = average revenue per customer per month ÷ monthly churn rate
$32 ÷ 5% = $640. This is the customer lifetime value formula in its simplest form. Dividing by churn is a shortcut for "multiply by the average lifetime": if 5% leave each month, the average customer stays 1 ÷ 0.05 = 20 months, and 20 × $32 = $640. Retailers without subscriptions often write the same idea as average order value × orders per year × years as a customer.
This is also the formula behind the LTV figure in Stripe's billing dashboard. Stripe's billing analytics documentation defines subscriber lifetime value as average revenue per user divided by the subscriber churn rate, and describes it as an estimate. It's useful for tracking a trend. It isn't a figure to set a marketing budget with.
Formula 2: margin-based
CLV = (revenue per month × contribution margin %) ÷ monthly churn rate
$12.16 ÷ 5% = $243.20. Same lifetime, but counting what each box leaves you after the cost of the box, which is what pays for acquiring the customer in the first place. Andreessen Horowitz's guide to startup metrics makes the case against revenue-based LTV: it suggests a higher ceiling on acquisition spend than the business can actually afford. Our guide to contribution margin covers which costs belong in the deduction; for a subscription box, it's everything that scales with each box shipped.
A more careful version also discounts future months, because $12 in two years is worth less than $12 now. The Marketing Accountability Standards Board's Universal Marketing Dictionary gives the standard form for constant margins and retention:
CLV = margin × retention rate ÷ (1 + discount rate − retention rate)
With retention of 95% a month and a discount rate of 1% a month: $12.16 × 0.95 ÷ (1.01 − 0.95) = $192.53. That formula assumes the first margin arrives at the end of the first period, and only from customers who stay, so it's slightly more cautious than formula 2 even before the discount does its work.
Formula 3: cohort-based
Instead of assuming a churn rate, follow a real group of new subscribers and add up what they actually earned you, month by month:
CLV over N months = Σ (contribution per active subscriber in month m × share of the group still active in month m)
Nettle's cohorts from the past year kept 70% of new subscribers after the first month, 51% after three, 42% after six and 34.5% after eleven. Applying $12.16 a box to those shares, less the $3.84 lost on the half-price first box, and projecting months 12 to 23 at the 3.5% monthly churn its long-standing subscribers show, gives $56.68 over 12 months and $96.91 over 24.
Building the retention table is covered step by step in our cohort analysis guide. For LTV you need one extra column: the contribution earned in each cell.
Why the simple formula overstates
From $640 to $97 is a factor of more than six. Four separate things account for it, and each is worth understanding because they apply to almost any business.
- Revenue isn't what you keep. Using $32 instead of $12.16 inflates the answer 2.6 times on its own. For a business with thin margins, a revenue-based CLV can exceed what a customer will ever contribute by a wide margin.
- The blended churn rate describes your existing base, not a new customer. This is the one people miss. Nettle's 5% comes from 1,840 subscribers, most of whom have been around for a year or more and rarely cancel. New subscribers behave completely differently: 30% leave after the first box.
- Introductory offers are left out. The half-price first box loses $3.84 on every new subscriber, and many of them only ever get that box.
- "Lifetime" has no end. Formulas 1 and 2 assume a customer could keep paying forever, and count the long tail at full value. A 24-month horizon is a deliberate cap: you're judging what you'll actually see within a timescale you can plan around.
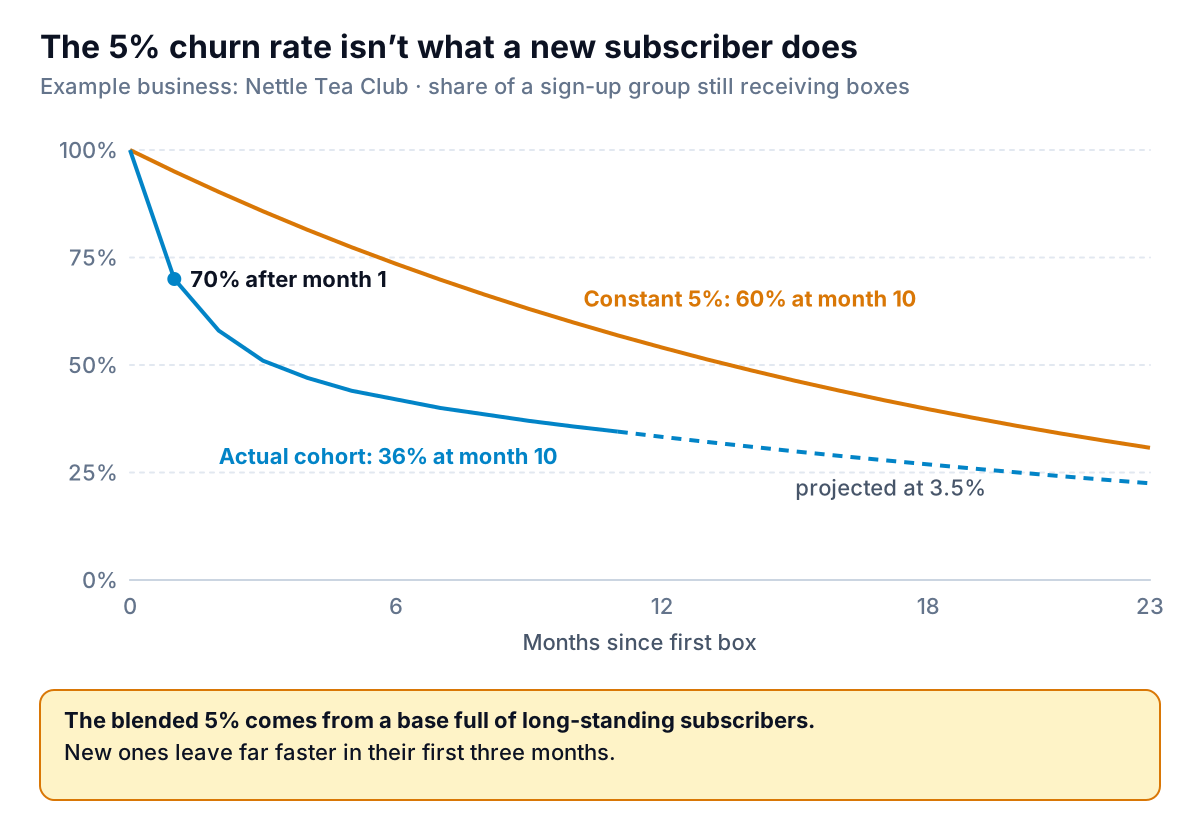
Point 2 runs against intuition, so look at the curves. If 5% left every month, a new group would still be 60% intact after ten months. Nettle's real groups are at 36%. The blended rate is correct for its job, which is describing the whole base; it just isn't the right rate for someone who signed up yesterday. Even on revenue alone, the cohort method gives $281 over 24 months, less than half of $640.
Which lifetime value to use for which decision
None of these numbers is wrong. Each customer lifetime value formula answers a different question.
| Decision | Use | Nettle's number |
|---|---|---|
| How much can I pay to win a new customer? | Cohort contribution over 12 or 24 months | $57 (12 months), $97 (24 months) |
| Which channel brings better customers? | Cohort contribution, one cohort per channel | Build per channel |
| What is my existing customer base worth? | Margin-based, discounted, using the base's churn rate | $193 per current subscriber |
| Is retention improving over time? | Any version, as long as it's the same one every month | Trend of $640, $243 or $97 |
For the first question, many businesses think in payback months rather than a lifetime total: how long until a new customer's contribution covers what you paid to get them?
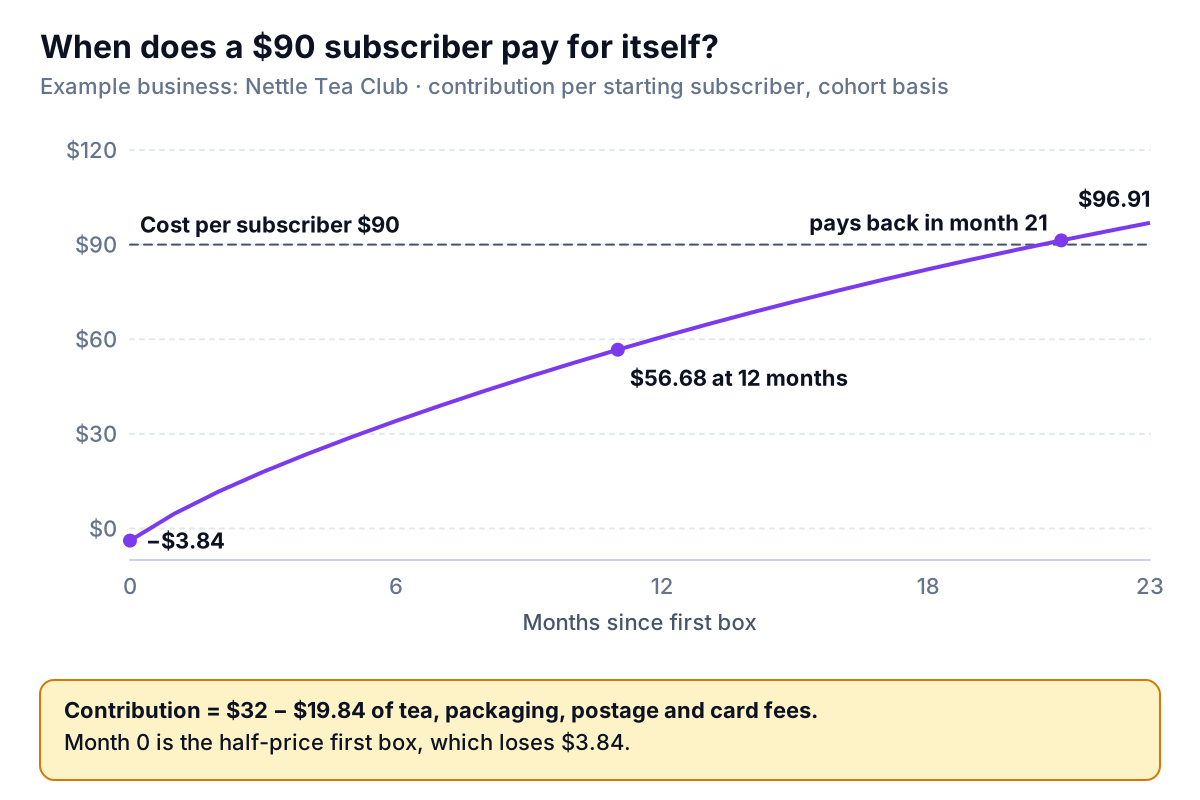
At $90 a subscriber, Nettle doesn't get its money back for 21 months, and the contribution line doesn't cover rent, salaries or any other fixed cost. a16z's guide notes that the conservative way to measure LTV for a young business is value to date, and that it prefers 12- and 24-month LTV. A simple rule for a small subscription business: pay no more than your 12-month cohort contribution to acquire a customer, unless you have the cash to wait longer. For Nettle, that cap is about $57. The rule is a choice about risk, not a standard; a business with more cash can stretch it to 18 or 24 months.
Getting the inputs from your own data
You need three things, and none of them requires special software.
- Revenue per customer per month. From your subscription app, Shopify or Stripe: total subscription revenue for the month ÷ active subscribers. If you sell one-off orders rather than subscriptions, use an order export and calculate revenue per customer per month for each cohort instead. Our Stripe reports guide explains which Stripe figures include what.
- Cost per order or per box. From your profit and loss report: cost of goods, packaging, postage and payment fees for the month ÷ boxes shipped. In QuickBooks Online or Xero, that means the cost of sales lines on the P&L. Check that shipping charged to customers and shipping you pay are both counted, or your margin will be off.
- Retention by cohort. An order export with customer ID and order date, turned into a cohort table. Count a customer as active in a month if they received (and paid for) a box.
In a spreadsheet, with cohort retention shares in row 5 (month 0 in B5, month 1 in C5 and so on) and contribution per box in B2, the 12-month cohort LTV is =B2*SUM(C5:M5)+B3, where B3 holds the first-box result (−3.84 for Nettle). Extend the range for 24 months, projecting the later months from your long-standing customers' churn rate until you have enough history.
Two checks before you trust the result. First, use cohorts at least a few months old; a cohort from last month can't tell you anything about month six. Second, look at whether newer cohorts retain better or worse than older ones. If the latest cohorts are weaker, an LTV based on last year's groups will overstate next year's customers.
What Nettle did
The owner didn't send the email. She went back to the agency with a $2,700 test for about 30 subscribers, using a 25%-off first box instead of 50%, and a plan to judge it on how many of those subscribers were still active at month three compared with her usual cohorts. If that group retains like the others, the improved first-box margin alone brings payback forward by a little; if it retains worse, the test cost $2,700 instead of $9,000.
That's the useful habit, more than any single formula: decide in advance which customer lifetime value formula you'll use for the decision, and write down the horizon and the costs it includes.
Parity can keep these numbers current. Connect Shopify or Stripe directly, or upload an order export as CSV or Excel, and describe what you need: "monthly cohorts by first paid box, with contribution at $12.16 a box and 12- and 24-month LTV per cohort". It builds a dashboard with the headline numbers and trends, the cohort table and charts, what explains the changes, and a table of what needs attention, such as a cohort that's dropping faster than the others. Every number is checked against queries on the full dataset before you see it, and you can update it with next month's export.
Upload your order export and get a checked cohort dashboard with contribution-based lifetime value and payback by month. Build a report from your data free
The $640 figure wasn't a mistake in arithmetic. It answered a different question from the one the owner was asking. "What's a customer worth?" has four honest answers, and the one that matters for spending money is usually the smallest.