Plinth Labs' October investor update said net dollar retention was 120%. Plinth, an example software company we'll follow in this guide, sells lab inventory software to small research labs, and 120% would have put it among the best in its class. An investor asked for the working. The numerator was every dollar of September 2026 MRR, including $7,900 from 21 customers who had signed during the year. Recalculated on the right basis, net dollar retention was 103%.
Net dollar retention (NDR), also called net revenue retention, measures how much recurring revenue you still get from a fixed group of customers a year later, counting their upgrades as well as their cancellations and downgrades. New customers never enter it. That one rule is where most NDR figures go wrong, and it's why the number needs a partner: gross revenue retention, which ignores upgrades and shows only what you lost.
This guide shows how to calculate both, why the starting group of customers matters so much, what good looks like according to the one large survey that publishes it, and what to do when the number slips.
The net dollar retention formula
Pick a start date and take every customer paying you on that date. Note their combined monthly recurring revenue. Twelve months later, add up what those same customers pay. Divide the second number by the first.
NDR = (starting MRR − churn − contraction + expansion) ÷ starting MRR
At Plinth, the 64 customers active on September 30, 2025 were paying $46,000 a month. A year later:
- 9 of them had cancelled, taking $4,140 of MRR with them (churn).
- Some had moved to cheaper plans or dropped seats: $1,380 less (contraction).
- Others had added seats or moved to bigger plans: $4,800 more (expansion).
- A 5% price increase in March added another $2,100 (also expansion).
So the original 64 paid $46,000 − $4,140 − $1,380 + $4,800 + $2,100 = $47,380 in September 2026. NDR = $47,380 ÷ $46,000 = 103.0%.
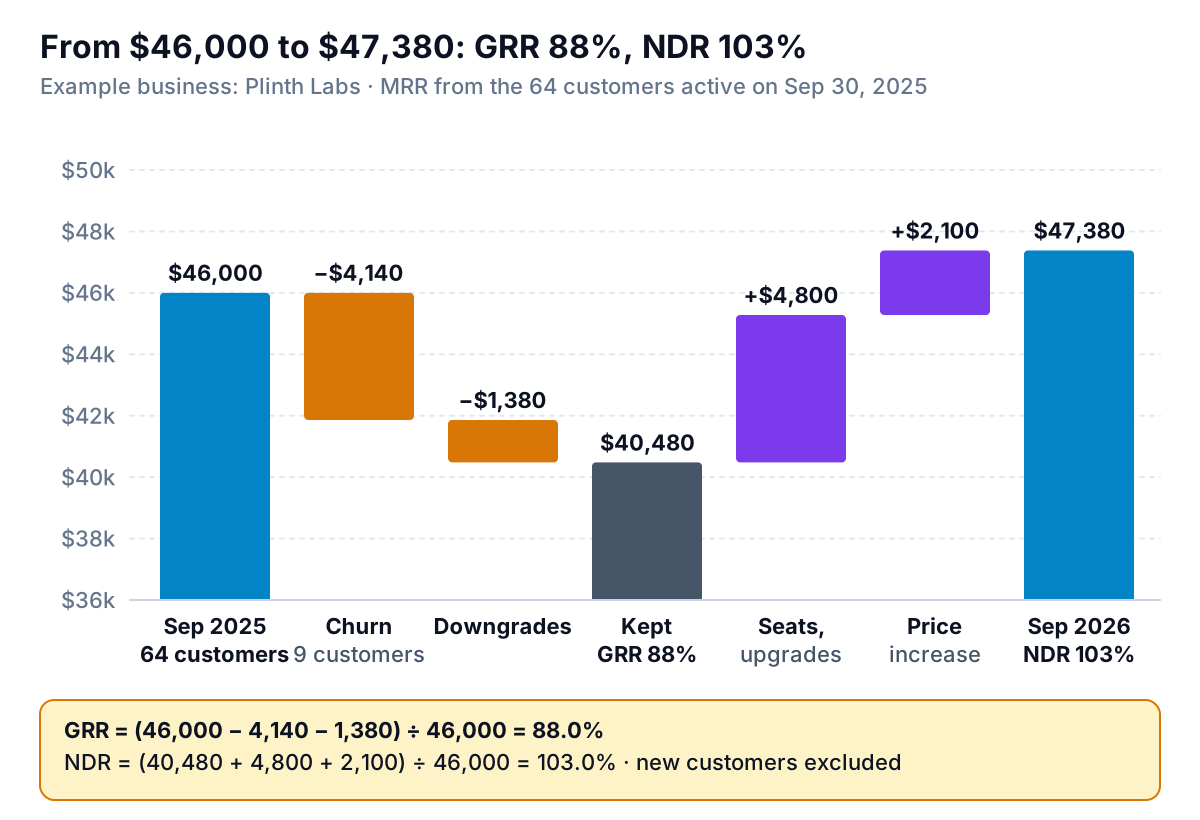
Gross revenue retention (GRR) uses the same starting group and leaves out all expansion:
GRR = (starting MRR − churn − contraction) ÷ starting MRR
Plinth's GRR = ($46,000 − $4,140 − $1,380) ÷ $46,000 = $40,480 ÷ $46,000 = 88.0%. GRR can never be above 100%, because nothing is added back. SaaS Capital's formula notes make the same point and suggest a shortcut: cap each customer's later MRR at their starting MRR before you add it up.
NDR vs GRR: why you report both
The two numbers answer different questions. GRR asks: how much of what we had did we keep? NDR asks: are our existing customers, as a group, paying us more than a year ago?
NDR on its own can hide a leak. Plinth's 103% sounds healthy. Underneath it, 12% of starting revenue walked out of the door, and upgrades from the customers who stayed more than made up for it. That's fine while those customers keep growing. If lab budgets tighten and upgrades stop, Plinth is left with 88% and nothing to cover it.
Price increases flatter NDR in the same way. SaaS Capital's definition includes them, and most companies do the same. But a price increase happens once, while churn happens every year. Without the March increase, Plinth's NDR would have been ($47,380 − $2,100) ÷ $46,000 = 98.4%: slightly shrinking. Report the price effect on its own line the year you raise prices, so next year's NDR doesn't look like a fall when it's simply a year without one.
A useful way to read the pair:
| GRR | NDR | What it usually means | Where to look first |
|---|---|---|---|
| High | High | Customers stay and grow | Keep doing it; check it holds across segments |
| Low | High | A leaky bucket refilled by upgrades or price rises | Why customers leave; how much NDR is price |
| High | Low (near GRR) | Customers stay but never grow | Packaging: is there anything to upgrade to? |
| Low | Low | Customers leave and the rest shrink | Product fit and onboarding, before anything else |
Fix the starting group before you calculate anything
Every common NDR error comes from letting the wrong customers or the wrong period into the sum.
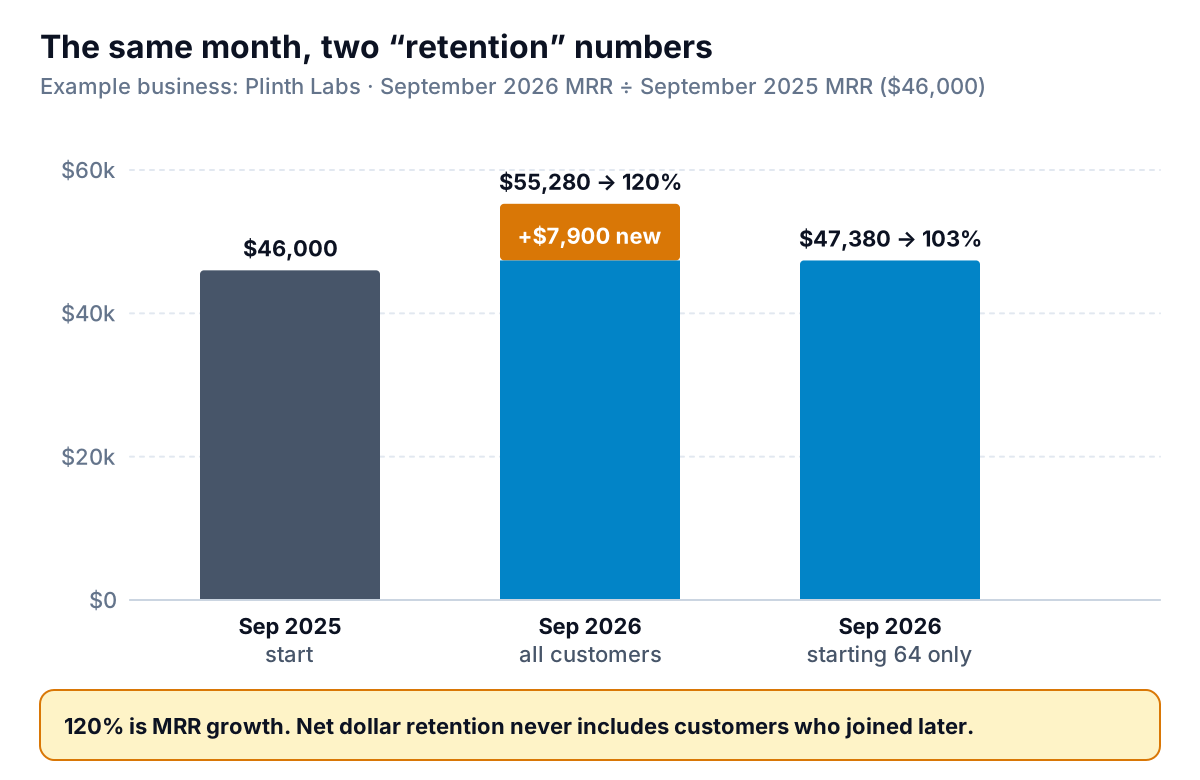
- New customers in the numerator. Plinth's 120% was total MRR growth: $55,280 ÷ $46,000. The 21 new customers belong in next year's starting group, not this year's result.
- Returning customers. A customer who left in 2024 and came back in 2026 wasn't in the starting group, so their revenue doesn't count. One who was in the group, left in March and came back in August counts at whatever they pay in September.
- Merged or split accounts. If a lab group moved two labs onto one account, it can look like one churn and one big upgrade. Match on the paying organisation, not the subscription ID.
- Monthly numbers multiplied up. A monthly net retention of 100.5% isn't an annual 106%. Customer behaviour isn't evenly spread through the year, and compounding a single month's rate exaggerates whatever happened that month. Measure over twelve real months.
- Averaging monthly cohorts. If you calculate NDR for each monthly start group and average the results, a cohort of 3 customers weighs the same as one of 30. Weight by starting MRR, or simply use one group: everyone active on the start date.
- Annual contracts counted by invoice. A customer billed $12,000 once a year is $1,000 of MRR every month, not $12,000 in one month and nothing in the others. Use MRR, not invoices. Our guide to monthly recurring revenue covers which items belong in it.
There's no single legal or accounting definition of NDR. For public companies, the SEC's 2020 guidance on key performance indicators expects a metric like this to come with a clear definition, how it's calculated and why it's useful, and an explanation if the method changes. That's a good habit for anyone sending NDR to an investor or lender: one sentence on the start date, who's in the group, and whether price increases are included.
What good net dollar retention looks like
The most useful published benchmark comes from SaaS Capital, a lender to software companies. Its 2025 retention benchmarks are based on a survey run in the first quarter of 2025, with more than 1,000 private B2B SaaS companies responding. Its findings (full report, PDF):
- Across all companies, median net retention was 101% and median gross retention 91%.
- Retention rises with contract size. Companies with annual contract values under $12,000 had a median NRR of 98% and GRR of 90%. Those above $250,000 had 106% and 95%.
- Bootstrapped companies reported 104% NRR and 92% GRR; equity-backed companies 101% and 90%.
- Month-to-month contracts came in at 100% NRR and 89% GRR.
- SaaS Capital calls GRR a "table stakes" benchmark and says it needs to be at least 90% to keep pace with peers.
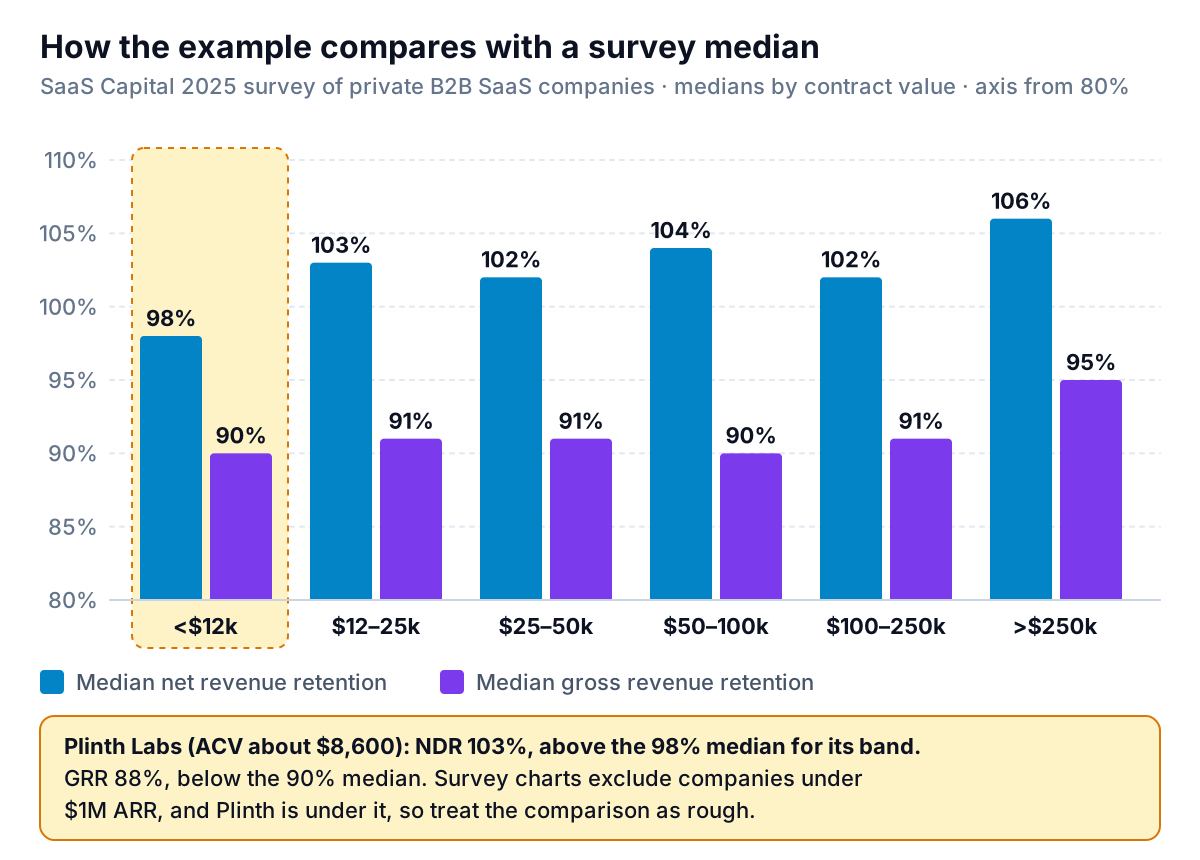
Plinth's average customer pays about $8,600 a year ($46,000 × 12 ÷ 64), which puts it in the smallest band. Its 103% NDR beats that band's 98% median. Its 88% GRR is below the 90% median and below SaaS Capital's 90% line.
Three cautions before you compare yourself. SaaS Capital's charts by contract value exclude companies with under $1 million of ARR, and Plinth, at $552,000, is under it. The survey covers B2B software, so an agency on retainers or a consumer subscription box has no business measuring itself against it. And it's a median, not a target: half the companies in each band did better. Use it to judge whether your number is in a normal range, not to decide whether your business is good.
For Plinth, the comparison says the same thing as the bridge chart: expansion is strong, and retention of the base needs work.
Calculating NDR from Stripe or a spreadsheet
If you bill through Stripe, the Billing overview includes retention by cohort. Stripe's billing analytics documentation says it groups subscribers by the month they first started paying, and that revenue retention includes expansion, so it can go above 100%. It inherits Stripe's MRR rules, which our Stripe reports guide explains. That's a month-by-month view of each sign-up cohort, which is excellent for spotting a weak cohort. For a single annual NDR across all customers, build it from an export:
- From the Billing overview's Report downloads, take "MRR per subscriber per month". It lists each subscriber's MRR at each month end.
- Keep two columns: MRR at the start date (column B) and MRR twelve months later (column C). Delete rows where B is zero; those customers weren't in the starting group.
- NDR:
=SUM(C:C)/SUM(B:B). - For GRR, add column D with
=MIN(B2,C2)and fill down. GRR:=SUM(D:D)/SUM(B:B). - To separate a price increase, add column E with each customer's MRR at the new price minus the old price for the same plan, and subtract its total from column C.
If your subscriptions live in an accounting tool rather than Stripe, export invoices by customer and month from QuickBooks Online or Xero, convert each to MRR (annual invoices ÷ 12), and use the same columns. A cohort analysis built with revenue instead of customer counts shows the same thing year by year, and helps you see whether newer groups retain better than older ones.
When net dollar retention falls: where to look
Break the change into its four parts and compare each with last year, as a share of starting MRR. At Plinth: churn 9.0%, contraction 3.0%, expansion from seats and upgrades 10.4%, price 4.6%.
- Churn up: list the customers who left and how long they'd been with you. Most churn in the first year points to onboarding or fit. Churn among long-standing customers points to something that changed: price, a competitor, a key contact leaving.
- Contraction up: find which plan they moved down from and ask what they stopped using. Downgrades are often a warning a few months ahead of cancellation.
- Expansion down: check whether customers are reaching the limits that trigger an upgrade. If most never get near them, NDR will drift toward GRR no matter how happy they are.
- Price share up: if more than half your expansion came from a price increase, plan for next year's NDR to drop by roughly that amount.
Then split NDR by segment: plan, customer size, the year customers joined, or how they found you. A blended 103% can be 115% for larger labs and 92% for single-researcher accounts, and those need opposite responses.
Tracking it every quarter
Annual NDR is the headline, but a rolling version (each quarter, looking back twelve months) shows the turn earlier. Put NDR and GRR on the same chart with the four parts underneath, and keep the definition sentence beside it.
Parity can build that from your billing data. Connect Stripe directly, or upload an MRR or invoice export from any other tool as CSV or Excel, and it builds a dashboard with the headline numbers and their trends, charts, what explains them and a table of what needs attention, such as the customers who downgraded this quarter. Every number is checked against queries on the full dataset before you see it. You can ask by chat for "NDR and GRR for customers active on September 30, 2025, with the price increase on its own line", and ask it to write the investor update from the same data.
Connect Stripe and get a checked dashboard of net and gross retention, with churn, downgrades and upgrades behind them. Build a report from your data free
Plinth's November update said: "NDR 103% (98% before the March price increase), GRR 88%, measured on the 64 customers active on September 30, 2025." It's a less exciting sentence than "120%", and the investor read it as a much better one. Every number in it could be checked.