In July, the founder of Tessera Analytics, an example data firm we'll follow in this guide, told a prospective lender the business was "at a $1.4 million run rate". June had been a record month: $117,000. Multiply by twelve and you get $1,404,000. The lender asked for the last twelve months of revenue from the books. It was $1,060,000.
Nobody lied. A run rate is just one period's results scaled up to a year, and June was real. But the number depended entirely on which month was picked. This guide shows how to calculate a revenue run rate, the situations where it misleads, how it differs from ARR and trailing twelve months, and which figure to use for which question.
The run rate formula
A revenue run rate annualises a short period of results:
- From a month: run rate = monthly revenue × 12
- From a quarter: run rate = quarterly revenue × 4
- From any number of days: run rate = revenue for the period ÷ days in the period × 365
The same arithmetic works for costs. An expense run rate (this month's costs × 12) is a quick way to see what next year's overheads look like if nothing changes, which is often how a new hire or a price increase from a supplier first shows up.
The appeal is obvious. It's current, it's simple and it gives an annual figure months before the year is over. The weakness is just as obvious once you say it out loud: it assumes the period you picked is typical, and that the next eleven months will look exactly like it.
One business, eight run rates
Tessera has two kinds of revenue. Subscriptions to its reporting platform grew steadily from $60,000 to $71,000 a month over the year. Projects (setup work and custom analysis) are one-off and lumpy: $48,000 in June, $6,000 in August.
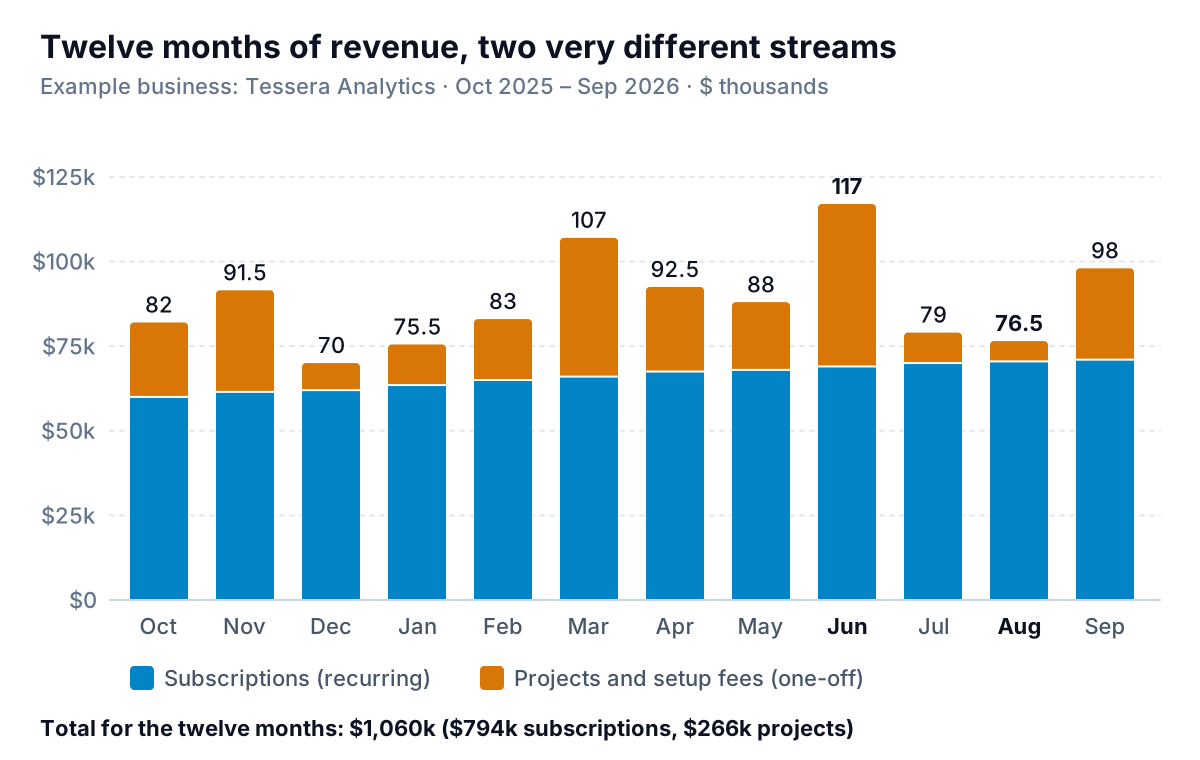
Now calculate a run rate on 30 September 2026 using different periods, and see how far apart the answers land.
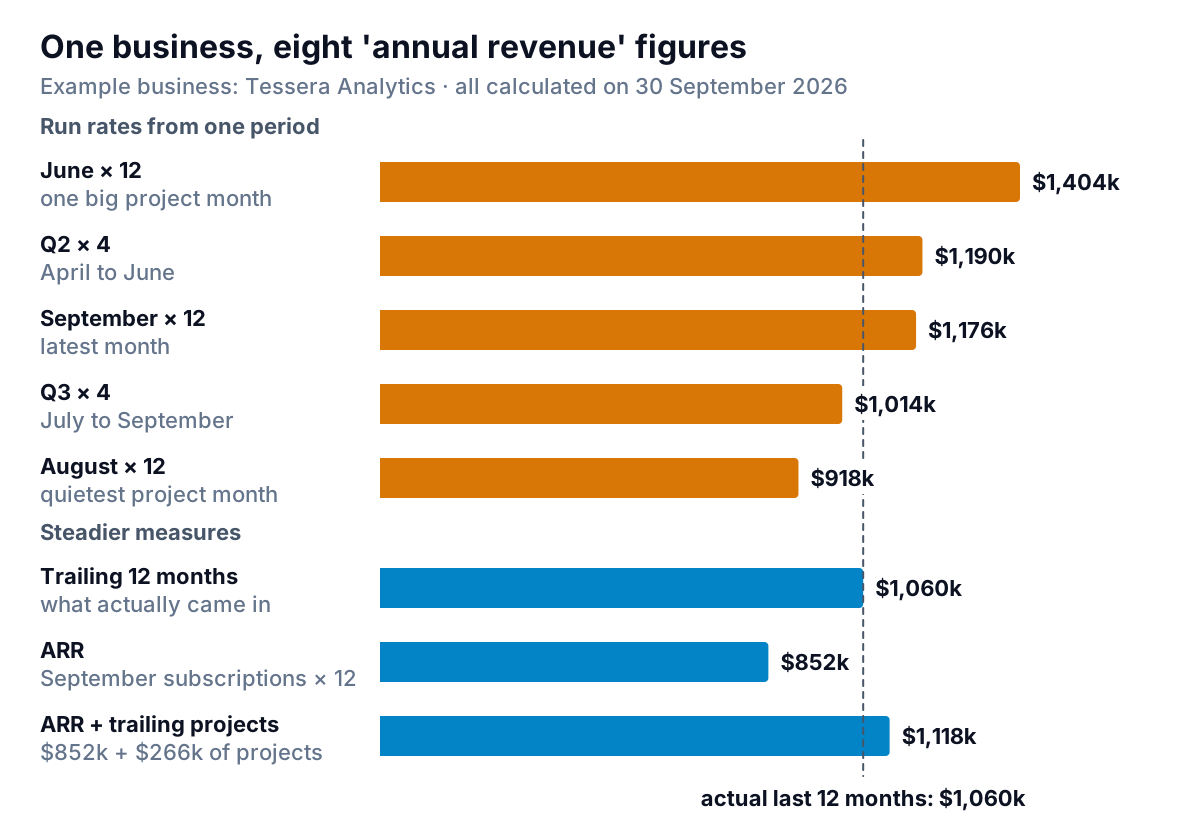
June × 12 gives $1,404,000. August × 12 gives $918,000. The gap between them, $486,000, is almost half of what the business actually earned. Quarterly run rates are steadier ($1,190,000 for April to June, $1,014,000 for July to September) but still swing with the project pipeline and the summer lull.
The figures underneath are the ones that hold up. Trailing twelve months, $1,060,000, is what Tessera actually invoiced. ARR, $852,000, is the subscription base alone. And ARR plus the last twelve months of project revenue, $1,118,000, is a reasonable starting point for next year's plan.
When a run rate misleads
A run rate is only as good as the period behind it. Five situations break it.
1. One-off revenue in the base period
A big project, a setup fee, a bulk order or a one-time licence inflates the month it lands in, and multiplying by twelve assumes it repeats twelve times. Andreessen Horowitz's guide to startup metrics lists this as a common error when founders multiply one month's bookings by 12: counting non-recurring fees such as setup, installation and professional services. Split recurring from one-off revenue before you annualise anything.
2. Seasonality
A landscaper's June, a gift shop's December or a tax preparer's March are not one-twelfth of the year. Tessera's projects slow every summer because clients' finance teams are on holiday. If your business has a season, a single-month or single-quarter run rate is close to meaningless. Use trailing twelve months, or compare the month with the same month last year.
3. A growth or decline trend
A run rate freezes the business at one moment. If revenue is growing 3% a month, a run rate based on today understates next year. If it's shrinking, a run rate overstates it. Say whether the base period is part of a trend, and if it is, project the trend instead of multiplying.
4. Churn that hasn't happened yet
A subscription business can have customers who've given notice but are still paying. They're in this month's revenue and in the run rate, but they won't be there in three months. Stripe's billing analytics, for example, stop counting a subscription in MRR once it's canceled or marked unpaid, and include ones that are past due. Check how your own system handles both before you quote it.
5. Bookings, billings and revenue mixed up
A signed $120,000 contract is a booking. The $30,000 invoice for the first quarter is a billing. The $10,000 you earn in month one is revenue. Run rates should be built on revenue, the same number as your profit and loss statement. If you use bookings or cash received, say so.
Run rate vs ARR vs trailing twelve months
These three are often used interchangeably, and they shouldn't be.
- Run rate annualises one period of total revenue. Useful for steady businesses; unreliable for lumpy or seasonal ones.
- ARR (annual recurring revenue) annualises only the recurring part, usually this month's subscription revenue × 12. a16z defines ARR as revenue components that are recurring in nature, excluding one-time fees and professional services. It's the standard measure for subscription businesses, because it shows the base you start next year with.
- Trailing twelve months (TTM) is the actual revenue of the last twelve months, straight from your books. It looks backwards, but it's the one figure nobody can argue with, which is why lenders, buyers and accountants start there.
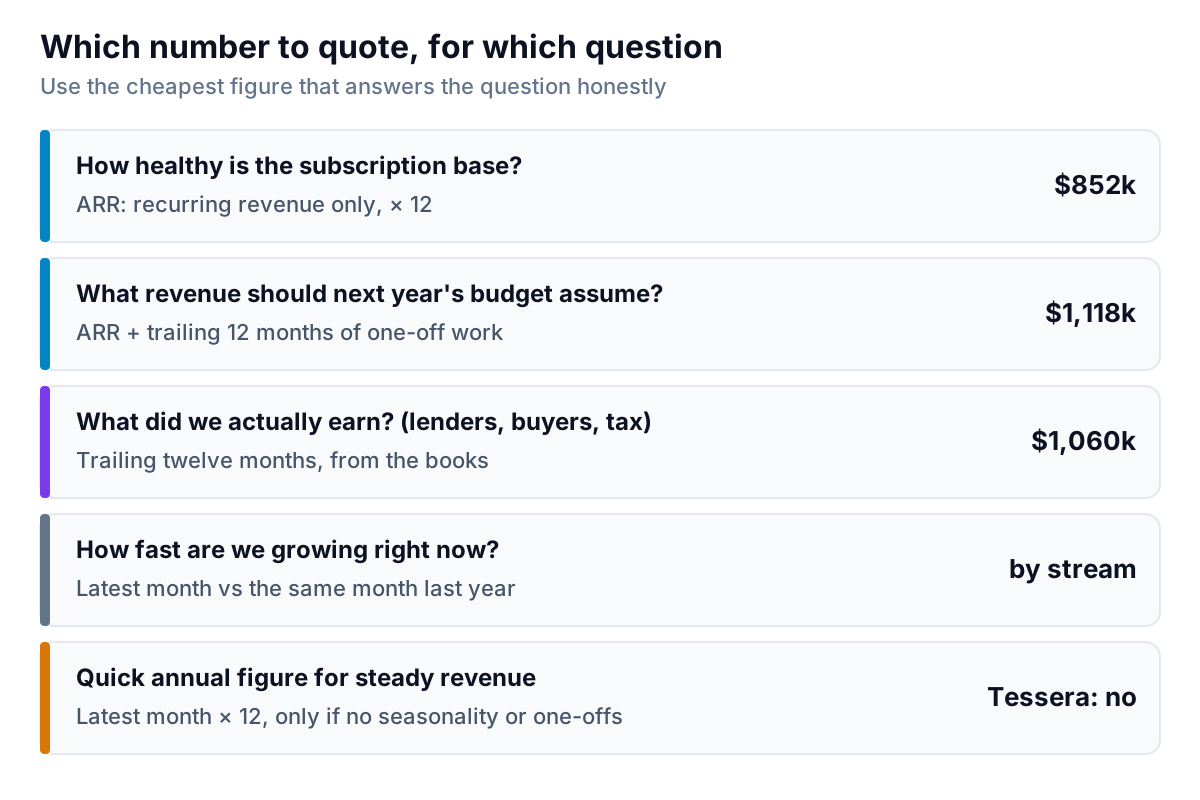
There's no legal definition of run rate or ARR for a private business, which is why you should always state how you calculated yours. Public companies that report metrics like these are expected by the SEC to give a clear definition of the metric and how it is calculated, and to explain why it's useful. It's a good standard for anyone quoting a number to a lender or investor.
Calculating a run rate from your books
You need monthly revenue, split into recurring and one-off.
- Set up the split in your accounting. In QuickBooks Online or Xero, use separate income accounts for subscriptions (or retainers, memberships, maintenance contracts) and for one-off work. If it's all in one "Sales" account today, start splitting from next month, and reclassify the last twelve months if you can.
- Run a profit and loss report by month. In QuickBooks Online, the Profit and Loss report can show columns by month; Xero's Profit and Loss report can compare periods. Export to a spreadsheet.
- Build four rows. Latest month × 12 (run rate). Latest month's recurring revenue × 12 (ARR). Sum of the last twelve months (TTM). And the same month last year, for growth.
- If you bill through Stripe, its Billing overview shows MRR directly; multiply by 12 for ARR, and read Stripe's definitions so you know what's included. Our guide to Stripe reports covers which numbers to trust.
In a spreadsheet with months in columns B to M and revenue in row 5, TTM is =SUM(B5:M5), the run rate is =M5*12, and a three-month run rate is =SUM(K5:M5)*4. Put them side by side every month and watch how far they drift apart; the drift tells you how lumpy your revenue is.
A better forward number: build it by stream
If what you really want is "what will we bring in over the next twelve months?", don't multiply anything. Forecast each stream on its own terms and add them up.
- Recurring revenue: start from this month's subscription revenue and apply the growth rate you've actually seen. Tessera's subscriptions went from $60,000 to $71,000 in eleven months, about 1.5% a month. Twelve more months at that rate adds up to roughly $940,000.
- One-off revenue: use the trailing twelve months unless you have a signed pipeline that says otherwise. For Tessera that's $266,000.
- Total: about $1,206,000, with the assumptions written next to it.
That's higher than the September run rate of $1,176,000 and far below the June one, and unlike either, you can defend every part of it. Revisit the growth rate every quarter; if subscriptions stall, the forecast should drop the same month. If you're spending ahead of that revenue, our guide to burn rate shows how to work out how long the cash lasts in the meantime.
Using a run rate honestly
Run rates aren't the problem; unexplained run rates are. Three habits make yours credible:
- Name the period. "September × 12" or "Q3 × 4", never just "run rate".
- Say what's in it. Recurring only, or recurring plus one-off? Revenue, billings or cash?
- Show TTM next to it. If the run rate is higher, explain why in one sentence: "subscriptions grew 18% over the year", not "June was a big month".
Had Tessera's founder said "$852,000 of ARR, growing about 1.5% a month, plus $266,000 of project work over the last twelve months", the lender would have heard a stronger story than "$1.4 million run rate", and one that checked out against the books. For more on how the revenue side fits into wider reporting, see our sales report guide and the cash flow forecast, which turns these figures into a monthly cash plan.
Parity builds the side-by-side view for you. Connect Stripe or QuickBooks Online, or upload a revenue export as CSV or Excel, and it builds a dashboard with your headline numbers and their trends, charts, what explains them and a table of what needs attention. Ask by chat for run rate, ARR and trailing twelve months by month, split by revenue stream, and every number is checked against queries on the full dataset before you see it. Share it with a read-only link, or ask it to write the monthly investor or lender report from the same data.
Bring in your revenue and get a checked dashboard of run rate, ARR and trailing twelve months, split by stream. Build a report from your data free
A run rate is a useful shorthand for "where we are right now". Just make sure the month you picked is one you'd be happy to see eleven more times.