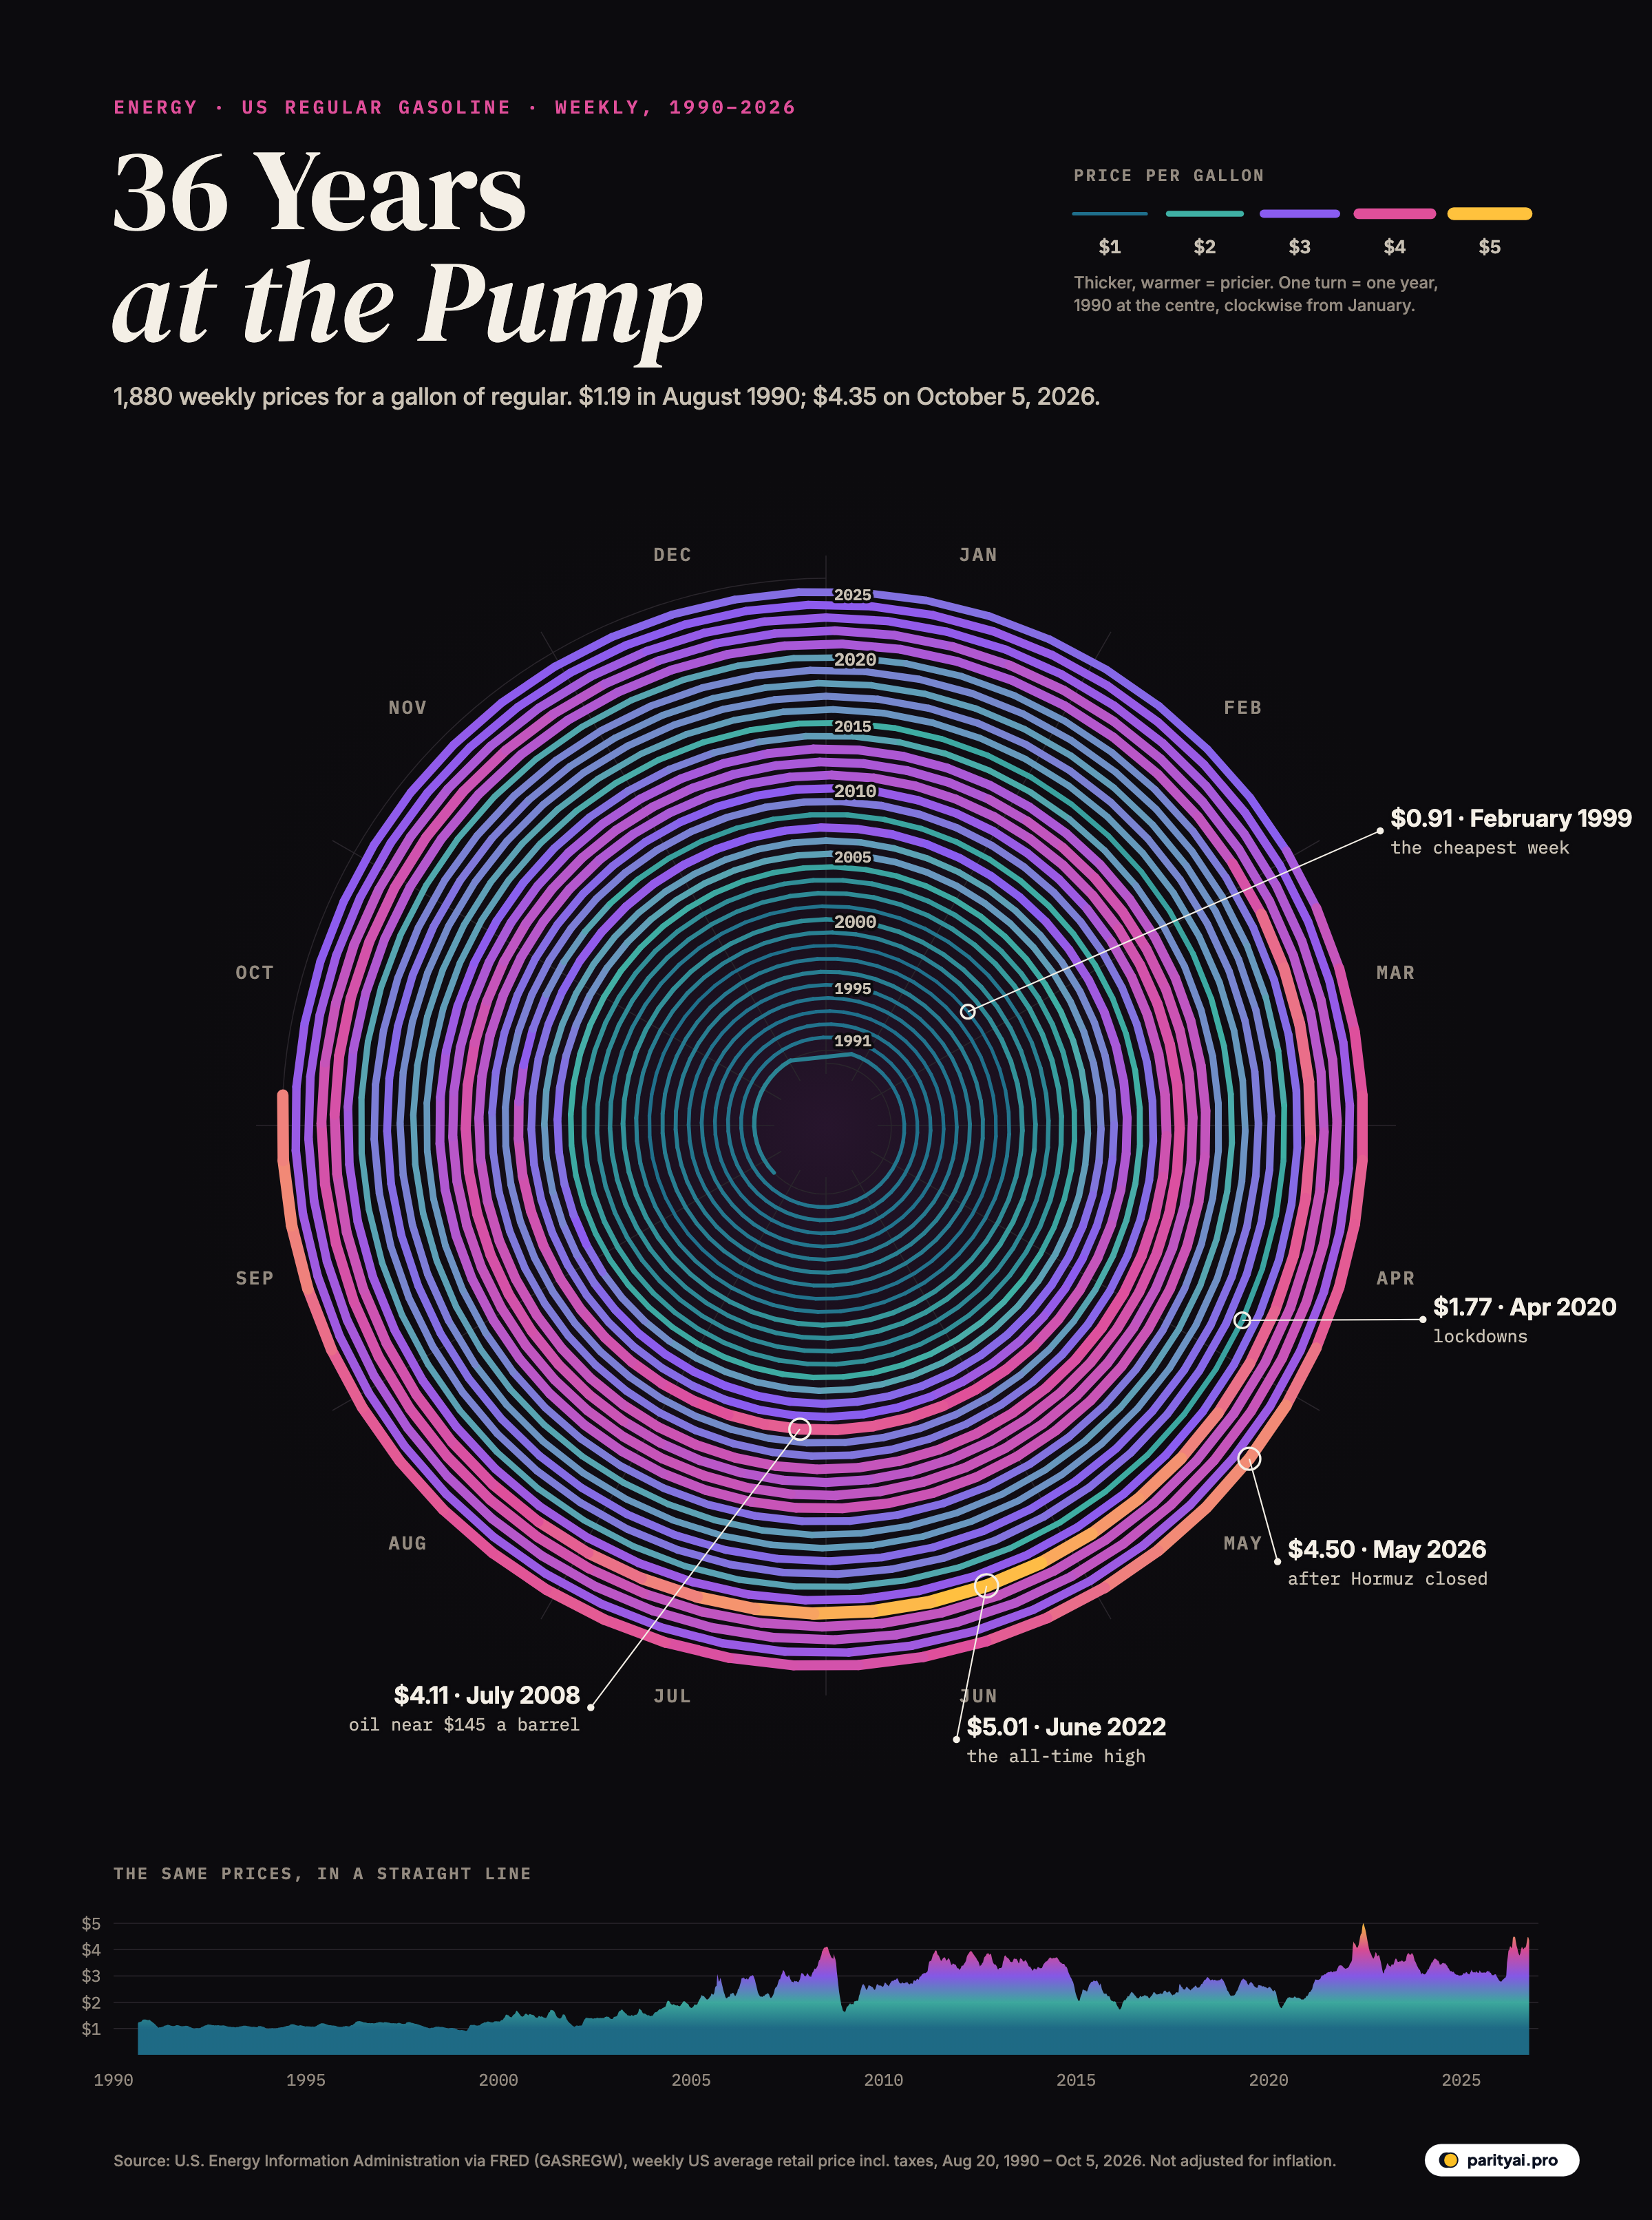
Most prices in America are hidden on a shelf tag or buried in a bill. The price of gasoline is printed in numbers a foot tall on a pole at every other street corner. People who could not tell you the interest rate on their mortgage know, to the cent, what a gallon cost last week. When it moves, everyone notices, and politicians get blamed.
The spiral above holds 1,880 of those numbers. It starts at the centre in August 1990, when the U.S. Energy Information Administration began publishing a weekly national average for regular gasoline, and it winds outward one full turn per year, clockwise from January at the top, to the latest reading on October 5, 2026. Every week is a short segment. Cheap weeks are drawn thin and teal; expensive weeks are thick and run from violet through pink to gold. The faint labels along the top mark where each turn crosses New Year's Day.
Read it from the inside out and the story of American driving costs since the first Gulf War unwinds in front of you: a long, quiet middle, then a widening, restless outer edge. Below the spiral the same 1,880 prices are laid out in an ordinary line, for anyone who would rather read it flat.
Under a dollar fifty, for a long time
The inner third of the spiral is almost uniformly thin and blue. In the first week of the data, August 20, 1990, a gallon cost $1.19. Iraq had invaded Kuwait less than three weeks earlier, and prices were already rising. Yet across the whole of 1991 the average was just $1.10, and for most of the decade a tank of gas barely changed in price from one year to the next.
The cheapest week in the entire record came near the end of that era. On February 22, 1999, a gallon cost $0.91. Crude oil was in a glut: demand in Asia had collapsed after the region's 1997 financial crisis while producers kept pumping, and oil fell to its lowest levels in decades. In today's money, that $0.91 gallon would be about $1.84.
That inflation adjustment matters for reading the spiral honestly. The chart shows the prices people actually paid, not adjusted for inflation, and consumer prices overall have risen about 2.5 times since 1990. The pump price has risen 3.7 times. So gas has outpaced general inflation, but by less than the colours alone suggest: the $1.19 of August 1990 is worth about $3.02 in August 2026 dollars.
The spiral starts to thicken
Somewhere around the 2000 label the line warms from teal to green. Gas averaged $1.48 in 2000. It first crossed $2 a gallon in May 2004, and $3 in September 2005, when Hurricane Katrina knocked out refineries and pipelines along the Gulf Coast.
Those were not one-off events. Through the early 2000s, oil demand from China and other fast-growing economies rose faster than new supply, and each turn of the spiral is a little thicker and a little warmer than the one inside it. The weekly price became something people checked, not something they assumed.
Four dollars, then a cliff
The first gold-tinged bulge, low on the left side of the spiral, is the summer of 2008. Gas first reached $4 in June 2008, and the weekly average peaked at $4.11 on July 7, 2008, when crude oil was trading close to $145 a barrel. Adjusted for inflation, the highest week in the whole record is not in 2022 but here: June 30, 2008, at the equivalent of $6.29 today.
What happened next is visible as an abrupt thinning of the line. The financial crisis broke in September, demand collapsed and oil fell by more than two-thirds. By December 29, 2008, gas was down to $1.61, a 61% fall in less than six months. The biggest one-week drop in the data, −33¢, came on October 13, 2008, a month after Lehman Brothers failed.
The long plateau
From 2011 to 2014 the spiral settles into a thick, violet band. Oil spent most of those years above $100 a barrel, and gas stayed mostly between about $3.20 and $4. Few people remember this as a crisis, because there was no single dramatic spike. But the 2012 average of $3.62 is worth about $5.27 in today's money, which makes it one of the most expensive years for drivers in the whole record.
Then the band thins sharply. Around 2015, American shale oil production surged and OPEC chose to keep pumping rather than cut output to defend prices. Gas averaged $2.43 that year and stayed in the twos for most of the rest of the decade, a teal stretch that sits between the violet years on either side.
| Moment | Week of | Price then | In August 2026 dollars |
|---|---|---|---|
| First week in the data | August 20, 1990 | $3.02 | |
| Cheapest week of the 1990s oil glut | February 22, 1999 | $1.84 | |
| 2008 peak, before the financial crisis | July 7, 2008 | $6.28 | |
| After the 2008 crash | December 29, 2008 | $2.55 | |
| Pandemic low | April 27, 2020 | $2.31 | |
| All-time high, after Russia invaded Ukraine | June 13, 2022 | $5.67 | |
| Peak since the Strait of Hormuz closed | May 11, 2026 | $4.50 | |
| Latest week | October 5, 2026 | $4.35 |
Weekly US average retail price of a gallon of regular gasoline, including taxes. Inflation-adjusted with CPI-U.
The week nobody drove
The thinnest stretch of the outer spiral is the spring of 2020. With much of the country under stay-at-home orders, Americans stopped commuting and flying almost overnight, and fuel demand fell off a cliff. On April 20, oil futures for May delivery briefly traded below zero, because traders had nowhere left to store crude. A week later, on April 27, 2020, a gallon of regular averaged $1.77, the lowest since early 2016. The 2020 average was $2.17.
Five dollars
The economy reopened faster than oil production did. Prices climbed through 2021, and when Russia invaded Ukraine in February 2022, they jumped. The biggest one-week rise in the data, +49¢, came on March 7, 2022.
On June 13, 2022, the national average reached $5.01, the highest weekly price ever recorded. It is the brightest gold segment on the chart, low and slightly right of centre. The U.S. Energy Information Administration attributes the spike mainly to rising crude prices and strong demand, with the invasion contributing, and to low refinery output and inventories that spring. It was the only week in the data at or above $5. In inflation-adjusted terms, though, it was about $5.67, below the summer of 2008.
Hormuz
The outermost turn of the spiral is the newest, and it is the most violent since 2022. Gas averaged $2.91 in February 2026. Then, according to the EIA, military action in the Middle East on February 28 led to the de facto closure of the Strait of Hormuz, the narrow channel between Iran and Oman through which a large share of the world's seaborne oil passes. We charted the collapse in ship traffic through the strait in an earlier story.
The pump reacted within days. The weekly price rose +49¢ on March 9, 2026, tying the biggest one-week jump on record. Brent crude averaged $103 a barrel in March, and by the EIA's count the national average reached $3.99 on March 30. The 2026 peak came on May 11, 2026: $4.50, 55% above the February average.
A US–Iran memorandum of understanding signed on June 18 reopened the strait, and prices eased through early summer. They did not stay down. Shipping through Hormuz fell again in July and August, to about five vessels a day by Al Jazeera's count, and the national average climbed back towards $4.50. AAA called September's average of $4.33 the highest ever for that month. The latest weekly price is $4.35.
So far in 2026, gas has averaged $3.84, against $3.10 in 2025. Of the 53 weeks in the whole record when gas cost $4 or more, 23 came in 2026, as many as in 2022 and far more than the 7 in 2008.
What a gallon pays for
Why does a war on the other side of the world move the price at a petrol station in Ohio within a week? Because crude oil is the biggest single part of what you pay. In 2025, when gas averaged about $3.10, the EIA estimates that crude oil made up roughly half the price of a gallon, with refining, distribution and marketing, and taxes splitting the rest. Crude is priced on a world market, so a shock anywhere is a shock everywhere.
Taxes, on the other hand, barely move. The federal tax is 18.4 cents a gallon, and it has not changed since 1993. State taxes averaged about 33.6 cents in January 2026, though they vary widely from state to state, which is one reason a gallon in California costs so much more than one in Mississippi.
That fixed tax is also why the line on the spiral looks so different in the early and late years. In 1991, taxes were a large share of a price that barely moved. Today, crude oil's share of a much higher price makes every swing in the oil market show up at the pump, which is why the outer turns of the spiral are so much more uneven than the inner ones.
| Year | Average | In today's dollars | Weekly prices | Low – high |
|---|---|---|---|---|
| 2026 (to Oct 5) | $3.86 | $2.78 – $4.50 | ||
| 2025 | $3.21 | $2.81 – $3.24 | ||
| 2024 | $3.52 | $3.01 – $3.67 | ||
| 2023 | $3.86 | $3.05 – $3.88 | ||
| 2022 | $4.51 | $3.09 – $5.01 | ||
| 2021 | $3.70 | $2.25 – $3.41 | ||
| 2020 | $2.80 | $1.77 – $2.58 | ||
| 2019 | $3.40 | $2.24 – $2.90 | ||
| 2018 | $3.62 | $2.27 – $2.96 | ||
| 2017 | $3.29 | $2.26 – $2.69 | ||
| 2016 | $2.98 | $1.72 – $2.40 | ||
| 2015 | $3.42 | $2.03 – $2.83 | ||
| 2014 | $4.74 | $2.30 – $3.71 | ||
| 2013 | $5.03 | $3.19 – $3.78 | ||
| 2012 | $5.27 | $3.25 – $3.94 | ||
| 2011 | $5.23 | $3.07 – $3.96 | ||
| 2010 | $4.26 | $2.61 – $3.05 | ||
| 2009 | $3.66 | $1.68 – $2.69 | ||
| 2008 | $5.03 | $1.61 – $4.11 | ||
| 2007 | $4.50 | $2.17 – $3.22 | ||
| 2006 | $4.26 | $2.20 – $3.04 | ||
| 2005 | $3.88 | $1.78 – $3.07 | ||
| 2004 | $3.27 | $1.51 – $2.06 | ||
| 2003 | $2.83 | $1.44 – $1.75 | ||
| 2002 | $2.50 | $1.10 – $1.46 | ||
| 2001 | $2.68 | $1.06 – $1.71 | ||
| 2000 | $2.88 | $1.26 – $1.68 | ||
| 1999 | $2.28 | $0.91 – $1.27 | ||
| 1998 | $2.11 | $0.94 – $1.10 | ||
| 1997 | $2.50 | $1.11 – $1.24 | ||
| 1996 | $2.55 | $1.08 – $1.28 | ||
| 1995 | $2.44 | $1.06 – $1.20 | ||
| 1994 | $2.42 | $0.99 – $1.17 | ||
| 1993 | $2.47 | $1.00 – $1.11 | ||
| 1992 | $2.59 | $0.99 – $1.15 | ||
| 1991 | $2.69 | $1.02 – $1.19 | ||
| 1990 (from Aug 20) | $3.26 | $1.19 – $1.34 |
Reading the spiral
A few notes on what the chart does and doesn't show.
- One price for a whole country. This is the national average for regular gasoline. Prices in individual states can be a dollar or more above or below it, and premium and diesel follow their own paths.
- Not adjusted for inflation. The spiral shows prices as they were posted, because that is what drivers remember. The tables give inflation-adjusted values using the Consumer Price Index.
- Weekly averages. The EIA surveys retail stations each Monday. Short spikes within a week, including the ones that make the evening news, are smoothed out.
- Space, not time, gets wider. Outer turns are longer than inner ones, so each later year takes up more ink. Judge each year by its thickness and colour, not its length.
The next turn
The spiral has a way of making the present look exceptional, because the newest turn is always the outermost and the largest. Some of that is just geometry. But the chart also shows something that isn't an illusion: since the mid-2000s, the price of a gallon has swung further, faster and more often than it did in the 1990s. The 2008 peak, the 2014 slump, the 2020 crash, the 2022 record and the Hormuz shock of 2026 are five big swings in less than twenty years.
The next turn of the spiral begins in January 2027. Whether it is thin and teal or thick and gold depends less on anything that happens in America than on whether tankers can sail through a channel about twenty miles wide between Iran and Oman.
Sources and method
- U.S. Energy Information Administration, US Regular All Formulations Gas Price (GASREGW), via FRED. Weekly, August 20, 1990 to October 5, 2026, retrieved October 11, 2026
- U.S. Bureau of Labor Statistics, Consumer Price Index for All Urban Consumers (CPIAUCSL), via FRED. Used to express past prices in today's dollars
Prices are EIA's weekly US average retail price for a gallon of regular gasoline (all formulations, including taxes), as published on Mondays. The spiral turns once per calendar year, clockwise from January at the top; each segment joins one weekly price to the next. Inflation-adjusted figures scale each week's price by the ratio of the latest available monthly CPI-U to the CPI-U of that week's month.
Charts like this, from your own numbers.
Connect a spreadsheet or the tools you run on, and Parity builds the dashboard and writes the report, with every number checked.
Try Parity free

