Northfield Cycles pays Rookery Creative, an example nine-person branding and design studio, more than any other client: a $25,000 monthly retainer. In Q3 2026 the team spent 640 hours on it against 450 sold, so the account earned $117.19 an hour, barely above the $116.50 each billable hour costs once overhead is counted. Revenue won't show you that. Two agency KPIs will: utilization (billable hours ÷ available hours) and effective rate (revenue ÷ billable hours). Together they set revenue: available hours × utilization × effective rate. Add retainer health, client concentration and pipeline coverage, and five numbers tell you whether the agency is making money on its time and whether it will next quarter.
Most lists of agency KPIs run to twenty or thirty items, mixing client campaign metrics with the agency's own. This one sticks to the agency's own business. It works through Rookery's quarter, with every number tied back to the time sheet, the invoices and the pipeline, plus a decision rule for each and the benchmarks that are actually published.
Utilization and effective rate: the two agency KPIs that multiply
Rookery has seven people who do client work, plus a managing director and an operations manager who mostly don't. In Q3 2026 each of the seven had 480 available hours (13 weeks × 40 hours, minus holidays and leave), so 3,360 in total. They logged 2,352 hours to client work, and the agency invoiced $315,000.
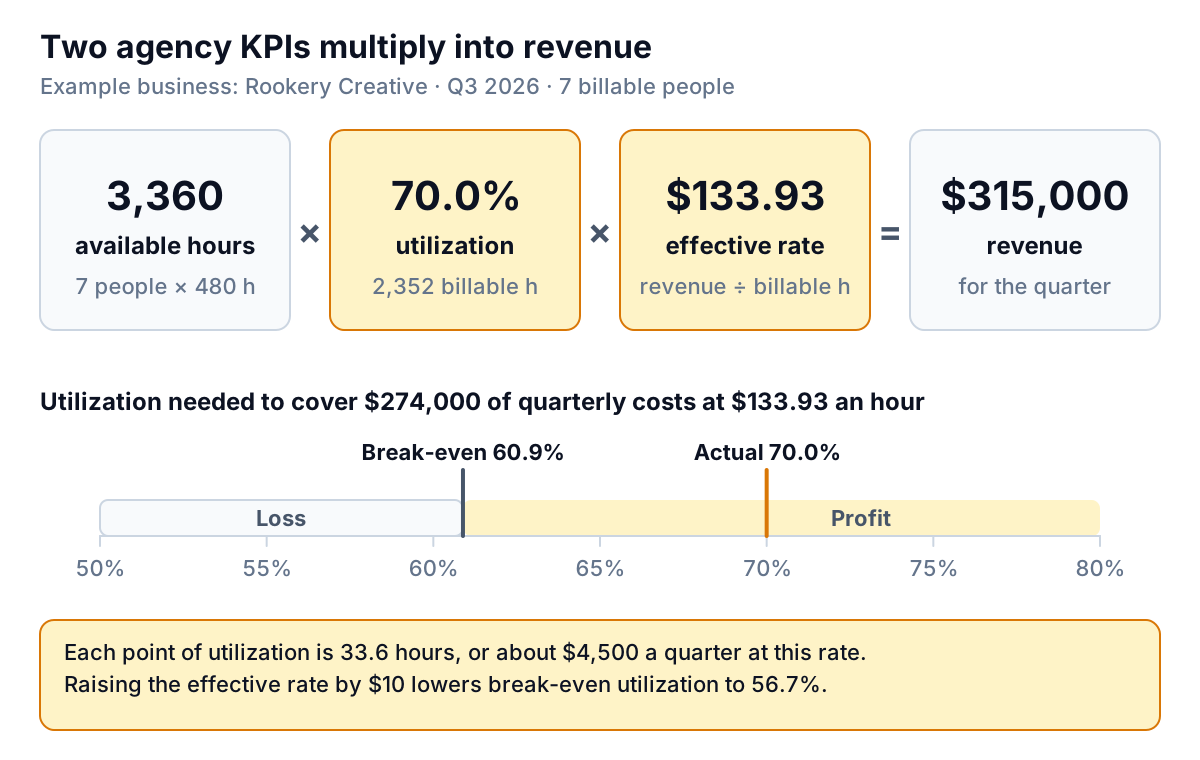
- Utilization: 2,352 ÷ 3,360 = 70.0%.
- Effective rate: $315,000 ÷ 2,352 = $133.93 an hour, against a rate card of $165. The gap is discounts, write-offs and fixed fees that ran over.
Get the definitions straight before you compare months. Available hours exclude holidays and leave, or utilization looks worse every December. Billable means time on client work that the client pays for, whether hourly, inside a retainer or on a fixed fee; internal projects, pitches and admin aren't billable even when they're useful. If you invoice by the hour, our guide to billable hours covers capturing time that would otherwise leak.
Break-even utilization
The most useful number on this page is one most agencies never calculate: the utilization at which revenue just covers costs.
Break-even utilization = total costs ÷ (available hours × effective rate)
Rookery's costs for the quarter were $274,000: $196,000 to deliver the work (salaries, payroll taxes and benefits for the seven, plus freelancers) and $78,000 of overhead (the two non-billable roles, rent, software, insurance, sales). So $274,000 ÷ (3,360 × $133.93) = 60.9%. Each point of utilization is 33.6 hours, worth about $4,500 a quarter at the current rate.
That reframes the usual debate about a "good" utilization target. Rookery is nine points above break-even. If the effective rate rose by $10, break-even would fall to 56.7%; if it fell by $10, break-even would rise to about 65.8%. Rate and utilization trade against each other, and a rate rise is usually easier on the team than more hours.
Decision rules (Rookery's own, set from its costs rather than an industry figure):
- Agency utilization within 5 points of break-even for two months running: a sales problem or a staffing one. Check pipeline coverage below before hiring or cutting.
- Any one person above 85% for a month: they have no time for training, internal work or a sick day. Move work or bring in a freelancer.
Effective rate by client, and retainer health
An agency-wide effective rate hides the clients who pay well and the ones who don't. Split it by client, and for retainers put the hours used next to the hours sold.
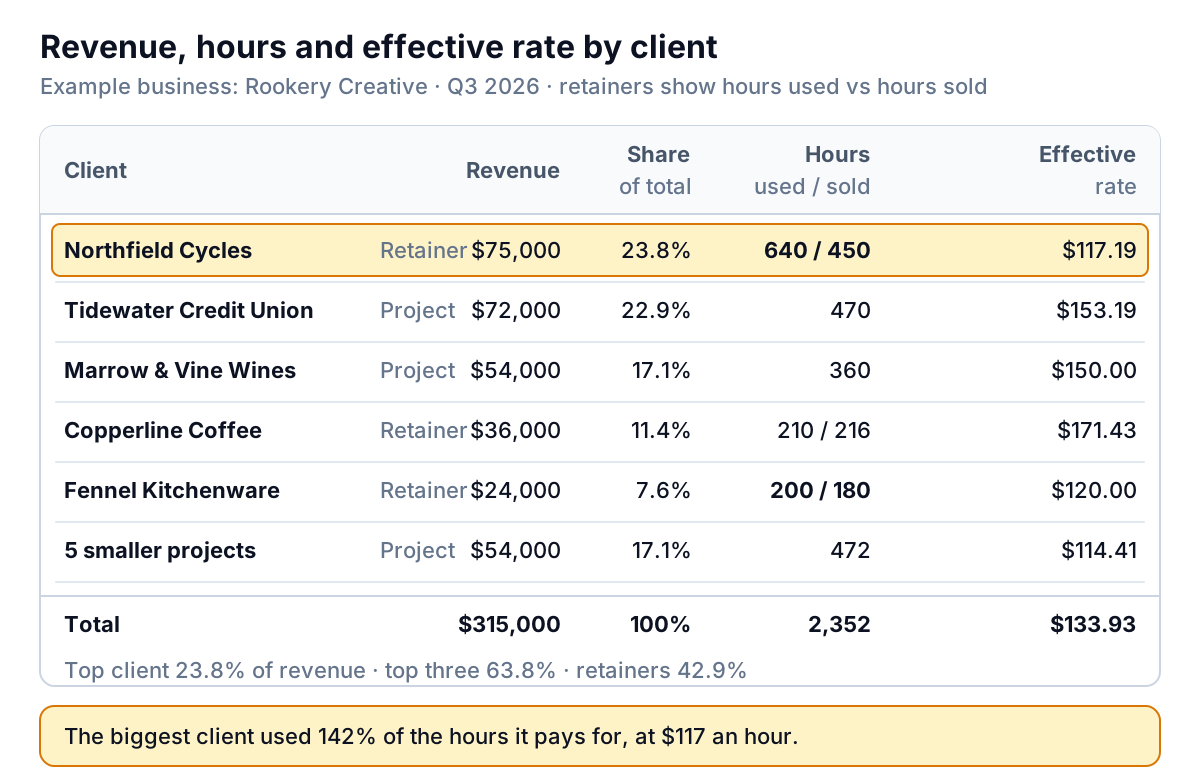
Two reference points make the table readable:
- Delivery cost per billable hour: $196,000 ÷ 2,352 = $83.33. Below this, the work doesn't even pay the people doing it.
- Fully loaded cost per billable hour: $274,000 ÷ 2,352 = $116.50. Below this, the client is losing the agency money once overhead is counted.
Northfield Cycles, Rookery's largest client, pays a $25,000 monthly retainer for 150 hours a month. In Q3 the team spent 640 hours against the 450 sold, 142% of the retainer, so the effective rate fell to $117.19, barely above fully loaded cost. Fennel Kitchenware ran 11% over its hours at $120.00. The five smaller projects averaged $114.41, below fully loaded cost. Copperline Coffee used 97% of its hours and earned $171.43 an hour.
Retainer health comes down to two numbers per retainer, checked monthly:
- Hours used ÷ hours sold. Rookery's rule: between 85% and 105% is healthy. Over 110% for two months is scope creep; raise it with the client using the time report, and either trim the work or reprice at renewal. Under 70% for two months means the client may be paying for value they don't feel, which is a retention risk.
- Effective rate against fully loaded cost. A retainer that earns less than $116.50 an hour at Rookery is a loss once overhead is counted, however steady it feels.
Client concentration
Concentration is the share of revenue from your largest clients. It doesn't affect this quarter's profit; it decides how badly one email can hurt you. At Rookery, Northfield is 23.8% of revenue and the top three clients are 63.8%. Retainers make up 42.9%.
There's no published standard for small agencies, so set limits from your costs. Rookery's: no single client above 25% of trailing-twelve-month revenue, and the top three below 60%. The test behind those numbers: if the largest client left without notice, could the agency cover three months of costs from cash while it replaced the work? Run the same check with your own figures.
Rookery breaks the top-three limit, and its largest client is also one of its least profitable per hour. That's a common and dangerous pairing: the owner is reluctant to reprice the account because it's so large, and it stays large partly because it's underpriced. The fix is to reprice Northfield at renewal and to win work that shifts the mix, which is a pipeline question. A Pareto analysis of revenue and hours by client makes the pattern visible over a full year.
Pipeline coverage: is next quarter paid for?
Utilization and rate describe the quarter you just finished. Pipeline coverage looks ahead: how much of next quarter's revenue is already contracted or likely, against what the agency costs to run and what the team could deliver.
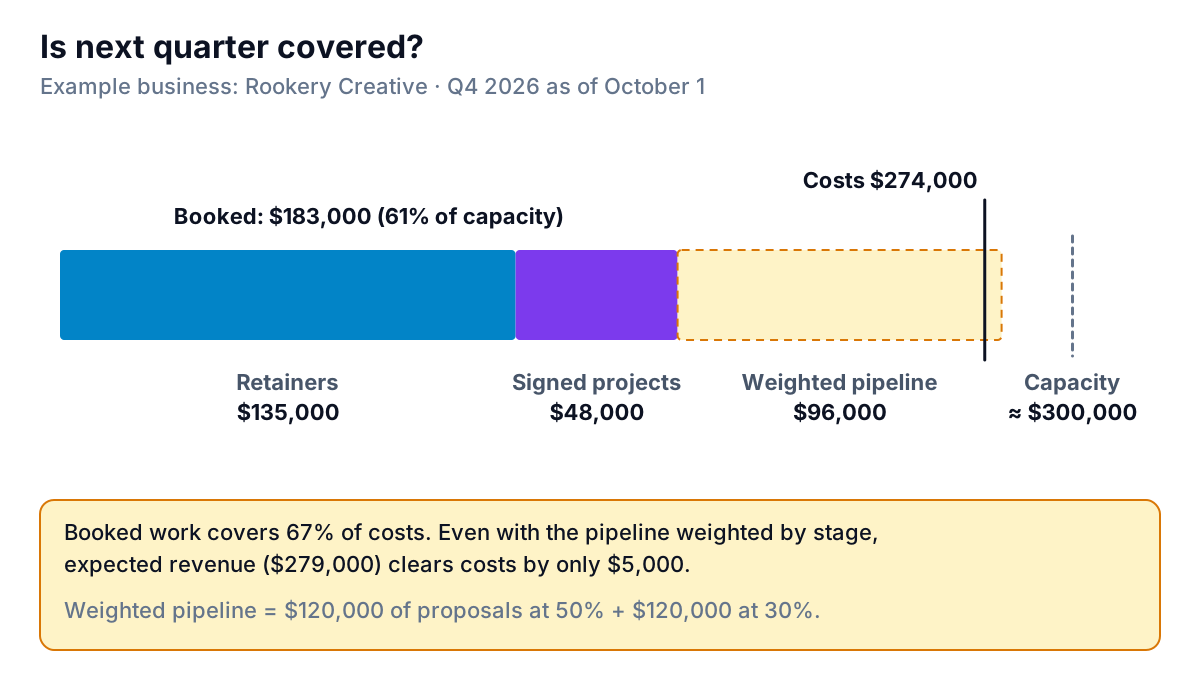
On October 1, Rookery had $135,000 of retainers (assuming all three renew) and $48,000 of signed projects for Q4: $183,000 booked. It had $240,000 of proposals out, which it weights by stage: $120,000 in late-stage talks at 50% and $120,000 of early proposals at 30%, so $96,000. Expected Q4 revenue is $279,000.
Against that, Q4 costs are about $274,000, and capacity is about $300,000 (3,200 available hours after holidays × 70% × $133.93). So:
- Booked ÷ costs: $183,000 ÷ $274,000 = 67%.
- Booked + weighted pipeline ÷ costs: $279,000 ÷ $274,000 = 102%, a $5,000 margin of safety.
Rookery's rule is that booked work should cover at least 80% of next quarter's costs on the first day of the quarter. At 67%, the owner moves time from delivery to new business now, chases decisions on the late-stage proposals, and holds off on the hire planned for November. Use your own stage weights, and check them once a year against how often proposals at each stage actually closed. If your deals live in a CRM, the pipeline report there is the source.
Margins, and the benchmarks that exist
The five KPIs above explain the profit and loss statement; they don't replace it. Two margins sit on top:
- Delivery margin (often called project margin) = (revenue − delivery costs) ÷ revenue. Rookery: ($315,000 − $196,000) ÷ $315,000 = 37.8%.
- Net margin = profit ÷ revenue. Rookery's operating profit was $41,000, or 13.0% before tax.
Published benchmarks for small agencies are scarce, and many are summaries of paywalled reports. One with a stated method: Promethean Research, an agency research firm, surveyed 119 digital agency leaders in February 2026 (74% in the US, average size 31 employees, per its report page). It found an average after-tax net margin of 13% for 2025; 19% for studios with fewer than 10 full-time staff; and 18% for design agencies. Among the 59% of agencies that tracked project margins, the average was 35%.
Read against those, Rookery's delivery margin looks normal, though agencies define project margin in different ways. Its 13.0% net margin is before tax, so after tax it sits well below the 19% average for studios its size. The KPIs say why: an underpriced anchor client and a tail of small projects below fully loaded cost.
Where the numbers come from, and a monthly routine
Every KPI here comes from three systems most agencies already have:
- Time tracking: hours by person, client and project, with a billable flag. Export a CSV for the month.
- Accounting: revenue by client (invoices), delivery costs (payroll, freelancers) and overhead. In QuickBooks Online, the Sales by Customer Summary report and the profit and loss cover most of it.
- CRM or proposal tracker: open deals with value, stage and expected start date.
The monthly routine takes under an hour once the joins are set up: utilization and effective rate against last month and break-even; the client table with retainer hours used vs sold; concentration on a trailing twelve months; and pipeline coverage for next quarter. Put the five on one page, as our KPI dashboard guide describes, and read them with the monthly profit and loss statement.
The hard part is joining the three sources month after month. Parity connects QuickBooks Online and HubSpot directly and takes your time tracker's CSV export, and builds a dashboard from them: the headline numbers with their trends, charts by client, what explains the changes, and a table of what needs attention, such as retainers running over their hours. Every number is checked against queries on the full dataset before you see it. Refine it by chat ("add fully loaded cost per hour at $274,000 a quarter", "flag retainers over 110% of sold hours"), save it as a template, and update it next month with the newer export. Ask, and it writes the quarterly report for your business partner from the same data.
Bring your time tracking export, invoices and pipeline together and get a checked agency KPI dashboard. Build a report from your data free
If you only keep one habit from this, make it the break-even line. Knowing that Rookery loses money below 60.9% utilization at $133.93 an hour turns every pricing, hiring and scoping decision into arithmetic instead of a feeling.