On paper, Birch was the weakest of the three cabins at Cedar Hollow Cabins, an example business, in October: guests booked 20 of its 31 nights, or 64.5%. In fact Birch earned the most per available night of the three. It only looked weak because the owners stayed in it for six nights. An Airbnb occupancy rate should count only the nights you offered: booked nights ÷ available nights × 100. On that basis Birch ran at 80.0%.
The formula looks too simple to get wrong, and yet two hosts with identical calendars can report different numbers, because "available" means different things in different tools. Owner stays, repair weeks, nights sold on another site and nights your own minimum-stay rule made unsellable all land somewhere in the formula. This guide works through October at Cedar Hollow to show which nights belong in the Airbnb occupancy rate, where to find them, what a typical figure looks like (with a source), and how to read occupancy next to price before you change anything.
The formula, and the denominator that changes the answer
Start with the calendar, not a dashboard. Every night of the month falls into one of four buckets:
- Booked: a paying guest stayed, on any channel (Airbnb, Vrbo, direct).
- Owner or personal use: you or family used it.
- Blocked for maintenance: repairs, deep cleans, a burst pipe.
- Open: offered to guests and not sold.
Available nights are booked plus open. Owner and maintenance nights come out of the denominator, because they were never for sale. Here is October at Cedar Hollow:
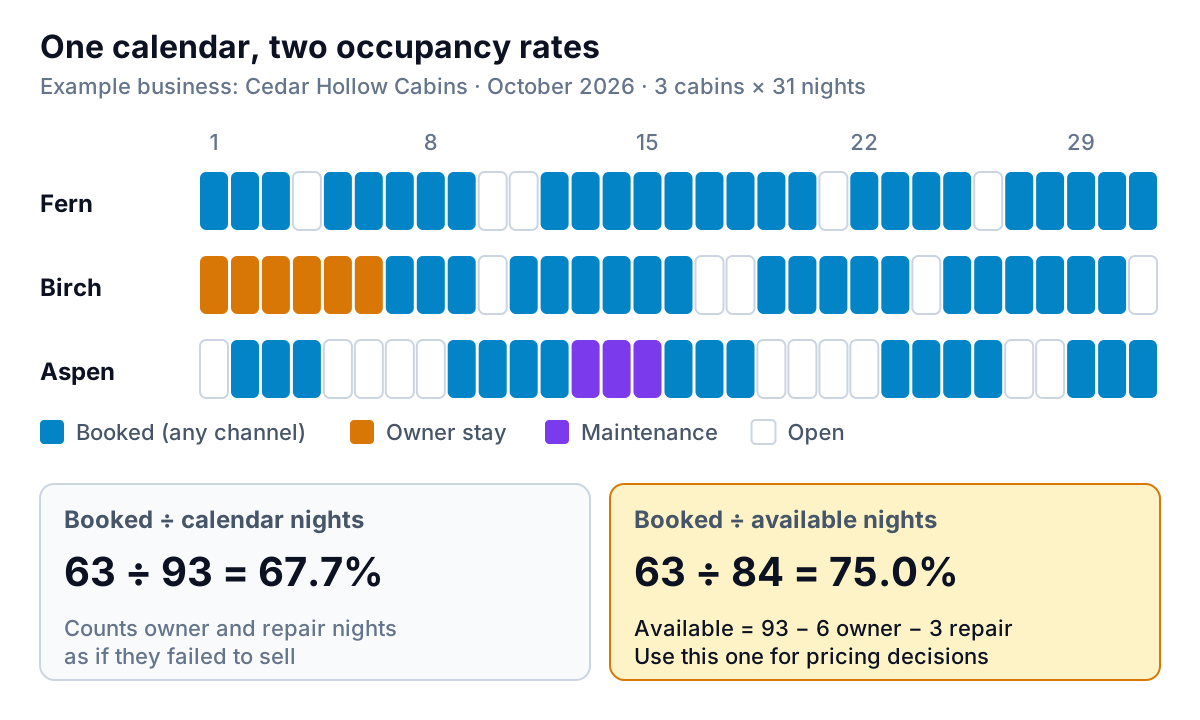
Three cabins × 31 nights is 93 calendar nights. The owners spent six nights in Birch, and Aspen was closed for three nights while its deck was rebuilt, so 84 nights were available. Guests booked 63 of them.
- Booked ÷ calendar nights: 63 ÷ 93 = 67.7%
- Booked ÷ available nights: 63 ÷ 84 = 75.0%
Use the second one for pricing and performance. The first one answers a different question (how much of the year did the property earn?), which matters for an investment case but punishes you for every night you chose not to sell. If you report occupancy to a co-owner, write the formula next to the number so nobody compares a 75% to someone else's 67.7%.
Where the inputs live, and why Airbnb's own numbers can differ
If you host only on Airbnb, the quickest source is the platform itself. Hosts who opt in to professional hosting tools get an Insights section with an "Occupancy and rates" view. Airbnb's help centre defines its occupancy rate as nights booked divided by total nights available, and its average nightly rate as total nightly revenue divided by booked nights. The same page lets you compare your listings with similar ones in your area.
Two details explain most of the gaps between Airbnb's figure and your own:
- Nights sold elsewhere look blocked, not booked. When you sync calendars, Airbnb says nights booked on another website are automatically blocked on Airbnb. So Airbnb's numbers describe Airbnb's share of your calendar, not the whole cabin. At Cedar Hollow, 48 of the 63 booked nights came through Airbnb, 9 through Vrbo and 6 direct.
- "Blocked" covers more than your own blocks. Airbnb's list of reasons a night may be blocked includes preparation time, advance notice, minimum-night settings and restricted check-in days, along with synced calendars and pending requests. A one-night gap between two stays on a cabin with a three-night minimum shows as blocked even though you would happily sell it.
That second point matters. Those minimum-stay gaps are lost sales, not owner time, and they should stay in your denominator as open nights. Otherwise your own rules flatter your occupancy rate.
The spreadsheet route
If you list on more than one channel, build the month from the reservations themselves. Airbnb lets you export earnings to a CSV (Today, then Menu, then Earnings, then Get report), with gross earnings, host service fees and cleaning fees per reservation. Add the other channels' reservation exports or your channel manager's report, then keep one row per stay: cabin, check-in, check-out, channel, nightly revenue. Add a small table of owner and maintenance blocks. Nights booked per cabin per month is then a count, and the rest of this guide is arithmetic on those two tables.
What is a typical Airbnb occupancy rate?
The most-quoted national figure comes from AirDNA, a data vendor that tracks short-term rental listings on Airbnb, Vrbo and Booking.com. In its 2026 midyear outlook, published July 7, 2026, AirDNA forecast US short-term rental occupancy at 57.4% for 2026 and 57.5% for 2027, just above the pre-pandemic average of 57%.
Before you hold your cabin up against that, check how it was measured. AirDNA's help centre says it calculates occupancy as booked nights ÷ "active listing nights", where an active night is one that isn't blocked and is either reserved or available, and only for listings with a reservation in the past 28 days. Blocked nights are excluded, as in the 75.0% version above. Its booked and blocked nights are also estimated from public calendars by a model, not read from hosts' books. So the national figure is an average of active listings only, across city flats, beach houses and cabins, in every season.
Three practical consequences:
- Compare your available-nights rate, not your calendar-nights rate, with AirDNA's.
- A national average is a weak target for one property. Your own same month last year, and similar listings in your area (Airbnb's Insights shows this comparison), tell you far more.
- Don't compare with hotels. AirDNA notes in the same report that hotels and short-term rentals measure occupancy differently, so only the growth rates are comparable. If you run a guesthouse with rooms, our sibling guide on hotel occupancy rate uses the hotel definitions.
Read occupancy next to ADR, never alone
A high Airbnb occupancy rate can mean the cabin is in demand or that it's cheap. You can't tell which from occupancy alone. Put it next to the average daily rate (ADR: nightly revenue ÷ booked nights) and the number that combines them, revenue per available night (RevPAR: nightly revenue ÷ available nights, which equals occupancy × ADR).
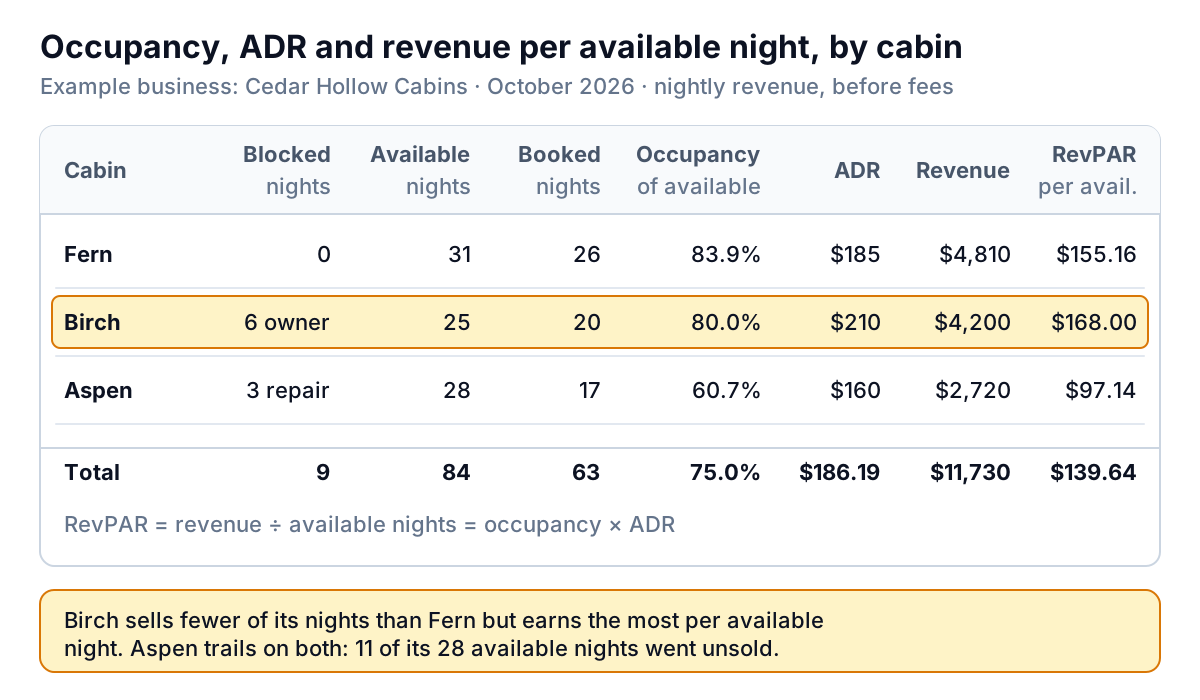
Read across the rows:
- Fern sells the most nights (83.9%) at $185. Strong demand at that price, and possibly room to raise it on the nights that sell first.
- Birch sells slightly fewer (80.0%) but at $210, so it earns the most per available night: $168.00. On a calendar-nights basis it would show 20 ÷ 31 = 64.5% and look like the weakest cabin, purely because the owners stayed in it.
- Aspen trails on both, 60.7% at $160, so $97.14 per available night. Eleven open nights is the problem to solve.
Keep cleaning fees out of ADR. They are paid per stay, so a month of short stays inflates "revenue per night" while costing you more turnovers. Taxes collected for the city or state aren't yours at all. For the hotel-industry version of this measure, see our guide to RevPAR.
When filling more nights costs you money
The obvious fix for Aspen is a lower price. Before doing it, work out what each extra night is worth after the costs that rise with occupancy. Cedar Hollow's owner estimated how many November nights Aspen would sell at three prices, then took off the host service fee, the costs per occupied night (utilities, consumables: about $18) and the costs per stay that the cleaning fee doesn't cover (laundry, restocking, wear: about $35).
For the fee, Airbnb's single-fee structure, which it is moving all hosts to, deducts 15.5% from most hosts' payouts; the older split fee charged most hosts 3%. Use whatever rate your earnings CSV shows.
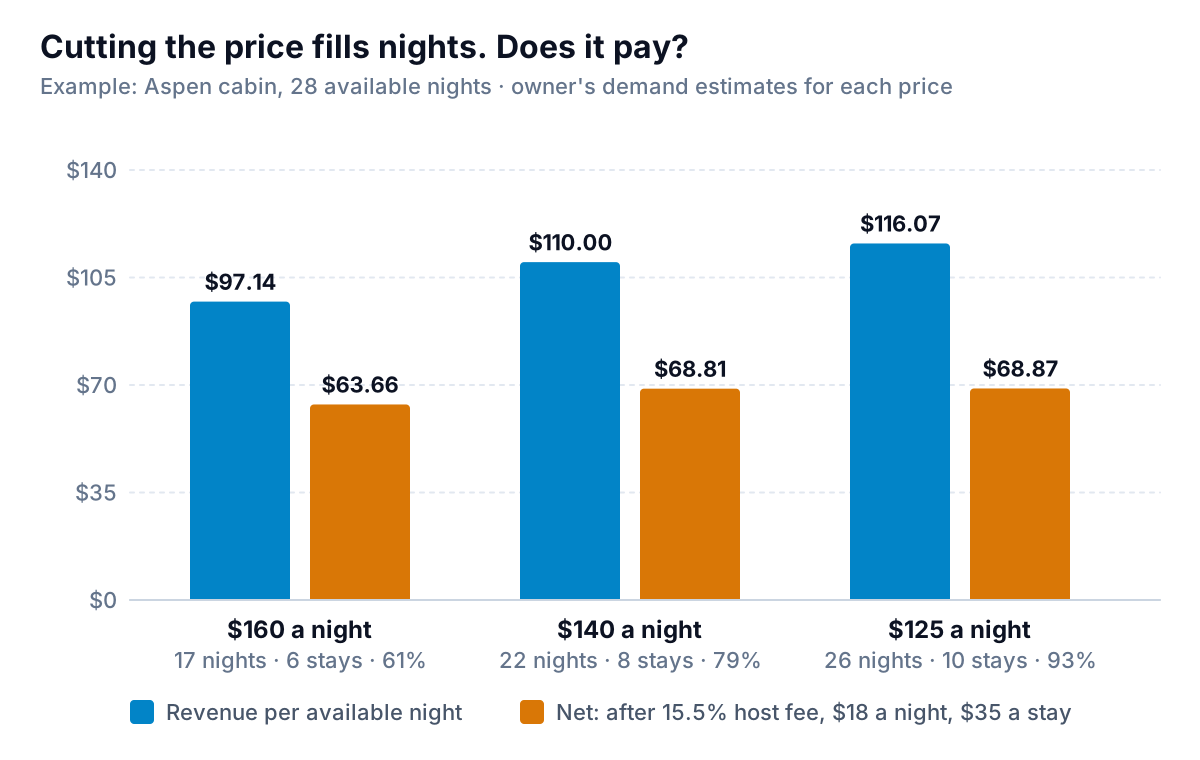
Dropping from $160 to $140 is worth doing on these estimates: revenue per available night rises from $97.14 to $110.00 and net from $63.66 to $68.81, about $144 more for the month. Dropping again to $125 pushes occupancy to 93% and revenue up another $170, yet net barely moves ($68.87), because the extra nights bring two more stays and more wear. Chasing occupancy past that point trades your time and your cabin's condition for nothing.
This is the same idea as contribution margin: judge a price by what's left after the costs it creates, not by the revenue it brings in.
Decision rules for when the occupancy rate moves
Compare each cabin with its own same month last year, and with similar listings nearby, before reacting. Then use rules like these. The thresholds are starting points for a small portfolio like Cedar Hollow's, not industry benchmarks; set your own from your costs.
| What you see | Likely cause | First move |
|---|---|---|
| Occupancy above about 85% of available nights, and peak nights sold out weeks ahead | Price is below what guests would pay | Raise the rate on the nights that sell first (weekends, holidays) by 5–10% and check next month's pace |
| Occupancy down, ADR flat or above similar listings | Price has drifted above the market, or the listing is losing search position | Check comparable listings' prices for the same dates; review photos, recent reviews and response time before cutting rate |
| Open nights are mostly one- or two-night gaps between stays | Minimum-stay rules are creating orphan nights | Lower the minimum for those check-in days; Airbnb lets you customise minimum nights by check-in day |
| Occupancy up, RevPAR and net per available night down | Discounts are filling nights that would have sold anyway | Shorten or shrink last-minute discounts; test one change at a time |
| Occupancy low only in one season | Seasonal demand, not a listing problem | Compare with the same month last year; consider longer-stay discounts for the quiet months rather than a lower base price all year |
Change one thing per cabin at a time and give it a few weeks of bookings before you judge it, otherwise you won't know which change worked. Our guide to Airbnb revenue management covers pricing by season, day of week and lead time, and how to measure a change properly.
A monthly occupancy report you'll actually keep up
The report that works is small: one row per property with available nights, booked nights, occupancy, ADR, RevPAR and net per available night, the same month last year beside it, and a short list of the open nights that need attention next month. Owner stays and repairs get their own column so nobody mistakes them for weak demand.
A spreadsheet handles this if you rebuild it every month from fresh exports. Parity does the rebuilding for you: upload your Airbnb earnings CSV, your other channels' exports and a sheet of owner blocks (or keep them all in Google Sheets and connect it), and it builds a dashboard with the headline numbers and their trends, charts by cabin, what explains the changes, and a table of what needs attention. Every number is checked against queries on the full dataset before you see it. You can refine it by chat ("exclude owner nights from available nights", "show net after a 15.5% fee"), share a read-only link with a co-owner, and update it next month with the newer file.
Upload your reservation exports and get a checked occupancy dashboard that counts available nights the right way. Build a report from your data free
Whichever tool you use, write down your formula once: booked nights ÷ (calendar nights − owner nights − maintenance nights). Keep minimum-stay gaps in as open nights. Then judge the result next to price, never on its own.