The general manager's report at Alpenglow Hotel, a 60-room ski-town hotel we'll use as an example, says March 2026 ran at 71.5%. Housekeeping's report says 71.0%. The figure that belongs in a budget or a lender's model is 70.0%. That's the standard hotel occupancy rate, the share of your available rooms that you sold: rooms sold ÷ rooms available × 100, or 1,302 ÷ 1,860 for Alpenglow's March.
All three numbers are "occupancy", and all three are correct for something. The differences come down to how you treat complimentary rooms and rooms that were out of order, and they matter as soon as you compare yourself with last year, your lender's model or the market. This guide shows how to calculate the hotel occupancy rate so it means one thing, what typical figures look like, and how to raise it on the nights where raising it actually pays.
The hotel occupancy rate formula, and its three versions
CoStar's STR benchmarking glossary, which most of the industry uses, defines occupancy as rooms sold divided by rooms available. Both inputs are measured in room nights: one room for one night.
- Rooms available = rooms in the hotel × nights in the period. Alpenglow: 60 × 31 = 1,860.
- Rooms sold = paid room nights. Alpenglow: 1,302.
Here's where March's 1,860 room nights went:
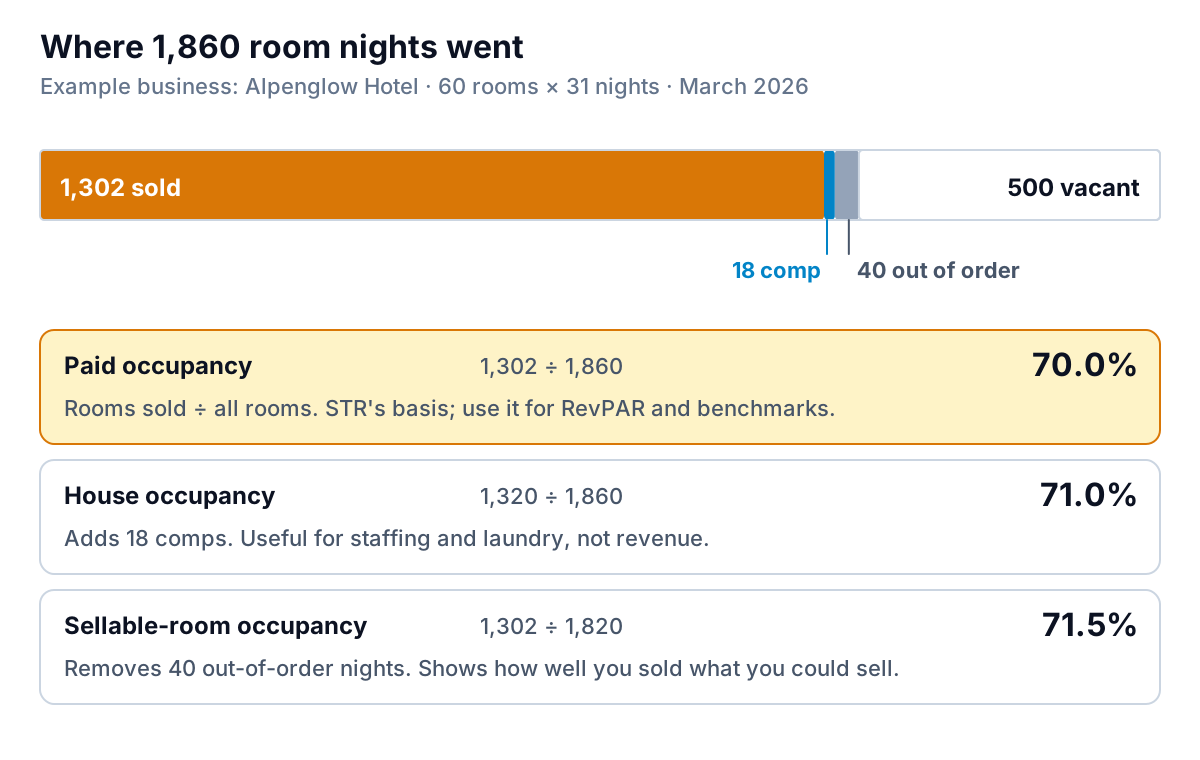
The three versions answer different questions:
- Paid occupancy (70.0%) is the standard one. Use it for RevPAR, budgets, lenders and any comparison with market data.
- House occupancy (71.0%) adds the 18 complimentary rooms. Those rooms still need cleaning, so it's the right figure for scheduling housekeepers and ordering linen.
- Sellable-room occupancy (71.5%) takes the 40 out-of-order room nights out of rooms available. It tells you how well you sold the rooms you could actually sell.
Out-of-order rooms: keep them in for reporting
Many online guides tell you to subtract out-of-order rooms from rooms available. STR's data reporting guidelines say the opposite: report the full room count × days, with no adjustment for rooms out of service for renovation for less than six months. Only rooms removed permanently, closed for an extended period (typically over six months), or a whole hotel closed for more than a calendar month get different treatment, and STR asks hotels to notify it in those cases.
The reason is practical. If broken rooms drop out of the denominator, a hotel with a maintenance backlog reports a higher occupancy than one that fixes things quickly. Keep the full count in your headline occupancy and RevPAR, and track out-of-order room nights as their own number. Many property management systems (PMS) also separate "out of order" (can't be sold) from "out of service" (a minor issue, still sellable); check how yours defines them before you trust its occupancy line.
Comps, no-shows and owner stays
The same guidelines settle the other edge cases. Complimentary rooms are not rooms sold. A guaranteed no-show is not a room sold either, even when you charge for it. Owner-occupied rooms are treated as complimentary. And day-use rooms, sold on the basis that nobody stays overnight, are kept out of rooms sold unless they're sold under one of your normal rate categories. Write these rules into your own month-end checklist so the number doesn't drift when staff change.
What a typical occupancy rate looks like
CoStar publishes U.S. figures each month. Across U.S. hotels, occupancy was 62.3% for full-year 2025, down 1.2% on 2024, and CoStar and Tourism Economics forecast 63.1% for 2026. The season moves it a lot:
| U.S. hotels (CoStar) | Occupancy |
|---|---|
| January 2026 | 52.4% |
| July 2026 | 69.7% |
| August 2026 | 66.4% |
Markets differ even more. In the same August 2026 release, San Francisco ran at 79.3% and New Orleans at 43.3%. A national average is useful context, but a ski hotel in March and a beach motel in March are in different businesses. The comparisons that tell you something are your own same month last year and, if you subscribe to a benchmarking service, your occupancy index against a competitive set of nearby hotels.
Read occupancy by night, not by month
A monthly 70.0% hides very different nights. Here's Alpenglow's March, night by night.
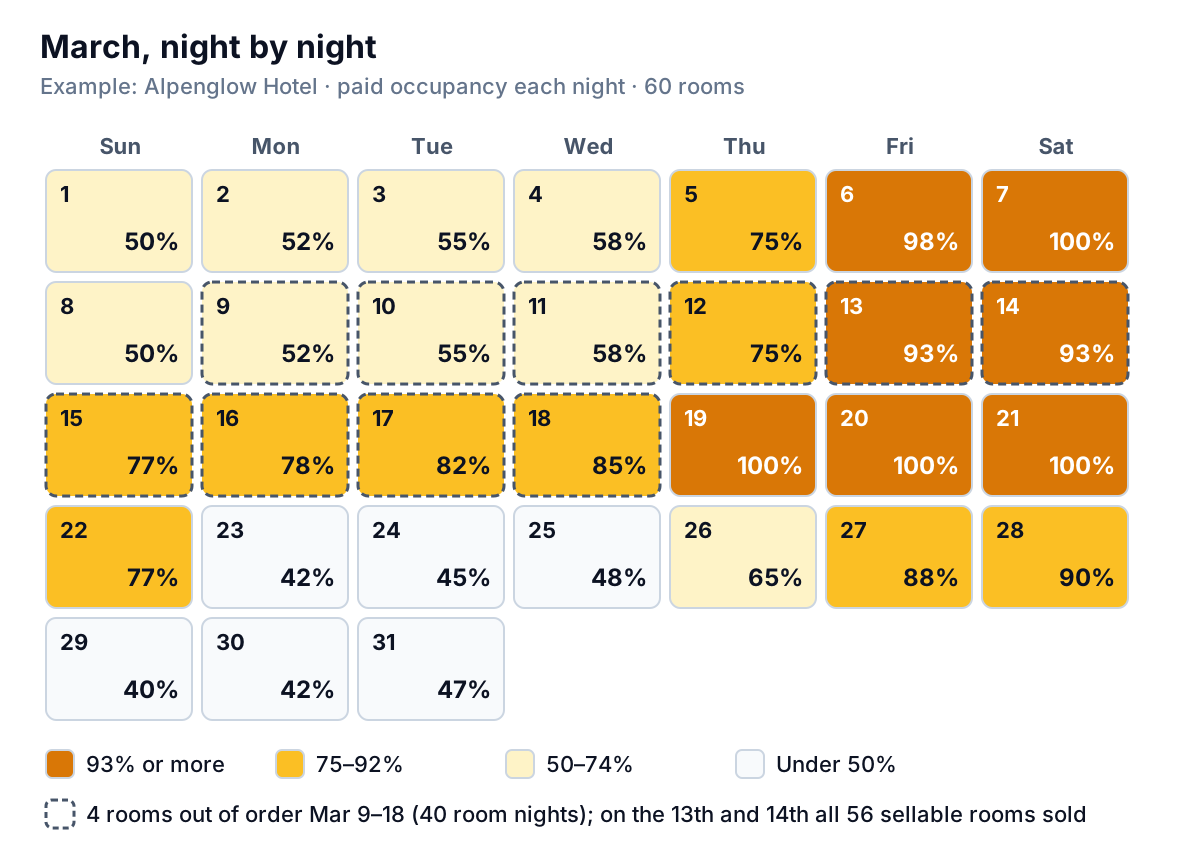
By night of the week, Alpenglow ran 95.0% on Fridays and 95.8% on Saturdays, 78.8% on Thursdays, and between 53.0% and 62.5% Sunday to Wednesday. Spring break week (March 15 to 21) averaged 88.8%. The last nine nights of the month averaged 56.3%, and the six weeknights among them averaged 43.9%.
Two things stand out. First, the out-of-order rooms cost real money. On March 13 and 14 the hotel sold all 56 rooms it could sell and turned guests away. With the four rooms back, and assuming they'd have sold at the weekend rate of $289 (an example figure), that's 8 room nights and $2,312 of lost room revenue. The repairs could have waited for the week of March 23. Second, late March is a volume problem, not a rate problem. Raising the weekend rate there won't help; filling Monday to Wednesday will.
How to increase hotel occupancy rate where it counts
Raising occupancy is worth doing on nights with empty rooms that someone would pay a fair price for. It isn't worth doing on nights that are already full, or by cutting the rate for everyone. Start with the diagnosis.
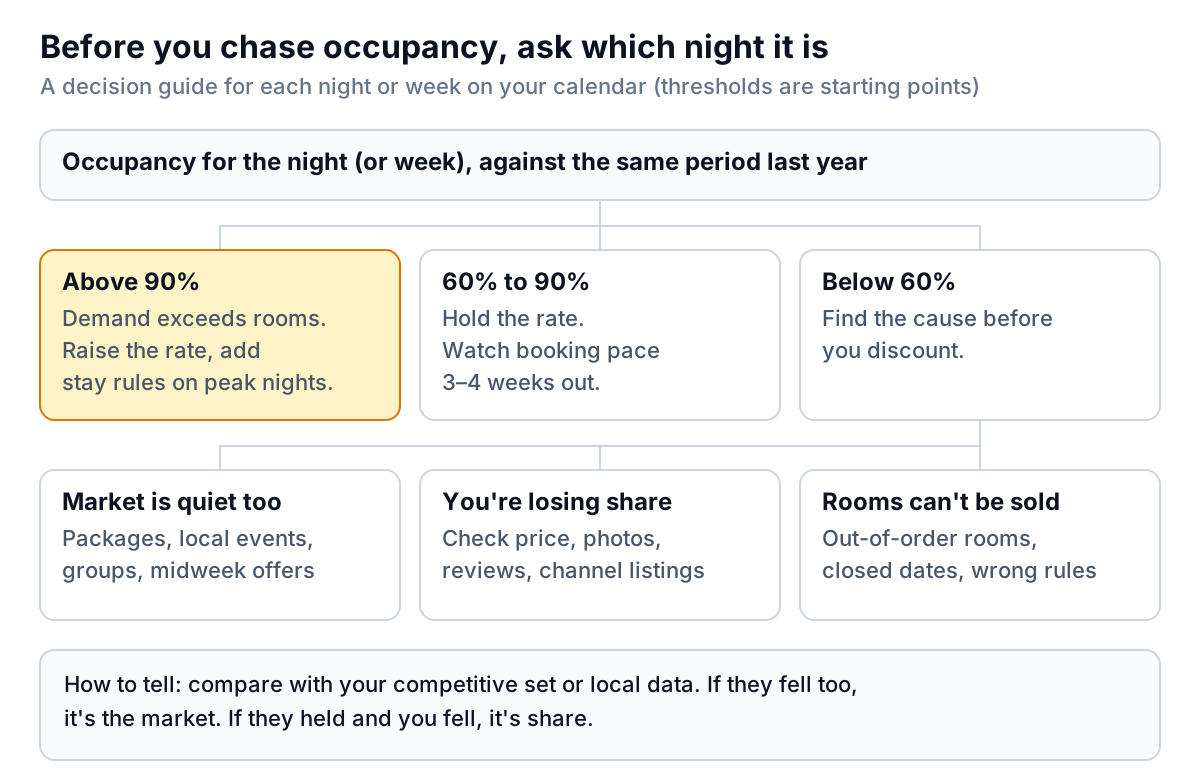
Then match the fix to the cause:
- Get every room sellable on peak nights. Schedule maintenance and deep cleans for your weakest nights. Review out-of-order rooms every morning and give each a return date. This raises paid occupancy without a single new guest.
- Check your stay rules. Minimum stays and closed-to-arrival settings are easy to leave on by mistake. A two-night minimum that made sense for spring break can block one-night bookings on a quiet Tuesday. Review rules on every date that's below 60% two weeks out.
- Build an offer for the empty nights only. A midweek package (lift tickets, a late checkout, a dinner credit at fair value) priced for Sunday to Wednesday arrivals reaches the guests who can come then without discounting your weekends. In the example, if a late-March midweek package added 8 rooms a night on those six weeknights, Alpenglow would sell 48 more room nights and March occupancy would rise from 70.0% to 72.6%.
- Go after midweek groups. Corporate retreats, ski clubs, wedding guests and work crews travel when leisure guests don't. A group rate below your public rate can still pay if it fills rooms that would have stayed empty; our guide on how to increase RevPAR shows how to work out the break-even before you quote.
- Fix the listing before the price. If nearby hotels are full and you aren't, check how you appear where guests book: photos, room descriptions, recent reviews, and whether your rates are the same on every channel. Then compare your price for the same dates.
- Watch booking pace. Compare rooms on the books for each future night with the same point last year. If you're behind three or four weeks out, act then; last-minute discounts reach fewer guests and train regulars to wait.
Each of these has a cost (package inclusions, commissions on extra OTA bookings, cleaning for every occupied room), so judge the result on room revenue and profit, not occupancy alone. Our hotel ADR guide covers what each extra booking adds to the rate side.
Mistakes that distort occupancy
- Mixing versions. Comparing this March's sellable-room occupancy with last March's paid occupancy. Pick one definition for reporting and label it.
- Counting comps as sold. They raise occupancy, add no revenue and drag ADR down.
- Averaging monthly percentages for the year. Add up rooms sold and rooms available for the twelve months and divide. Months have different numbers of nights, and a 28-night February shouldn't weigh the same as a 31-night March.
- Judging the month from the total. 70% can be a healthy month or a sold-out weekend and a dead week. Always look at nights.
- Chasing a benchmark. A national or market average isn't a target. Your own last year and your competitive set are.
Building an occupancy report from your PMS
Your PMS records everything needed. Most produce a daily manager's or night-audit report with rooms available, rooms sold, complimentary and out-of-order rooms, and occupancy for the day and month to date. Report names vary by vendor, so look for daily statistics or history reports and confirm how your system counts comps and out-of-order rooms.
For trends, export the daily history to CSV or Excel: one row per night with date, rooms available, rooms sold, comps, out-of-order rooms and room revenue. A spreadsheet pivot then gives you occupancy by month, by night of the week and against the same month last year. Add a column for out-of-order rooms on nights where every sellable room sold; that's your clearest cost of slow repairs. Alpenglow's March, at an example ADR of $248, came to $322,896 of room revenue and RevPAR of $173.60. Our operations dashboard guide covers what else belongs next to it on the page.
If you'd rather not keep the spreadsheet going, Parity builds the dashboard from that export. Upload the CSV or Excel file and it shows occupancy, ADR and RevPAR as headline numbers with their trends, charts by night and month, what explains each change, and a table of what needs attention, such as nights that sold every sellable room while rooms sat out of order. Every number is checked against queries on the full dataset before you see it. Refine it by chat ("show paid and house occupancy side by side"), share a read-only link with your owner or GM, and update it with next month's file. If you ask, it writes the monthly report from the same data. For a broader set of numbers, see our KPI dashboard guide.
Upload your PMS history and get a checked dashboard of occupancy, ADR and RevPAR by night, week and month. Build a report from your data free
Settle the definition once (paid rooms ÷ all rooms, comps and out-of-order nights reported on their own lines), then spend your time on the nights below 60%. That's where a higher hotel occupancy rate is worth the effort.