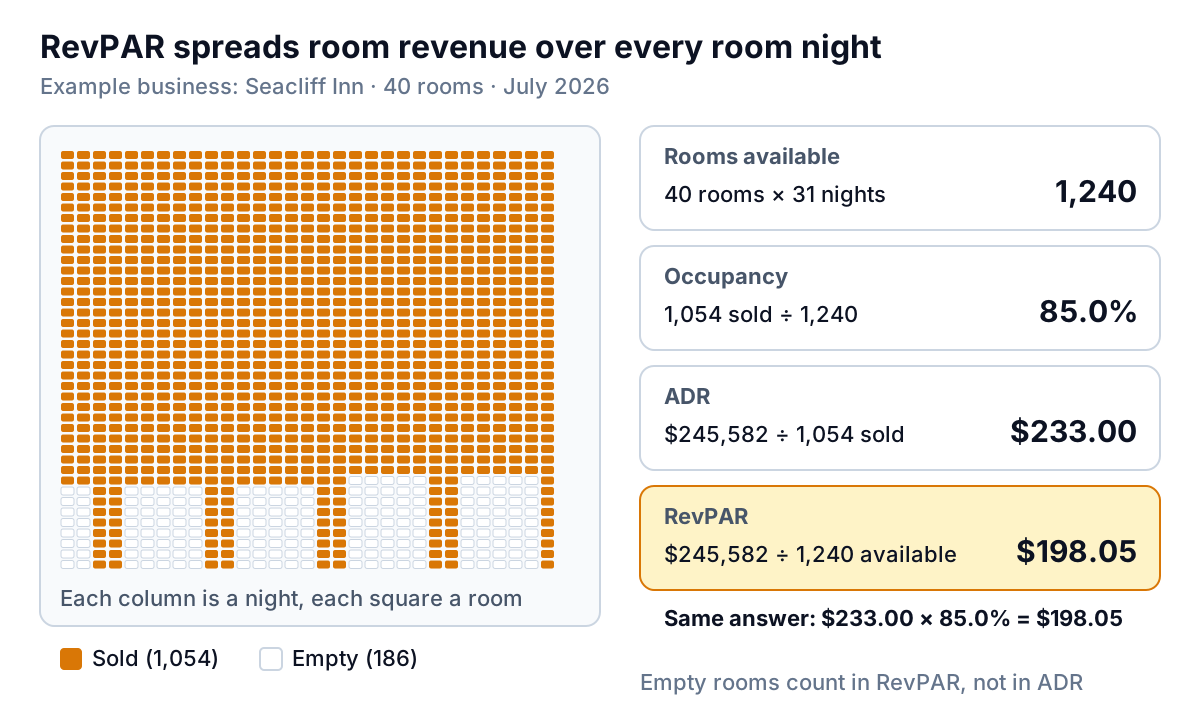
Seacliff Inn, a 40-room coastal inn we'll use as an example throughout, took $245,582 in room revenue in July 2026, which works out to $198.05 for every room it had to sell on every night of the month. That number is its RevPAR, revenue per available room: room revenue ÷ rooms available, which always equals ADR × occupancy.
The owner has two other numbers on her manager's report, occupancy (85.0%) and average daily rate ($233.00), and both looked fine. RevPAR is the one that tells her whether July was good, because it can't be flattered by filling rooms at any price or by holding a high rate over an empty building. This guide covers how to calculate RevPAR from your own reports, how it relates to occupancy and ADR, why seasonality makes a single month's figure misleading, and the mistakes that make RevPAR look better or worse than it is.
How to calculate RevPAR, step by step
You need three inputs for the period: room revenue, rooms sold and rooms available. CoStar's STR benchmarking glossary, the reference most of the hotel industry uses, defines occupancy as rooms sold divided by rooms available, and ADR as room revenue divided by rooms sold. RevPAR follows from those two.
- Rooms available. Rooms in the building × nights in the period. Seacliff: 40 × 31 = 1,240 room nights in July.
- Rooms sold. Paid room nights only. Seacliff sold 1,054.
- Room revenue. Revenue from renting rooms, net of taxes and refunds, without food, parking or resort fees. Seacliff: $245,582.
- RevPAR. $245,582 ÷ 1,240 = $198.05.
Check it the other way. Occupancy is 1,054 ÷ 1,240 = 85.0%. ADR is $245,582 ÷ 1,054 = $233.00. And $233.00 × 85.0% = $198.05. If the two methods don't agree on your own numbers, one of the inputs is wrong, usually rooms sold.
What counts as "room revenue" and "available"
Most RevPAR errors come from these two definitions, not from the division. STR's data reporting guidelines, which it says follow the hotel industry's uniform accounting system where possible, set the rules most benchmarks use:
- Room revenue is reported net of taxes, rebates, refunds and allowances.
- Only the room portion of a package counts. Breakfast, spa or golf inside a package rate comes out at fair market value.
- Resort fees are not room revenue. STR puts them in miscellaneous income.
- Rooms available is the full room count × days. Rooms out of service for renovation for less than six months stay in the count.
- Complimentary rooms are not rooms sold.
You can run your own reports however you like, but if you ever compare yourself with a market figure or a competitive set, use these rules or the comparison is off before you start. Our guide to ADR for hotels walks through the revenue side in detail (packages, comps, no-shows and online travel agency bookings), and the hotel occupancy rate guide covers out-of-order rooms.
RevPAR vs occupancy and ADR
Occupancy tells you how full you were. ADR tells you what the guests who came paid. RevPAR combines them, which is why owners and lenders use it as the headline: you can't raise it by giving rooms away, because ADR falls, and you can't raise it by pricing out half your guests, because occupancy falls.
But it hides how you got there. The same RevPAR can come from very different months.
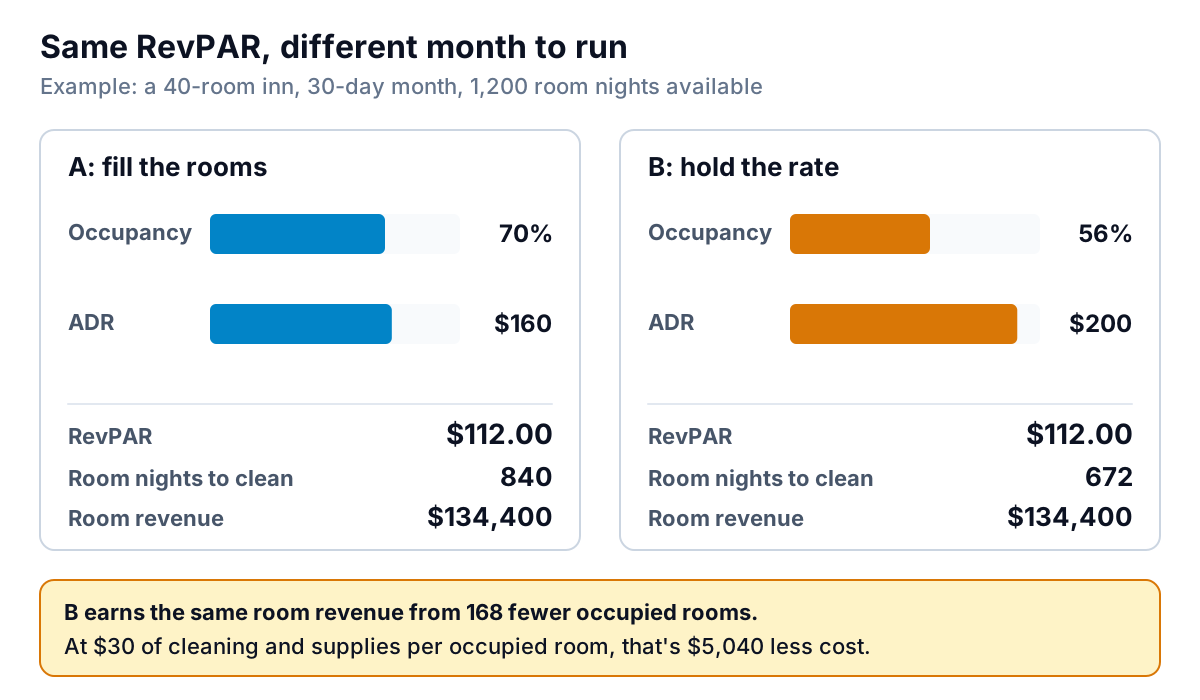
Both months bring in $134,400 of room revenue. Month B does it with 168 fewer occupied rooms, so less housekeeping, laundry, amenities and energy. Using $30 per occupied room as an example cost, that's $5,040 more profit for the same RevPAR. Month A has its own case: more guests means more breakfast covers, bar tabs and parking if you sell them, and more reviews. The point is that RevPAR alone can't choose between them. Read it next to occupancy and ADR every time, and if you're deciding which way to push, the how to increase RevPAR guide works through the cost of each lever.
A quick way to read a change in RevPAR is to split it. Seacliff's July RevPAR was up on last July. Was it rate or volume? If occupancy is flat and ADR is up 6%, RevPAR is up about 6% and the gain came from pricing. If ADR is flat and occupancy is up, you sold more rooms, and your costs went up with them.
Seasonality: why one month's RevPAR misleads
A seasonal inn is really several businesses sharing a building. Here is Seacliff's last twelve months.
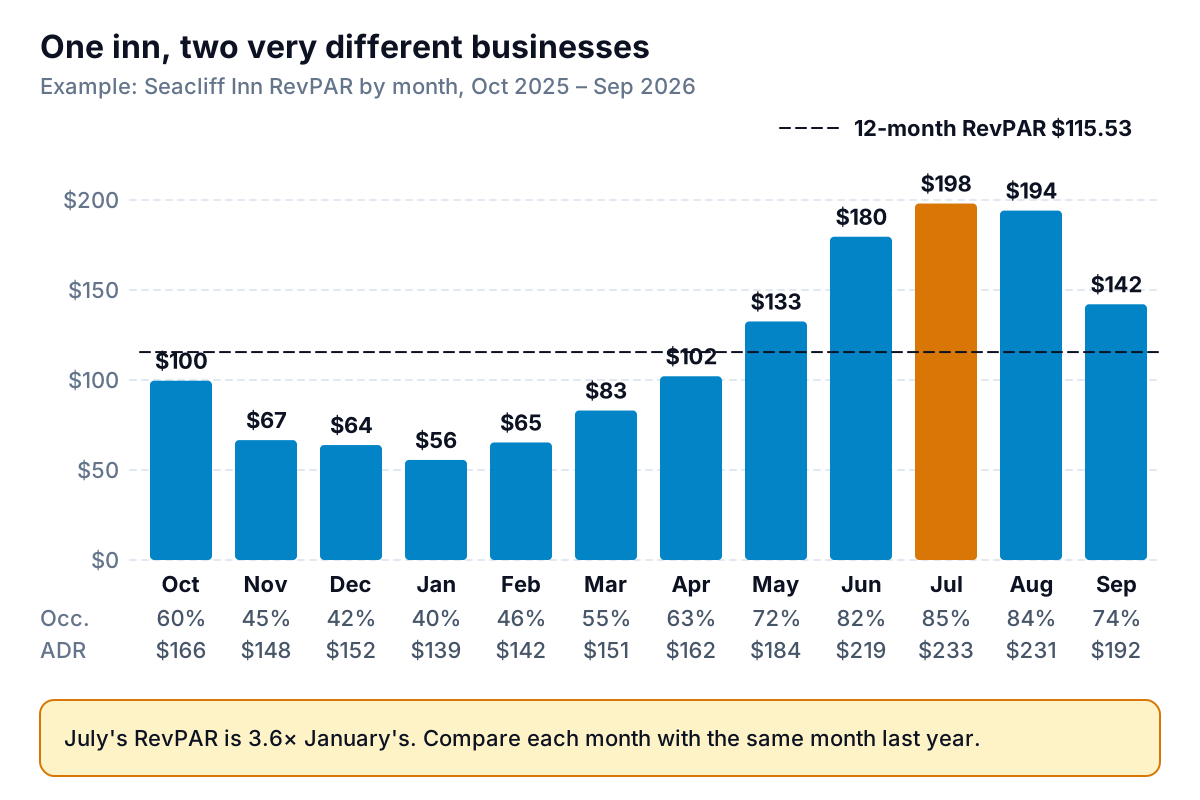
Three rules follow from a chart like this.
Compare a month with the same month last year, not with the month before. September always looks like a collapse next to August at Seacliff. What matters is whether this September beat last September.
Calculate the annual figure from totals, not averages. Over the twelve months Seacliff had 14,600 rooms available, sold 9,115 and took $1,686,732. Its 12-month RevPAR is $1,686,732 ÷ 14,600 = $115.53, with occupancy of 62.4% and ADR of $185.05. If you average the twelve monthly ADRs ($176.58) and the twelve occupancy rates (62.3%) and multiply them, you get $110.08, which understates the year by $5.45. The busy months have both more rooms sold and higher rates, and simple averages give a slow January the same weight as July.
Use a trailing twelve months for the trend. A rolling 12-month RevPAR moves slowly and ignores the season, so a fall in it is real news. Put it on the same page as the monthly figure so you see both.
The same pattern shows up in national data, flattened by the mix of city, airport and resort hotels. In CoStar's monthly releases, U.S. hotels recorded RevPAR of $79.69 in January 2026 (52.4% occupancy, $152.09 ADR) and $119.77 in July 2026 (69.7%, $171.74), a month CoStar linked partly to World Cup travel.
What's a good RevPAR?
There isn't a universal good number, because RevPAR depends on location, hotel type and season more than on management. A useful frame is the national figure, then your market, then the hotels you actually compete with.
| Period (CoStar, U.S. hotels) | Occupancy | ADR | RevPAR |
|---|---|---|---|
| Full year 2025 | 62.3% | $160.54 | $100.02 |
| January 2026 | 52.4% | $152.09 | $79.69 |
| July 2026 | 69.7% | $171.74 | $119.77 |
| August 2026 | 66.4% | $161.78 | $107.43 |
For 2025, CoStar reported the first full-year declines in U.S. occupancy and RevPAR since 2020, with RevPAR down 0.3%. In August 2026, CoStar and Tourism Economics raised their 2026 forecast to RevPAR growth of 4.4% for the year. Those are industry-wide U.S. figures from a sample CoStar says covers 95,000 properties and 12.2 million rooms worldwide. A 40-room seaside inn shouldn't expect to match them in any given month, in either direction.
The better benchmark is a competitive set: five or so hotels a guest would consider instead of yours. If you subscribe to a benchmarking service such as CoStar's STR Benchmark, it reports a RevPAR index, your RevPAR ÷ the set's RevPAR × 100. CoStar's glossary describes 100 as your fair share, above 100 as more than your fair share and below 100 as less. Here's an illustration with made-up competitor numbers:
| July 2026 (example) | Occupancy | ADR | RevPAR |
|---|---|---|---|
| Seacliff Inn | 85.0% | $233.00 | $198.05 |
| Competitive set | 80.0% | $225.00 | $180.00 |
| Index | 106.3 | 103.6 | 110.0 |
Seacliff took 10% more than its fair share, mostly from occupancy. That's the sort of month where the next move is usually rate: if you're fuller than the hotels around you at a similar price, you may be cheaper than guests would accept.
Mistakes that distort RevPAR
- Using total revenue. Room revenue only. If you want a figure that includes food, beverage and other income, that's total revenue per available room (often called TRevPAR), and it should be labelled as such.
- Leaving taxes and resort fees in. Occupancy tax collected for the city isn't yours. A resort fee might be, but it isn't room revenue under STR's rules, so leaving it in makes you look better than the market.
- Shrinking the room count. Taking out-of-order rooms out of "available" raises RevPAR without a dollar more revenue. Keep the full count for RevPAR, and track out-of-order nights separately.
- Counting comps as sold. Complimentary rooms add occupancy and no revenue, so they pull ADR down. Keep them out of rooms sold and report them on their own line.
- Averaging averages. As Seacliff's year shows, always rebuild a quarter or year from summed revenue and summed room nights.
- Treating RevPAR as profit. It says nothing about commissions, labour or the cost of cleaning a room. A booking from an online travel agency and a direct booking at the same rate add the same to RevPAR and very different amounts to your bank account.
Where the numbers live, and building a RevPAR report
Your property management system (PMS) already holds all three inputs. Most systems produce a daily manager's or night-audit report with rooms available, rooms sold, complimentary and out-of-order rooms, room revenue, occupancy, ADR and RevPAR for the day, month to date and year to date. Report names differ by vendor, so look for the daily statistics or history report, and check how your system handles comps and out-of-order rooms in its own RevPAR line.
For trends you need history, and most PMSs let you export daily statistics to CSV or Excel. A good monthly sheet has one row per night with date, rooms available, rooms sold, comps, out-of-order rooms and room revenue. From that you can build RevPAR by month, the same month last year and the trailing 12 months with nothing more than sums. Reconcile room revenue against the rooms revenue account in your accounting system once a month. If they differ, look for packages, taxes or adjustments posted in one and not the other. Our budget vs actual guide shows how to set this against a budget once the numbers agree.
If you'd rather not maintain the formulas, Parity builds a dashboard from that same export. Upload the daily statistics CSV or Excel file and it shows RevPAR, occupancy and ADR as headline numbers with their trends, charts by month, what explains each change, and a table of what needs attention, such as months where RevPAR fell while occupancy rose. Every number is checked against queries on the full dataset before you see it. You can refine it by chat ("compare each month with the same month last year", "add the trailing 12-month RevPAR"), update it with next month's export, and if you ask, it writes the monthly report for your partners or lender from the same data. Our KPI dashboard guide has more on choosing what goes on the page.
Upload your daily statistics and get a checked dashboard of RevPAR, occupancy and ADR, with each month next to last year. Build a report from your data free
Once a month, answer three questions from the numbers: was RevPAR up or down on the same month last year; was the change rate or occupancy; and did it beat the hotels around you? If you can answer all three, you know what to do next month.