The owner of Willow Creek Lodge, a 28-room mountain lodge we'll use as an example, had been telling her lender that the lodge got $242.98 a night. The real figure for September 2026 was $196.00. Average daily rate (ADR) is the average price paid for each room you sold: room revenue ÷ rooms sold, or $119,560 ÷ 610 for that month. It's the ADR hotel owners and managers quote when someone asks "what are you getting for a room?"
The division is the easy part. The $242.98 came from dividing everything posted to room folios that month, $148,216, by the same 610 rooms, a figure 24% too high. This guide covers what belongs in room revenue and what doesn't, why ADR moves even when you haven't changed a price, how ADR differs from RevPAR, and how to build an ADR report you can trust.
The ADR formula, with every input defined
CoStar's STR benchmarking glossary, which most of the industry works from, defines ADR as room revenue divided by rooms sold. Two definitions do all the work:
- Room revenue: what guests paid to rent rooms, after taxes, refunds and allowances, and without food, drink, parking or other extras.
- Rooms sold: paid room nights. A guest staying three nights is three rooms sold. Complimentary rooms are not rooms sold.
Willow Creek's September, as an example:
| Input | September 2026 |
|---|---|
| Rooms in the lodge | 28 |
| Rooms available (28 × 30 nights) | 840 |
| Rooms sold (paid) | 610 |
| Complimentary rooms | 14 |
| Room revenue | $119,560 |
| ADR ($119,560 ÷ 610) | $196.00 |
Note what the 14 complimentary rooms do. Divide room revenue by all 624 occupied rooms and ADR drops to $191.60. That's not a rate any guest paid, so keep comps out of the denominator and report them on their own line.
What's in and out of room revenue
STR's data reporting guidelines spell out the treatment of each item, and STR says they follow the industry's uniform system of accounts where possible. Even if you never send data to STR, using the same rules makes your ADR comparable with any market figure you read.
| Item | In room revenue? | Rooms sold? |
|---|---|---|
| Occupancy and sales taxes | No: room revenue is net of taxes | – |
| Package rate (room + breakfast, spa, golf) | Room portion only; the extras come out at fair market value | Yes |
| Resort fees | No: STR puts them in miscellaneous income | – |
| Mandatory service charge where the hotel is the principal | Yes | – |
| Guaranteed no-show charged to the guest | Yes | No |
| Cancellation and group attrition fees | No: miscellaneous income | No |
| Complimentary rooms (including owner stays) | No revenue | No |
| Prepaid online travel agency (OTA) bookings | Net amount the hotel receives | Yes |
| Pay-at-hotel OTA bookings | Gross; the commission is a rooms expense | Yes |
Two of those rows surprise people. No-show revenue counts but the room doesn't, so a month with many charged no-shows nudges ADR up. Willow Creek charged five no-shows a total of $1,030. Without it, ADR would be $194.31. And OTA bookings are recorded two ways depending on who takes the money, which matters when you compare channels (more on that below).
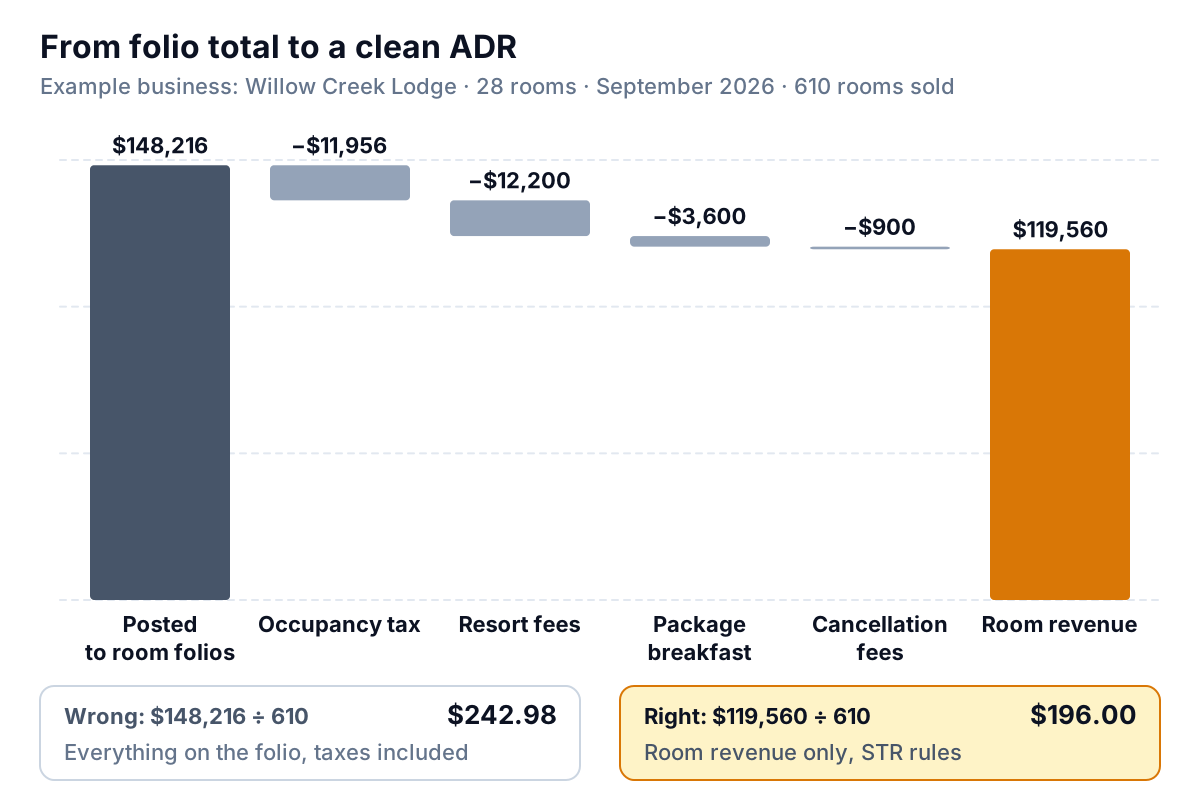
Willow Creek's corrections, line by line:
- Occupancy tax, $11,956. 10% of room revenue in this example. The tax collected belongs to the city or state, not the lodge. Rates and rules vary by location; check yours with your accountant.
- Resort fees, $12,200. $20 a night on 610 nights. It's real income for the lodge, but it isn't room revenue under STR's rules, and leaving it in makes Willow Creek look $20 more expensive than it is.
- Package breakfast, $3,600. The Stay & Breakfast package sold 120 nights at $260. Breakfast for two is worth $30 at the lodge's own menu prices, so $230 a night is room revenue and $30 goes to food and beverage.
- Cancellation fees, $900. Fees kept from guests who cancelled late. No room was sold, so the money isn't room revenue.
Why ADR moves when you haven't changed a price
ADR is an average of very different prices, so the ADR hotel managers see each month moves with the mix of business as much as with their rates.
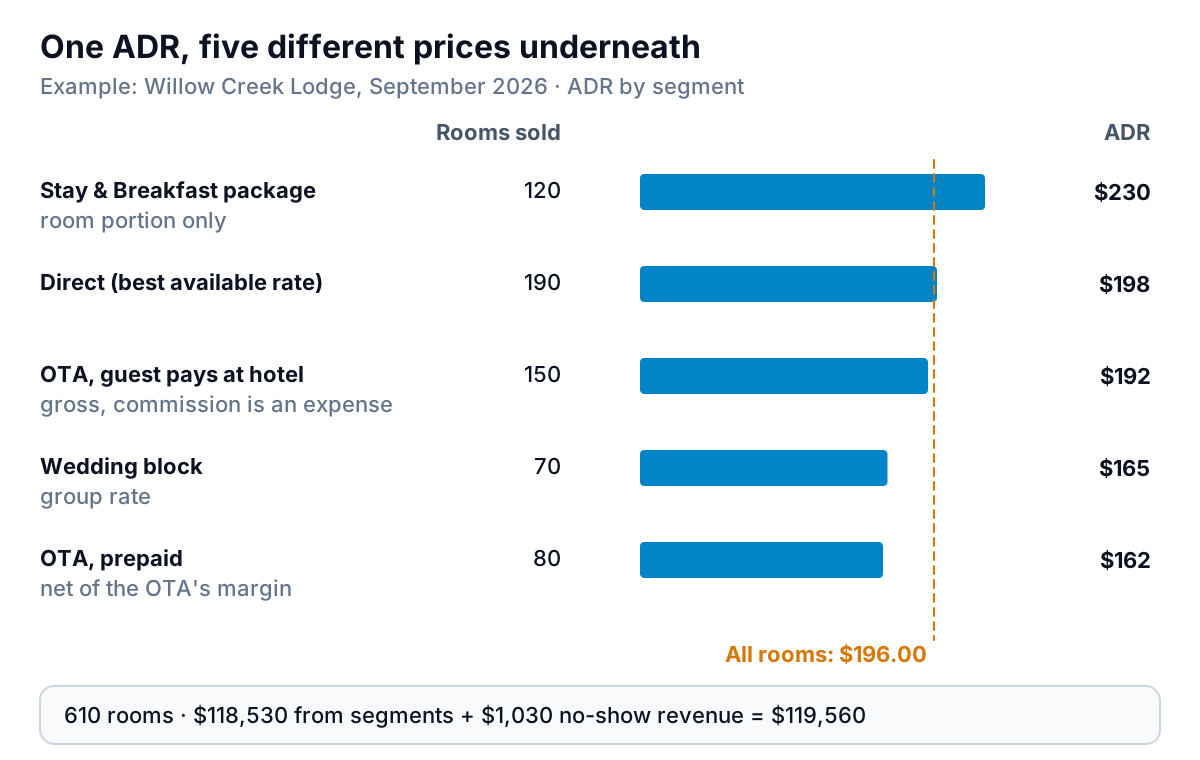
Suppose the 70-night wedding block had been in October instead, and those nights had sold at the lodge's direct rate. ADR would rise by about $3.80 with no price change at all. Move the 120 package nights into a slow month and September's ADR falls. Before you read a change in ADR as "we raised (or cut) prices", look at it by segment: rate code or market segment in your property management system (PMS). If the segment ADRs are flat and the total moved, the mix moved.
Channels need extra care because of the net-versus-gross rule. A prepaid OTA booking arrives already net of the OTA's margin, so it shows a low ADR ($162 here). A pay-at-hotel OTA booking shows the full price ($192) and the commission lands later as an expense. To compare what each channel actually leaves you, take the commission off the gross ones. At an 18% commission (an example; your contract sets the real rate), $192 becomes $157.44, which is less than the prepaid channel's $162. Neither is wrong, but you can't put them side by side without the adjustment.
ADR vs RevPAR: which one to watch
ADR measures price on the rooms you sold. RevPAR, revenue per available room, spreads the same room revenue over every room you could have sold: room revenue ÷ rooms available, or ADR × occupancy. Willow Creek's September RevPAR was $119,560 ÷ 840 = $142.33, from an ADR of $196.00 and occupancy of 72.6%. Our RevPAR guide covers the calculation and seasonality in depth, and the hotel occupancy rate guide covers the other half of the formula; what matters here is how the two numbers disagree.
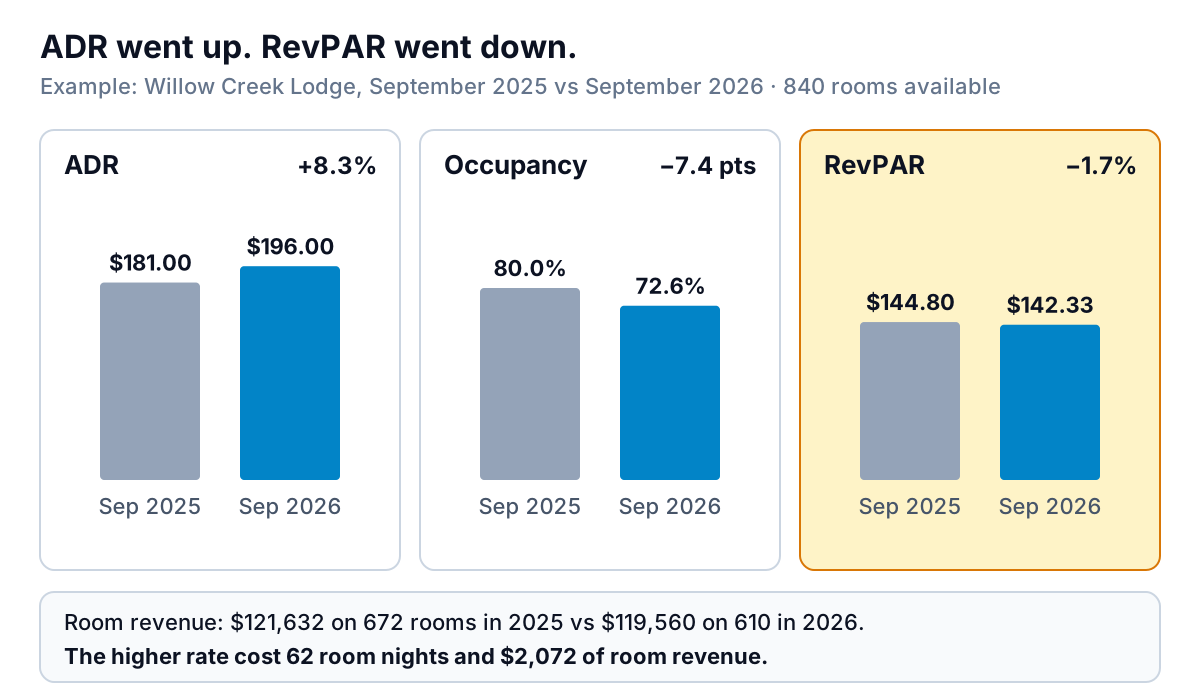
The lodge raised rates this year. ADR went from $181.00 to $196.00, up 8.3%. Occupancy fell from 80.0% (672 rooms) to 72.6% (610 rooms), and room revenue fell by $2,072. Reported on its own, the ADR line says the price rise worked. RevPAR says it cost a little revenue.
Profit is a third answer. The lodge cleaned 62 fewer rooms. At an example $32 per occupied room for housekeeping, laundry and amenities, that's $1,984 of cost avoided, so profit is nearly unchanged. The decision rules that come out of this:
- ADR up, RevPAR up: the rate rise held. Try the next step on your busiest nights first.
- ADR up, RevPAR down, and the room revenue lost is less than the cost of the rooms you didn't sell: roughly a wash. Look at which nights lost occupancy; it's usually midweek or shoulder dates, where a lower rate may win them back.
- ADR up, RevPAR down, and the revenue lost is more than that: you priced past what guests would pay. Pull back on the dates that emptied.
- ADR down, occupancy up: only worth it if RevPAR rose by more than the extra cost of the occupied rooms and the commission on any OTA bookings.
The working of those trade-offs, with the cost of each lever, is in our guide to how to increase RevPAR.
ADR hotel benchmarks: what to compare yours with
CoStar publishes U.S. figures monthly. U.S. hotels averaged an ADR of $160.54 for full-year 2025, up 0.9% on 2024, and $161.78 in August 2026. The August release also shows how wide the spread is between cities: New York City's ADR was $275.07 and San Francisco's $216.77 that month. In August 2026, CoStar and Tourism Economics forecast U.S. ADR growth of 3.1% for the full year.
Use those for context, not as targets. When you look for an ADR hotel benchmark, the closer it is to your own location, size and type of guest, the more it tells you. A national ADR mixes airport hotels, city towers and roadside motels, and it changes with the season. Three better comparisons, in order:
- Same month last year, same segment. Free, and it strips out the season and most of the mix.
- Your competitive set. If you subscribe to a benchmarking service such as CoStar's STR Benchmark, it reports an ADR index against a set of nearby hotels you choose; 100 means you charge the same on average.
- Public rates for the same dates. Check what your four or five closest competitors show on booking sites for a busy Saturday and a quiet Tuesday a few weeks out. Note it monthly so you have a trend.
Building an ADR report you can trust
Your PMS holds the inputs. Most produce a daily manager's or night-audit report with rooms sold, complimentary rooms, room revenue and ADR, and a revenue report by rate code or market segment. Before relying on the PMS's own ADR line, check three settings: whether it excludes comps from rooms sold, whether package components are split out of room revenue, and whether resort fees post to a separate revenue code. Names and options differ by system, so check your vendor's documentation.
For a month-by-month view, export two files: daily statistics (rooms sold, comps, room revenue) and revenue by segment. A spreadsheet with a pivot by month and segment gives you ADR by segment, the mix of nights, and the same month last year. Reconcile the month's room revenue against the rooms revenue account in your accounting system; a gap usually means packages, taxes or allowances are posted differently in the two. If you track costs per occupied room, our contribution margin guide shows how to judge each segment on what it leaves after variable costs.
Parity can do the build for you. Upload the PMS export as a CSV or Excel file and it builds a dashboard with ADR, occupancy and RevPAR as headline numbers with their trends, charts by month and segment, what explains each change (rate or mix), and a table of what needs attention, such as segments whose ADR fell year over year. Every number is checked against queries on the full dataset before you see it. Ask in chat for "ADR excluding comps" or "pay-at-hotel OTA net of 18% commission" and it updates, with versions you can undo. If your costs are in QuickBooks Online, you can connect it and build a second dashboard for cost per occupied room. Our sales report guide covers the monthly write-up that sits on top.
Upload your PMS export and get a checked dashboard of ADR by month and segment, next to occupancy and RevPAR. Build a report from your data free
Whatever you use, write your rules down once: taxes out, resort fees out, packages at the room portion, comps and no-show rooms out of rooms sold. Then every ADR you quote, this month and next year, means the same thing.