Every September, the owner of Pennant Toy Co., an example business we'll use throughout this guide, draws on the line of credit to pay the factory for the holiday range. The toys sell to independent shops in October and November. The shops pay in December and January. By February the line is clear again, and the owner wonders whether it has to be this way every year.
The number that answers that is the cash conversion cycle: how many days pass between paying for stock and getting paid for it. At Pennant it's 125 days. This guide shows how to calculate it from a small business's books, step by step, what each day is worth in dollars, and which changes shorten it the most.
What the cash conversion cycle measures
The cash conversion cycle (CCC) counts the days your own cash is tied up in each round of trading. It adds the time stock sits before it's sold and the time customers take to pay, then subtracts the time your suppliers let you wait before you pay them:
CCC = DIO + DSO − DPO
- DIO, days inventory outstanding: average inventory ÷ cost of goods sold × 365. How long stock sits before it's sold.
- DSO, days sales outstanding: average receivables ÷ sales × 365. How long customers take to pay.
- DPO, days payables outstanding: average payables ÷ cost of goods sold × 365. How long you take to pay suppliers.
That's the standard form you'll find in references such as Corporate Finance Institute's. Inventory and payables are divided by cost of goods sold because they're carried at cost. Receivables are divided by sales because invoices include your margin. Mixing them up is the most common calculation error.
A shorter cycle means each dollar of sales needs less cash behind it. A negative cycle, where customers pay before you pay suppliers, means suppliers are funding your stock. Subscription businesses paid upfront and some retailers with fast-selling stock manage this. Most product businesses that sell on credit don't.
Worked example: Pennant Toy Co.'s cash conversion cycle
Pennant designs toys, has them made by an overseas factory on 45-day terms, and sells them to independent toy shops on 30-day terms. Here are the inputs for 2025:
| Input | Where it comes from | Jan 1, 2025 | Dec 31, 2025 | Average or total |
|---|---|---|---|---|
| Inventory | Balance sheet | $540,000 | $612,000 | $576,000 |
| Accounts receivable | Balance sheet | $330,000 | $390,000 | $360,000 |
| Accounts payable | Balance sheet | $176,000 | $208,000 | $192,000 |
| Sales | Profit and loss | $2,920,000 | ||
| Cost of goods sold | Profit and loss | $1,752,000 |
Then the three parts:
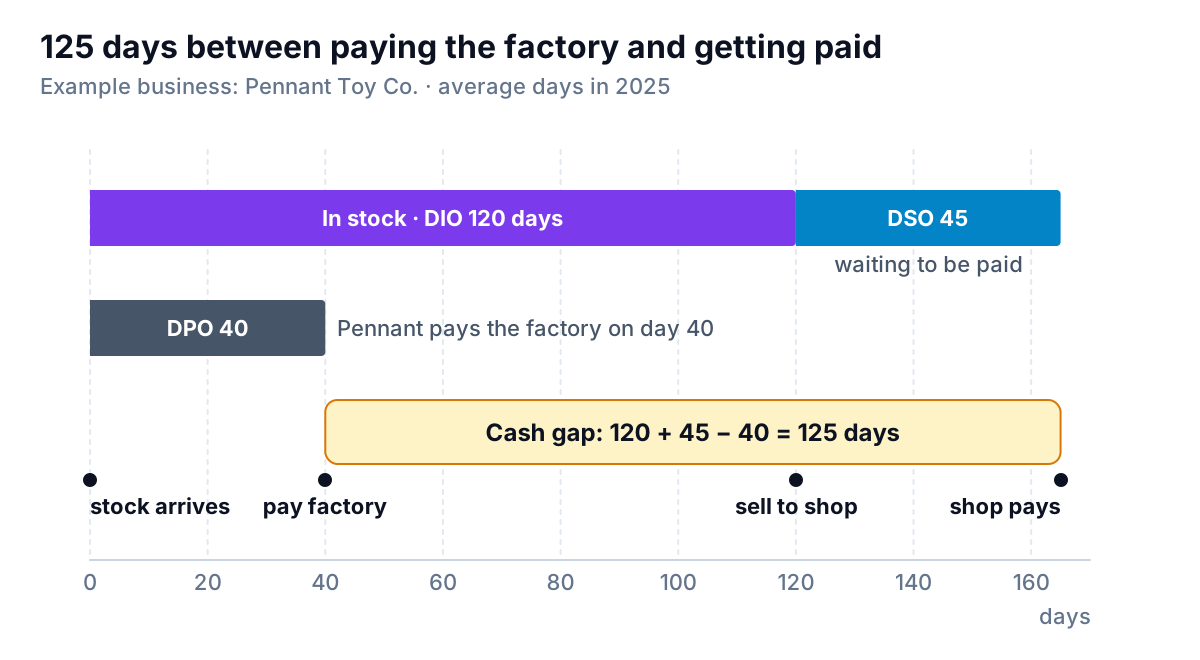
- DIO = $576,000 ÷ $1,752,000 × 365 = 120 days. Toys sit in the warehouse for four months on average.
- DSO = $360,000 ÷ $2,920,000 × 365 = 45 days. Shops on 30-day terms pay, on average, 15 days late.
- DPO = $192,000 ÷ $1,752,000 × 365 = 40 days. Pennant pays the factory five days early on its 45-day terms.
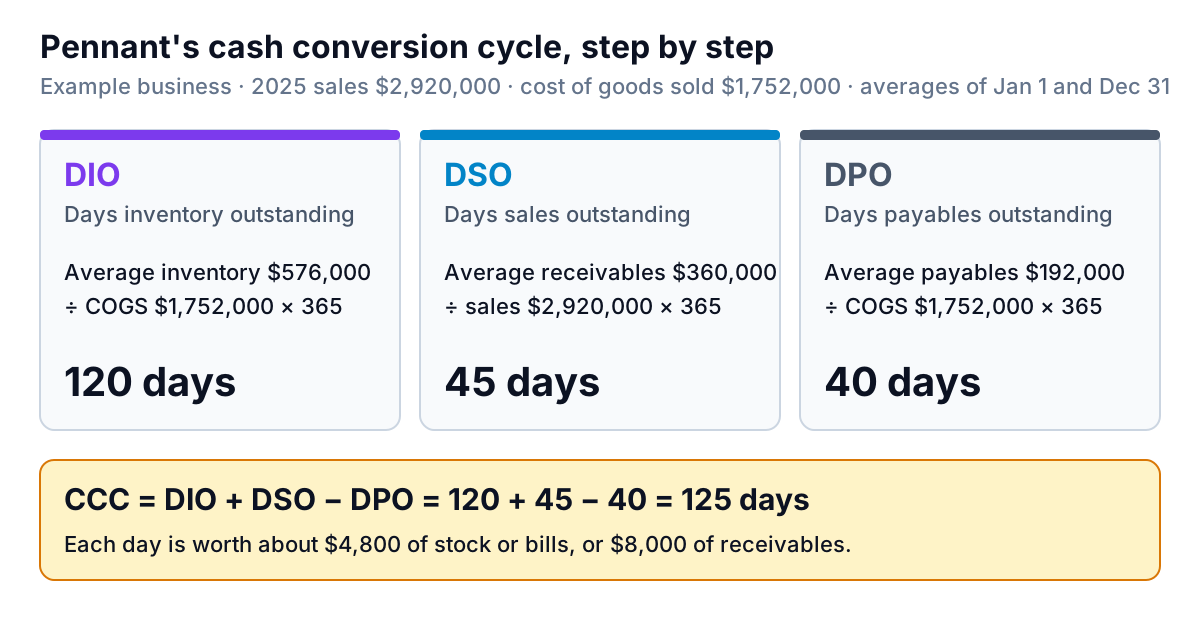
CCC = 120 + 45 − 40 = 125 days.
Laid out as a timeline, the meaning is clearer. The factory gives Pennant 40 days of credit in practice. After that, Pennant's own money is out for the rest of the 120 days the toys sit in stock and the 45 days the shops take to pay.
What each day is worth
Days become useful when you turn them into dollars. Pennant sells $8,000 a day on average ($2,920,000 ÷ 365) and its cost of goods sold is $4,800 a day ($1,752,000 ÷ 365). So:
- One day less of inventory frees about $4,800.
- One day faster collection frees about $8,000.
- One day longer to pay suppliers keeps about $4,800 in the bank.
Those are one-off amounts. Shorten the cycle by ten days and the cash comes back once and stays back, as long as the new habit holds. It's the same cash you'd otherwise borrow every September.
Getting the inputs from QuickBooks, Xero or a spreadsheet
- QuickBooks Online: run the Balance Sheet Comparison for opening and closing inventory, receivables and payables, and the Profit and Loss for sales and cost of goods sold over the same period. If you track inventory in QuickBooks, the Inventory Valuation Summary breaks the inventory figure down by product, which you'll need for fixing DIO.
- Xero: the Executive Summary report calculates "Average debtor days" (receivables ÷ sales × days in period) and "Average creditor days" (payables ÷ cost of goods sold × days in period). Those are DSO and DPO. Xero uses the balance at the report date, not an average, so its figures can differ from yours. Inventory days you work out yourself from the Balance Sheet and Profit and Loss.
- A spreadsheet: with average inventory in B2, receivables in B3, payables in B4, sales in B5 and cost of goods sold in B6, the cycle is
=B2/B6*365 + B3/B5*365 - B4/B6*365. For a quarter, replace 365 with the number of days in the quarter and use that quarter's sales and costs.
How to shorten the cash conversion cycle
Each part of the formula has its own levers. Here's what realistic targets would release at Pennant.
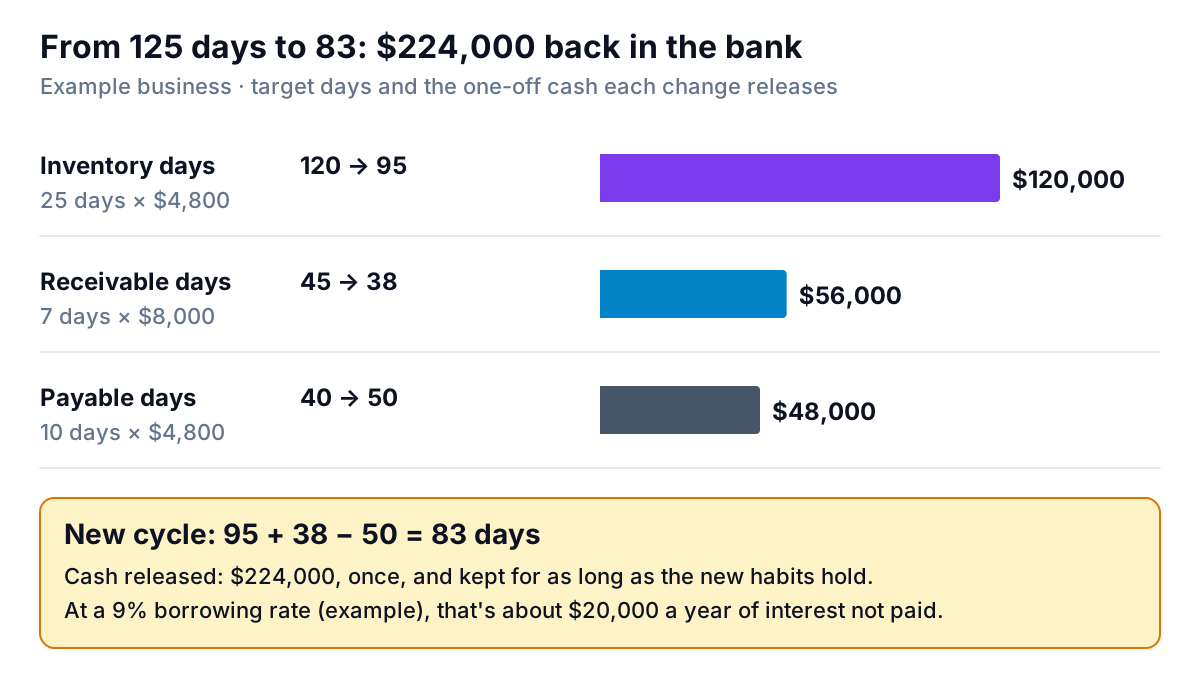
Inventory: 120 days to 95 frees $120,000
- Rank products by days of stock on hand. Often a handful of lines hold most of the slow stock. Our inventory dashboard guide shows how to find them.
- Split the factory order: part in early summer for the core range, part later for lines whose sell-through you've seen.
- Clear last year's slow lines before the new range arrives, even at cost. Cash from a discounted sale beats stock that ages another year.
Receivables: 45 days to 38 frees $56,000
- Invoice on the day of shipment, not in a batch at month end. If shipments are spread through the month, a month-end batch adds about two weeks on average before the 30 days even start.
- Chase on day 31, not day 60. An accounts receivable aging report sorted by days late shows which shops to call first.
- Offer card or online payment for small accounts. Card payments settle quickly; Stripe, for example, lists two business days for US accounts. Weigh the fee against the days saved.
Payables: 40 days to 50 frees $48,000
- Pay on the due date, not when the bill arrives. Pennant pays five days early on 45-day terms for no reason.
- Ask the factory for longer terms when you're a reliable, growing customer. Five extra days is a modest ask.
- Never stretch past the due date. Late payment can cost you terms, priority in the factory's busy season and goodwill.
Together, Pennant's three changes cut the cycle to 95 + 38 − 50 = 83 days and release $224,000. At a 9% borrowing rate, used here as an example, that's about $20,000 a year of interest the business no longer pays.
Mistakes that distort the number
- Using closing balances for a seasonal business. Pennant's December 31 balances are its highest of the year. With closing balances instead of averages, the cycle comes out at 133 days, not 125. Pick one method and stick with it, and for a seasonal business, calculate it quarterly as well.
- Ignoring deposits paid to suppliers. If you pay a factory a deposit when you place the order, your cash leaves weeks before the stock arrives. The standard formula doesn't see it. Add the deposit period to your own version if it's material.
- Including cash sales in DSO. If half your sales are paid at the counter, dividing receivables by all sales makes your credit customers look faster than they are. Use credit sales only when you can.
- Comparing yourself with big companies. Published figures for large companies reflect buying power and payment terms a small business rarely has. Compare yourself with your own past and with businesses your size.
- Chasing the number alone. You can shorten DIO by running out of stock. Watch lost sales and stock-outs alongside it.
For an outside comparison, ProSight Statement Studies publishes days' receivables, days' inventory and days' payables by industry from small and medium-sized bank borrowers' statements. Its definitions note that the figures use year-end balances and don't account for seasonal swings, so compare your year-end figure with them, not your average.
How the cycle fits with the other numbers
The cash conversion cycle measures time. Working capital measures the dollars that time ties up, and a longer cycle means more working capital for the same sales. The current ratio and quick ratio measure whether you could pay this year's bills from what you hold. A business can have a comfortable current ratio and a long, slow cycle at the same time, because stock and receivables count fully in the ratio however long they take to turn into cash.
Track all of them monthly in one place, and the cycle stops being a once-a-year surprise. Parity builds that view from your data: connect QuickBooks Online, or upload your balance sheet, P&L and inventory exports from Xero, Shopify or any other tool as CSV or Excel. It builds a dashboard with the headline numbers and their trends, charts, what explains them and a table of what needs attention, such as the products with the most days of stock or the shops paying slowest. Every number is checked against queries on the full dataset before you see it. Ask by chat for "DIO, DSO and DPO by quarter for the last two years" and refine from there.
Upload your balance sheet, P&L and stock list and get a checked dashboard of your cash conversion cycle and what's driving it. Build a report from your data free
Pennant will still draw on the line of credit next September. With an 83-day cycle instead of 125, it will draw less, repay sooner, and pay the factory on time without watching the bank balance every morning.