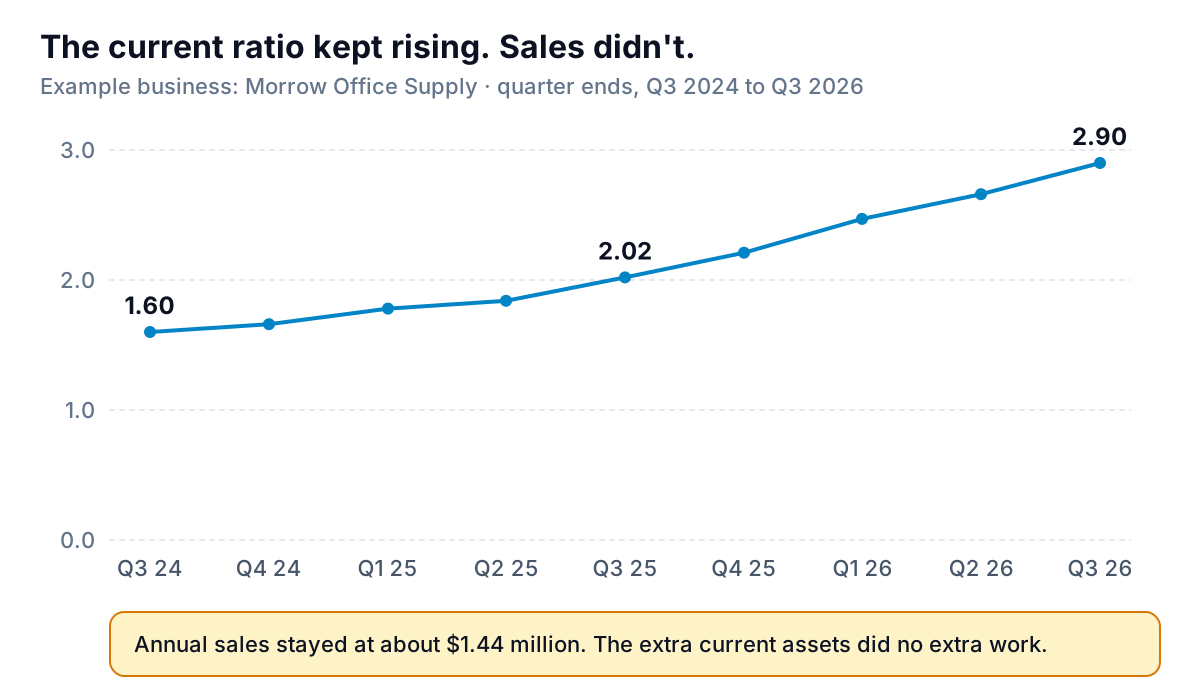
When Morrow Office Supply renewed its bank loan this autumn, the banker had one comment on the balance sheet: a current ratio of 2.90, up from 1.60 two years earlier. "Very comfortable," he said. The owner of the example business we'll follow here took it as praise. Her accountant read the same number as a question: why had the ratio nearly doubled while sales hadn't grown at all?
Both were right, and that's the trouble with the current ratio. A low one can warn you that bills are about to outrun cash. A high one can mean safety, or it can mean money sitting in slow invoices, dusty stock and an idle bank account. This guide covers the formula, what a good current ratio looks like for different kinds of business, how to read a high one, and where it misleads.
The current ratio formula, worked through
Current ratio = current assets ÷ current liabilities
Current assets are cash and what you expect to turn into cash within a year: receivables, inventory and prepaid expenses. Current liabilities are what you owe within a year: supplier bills, payroll and sales tax owed, anything drawn on a line of credit, and the next twelve months of loan repayments. Both totals are on your balance sheet.
Here's Morrow, which sells office supplies, furniture and printer consumables to local businesses and schools on 30-day terms, at two dates two years apart:
| Line | Sep 30, 2024 | Sep 30, 2026 |
|---|---|---|
| Cash | $45,000 | $140,000 |
| Receivables | $120,000 | $162,000 |
| Inventory | $135,000 | $205,000 |
| Prepaid expenses | $6,000 | $7,000 |
| Current assets | $306,000 | $514,000 |
| Supplier bills | $110,000 | $118,000 |
| Payroll and sales tax owed | $25,000 | $27,000 |
| Line of credit | $40,000 | $0 |
| Loan repayments due within a year | $16,000 | $32,000 |
| Current liabilities | $191,000 | $177,000 |
| Current ratio | 1.60 | 2.90 |
So in 2024, Morrow had $1.60 of current assets for every $1 due within a year; in 2026, $2.90. Sales in both years were about $1.44 million.
What's a good current ratio? It depends on how fast your assets turn into cash
The current ratio treats every current asset as equal. In practice, a dollar in the bank pays a bill today, a dollar of receivables pays one in a month or two, and a dollar of slow stock may never pay one. So the ratio a business needs depends on how quickly its assets turn into cash compared with how quickly its bills fall due.
| Kind of business | How cash comes in | What that means for the ratio |
|---|---|---|
| Café, salon, takeaway | Paid at the till; little stock; suppliers give some credit | Can often run at or below 1.0, because cash arrives every day |
| Agency, consultancy | Invoices monthly; almost no stock | Needs receivables to cover payroll; a ratio near 1.0 leaves little room |
| Distributor, wholesaler, shop with deep range | Months of stock, then 30-day invoices | Needs a higher ratio, because a large part of current assets is stock |
| Contractor | Progress payments, retainage held back | Needs headroom for lumpy collections |
For rough ranges, Xero's guide to the current ratio suggests 1.5 to 3.0 for most small businesses, with lower typical ranges for food service and professional services than for construction. Treat that as a rule of thumb from an accounting software company, not a measured benchmark.
For a measured one, use ProSight Statement Studies, which publishes ratios by industry from the financial statements of small and medium-sized bank borrowers. Its guide to the ratios shows each as a median with upper and lower quartiles, and stresses that "the composition and quality of current assets are critical factors" in judging liquidity. That last point is the whole story at Morrow.
Why a high current ratio is also a signal
A current ratio that climbs while sales stay flat means more money is sitting in current assets to support the same business. Morrow's accountant broke the $514,000 down by how hard each part was working.
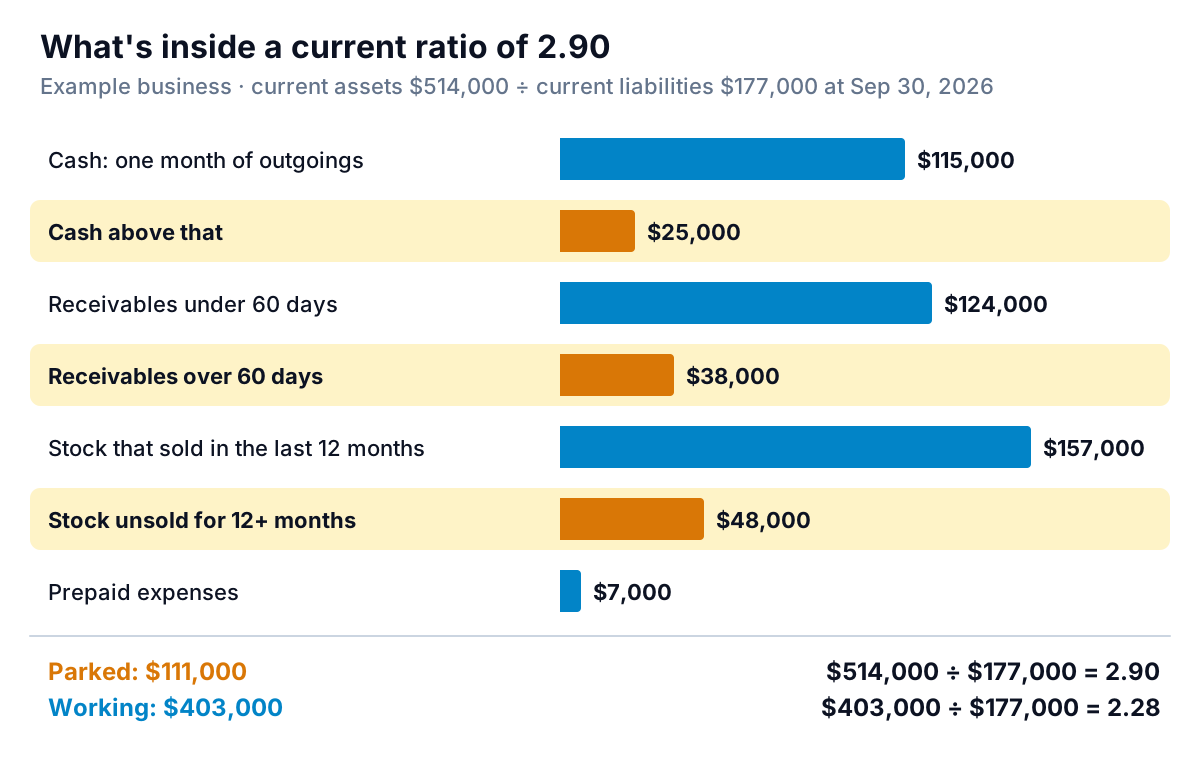
Three things had happened, and none of them showed up as a problem on the profit and loss report:
- Customers were paying more slowly. Receivables rose from $120,000 to $162,000 on the same sales, from about 30 days of sales to about 41. Most of the increase was two school accounts and a handful of offices paying past 60 days.
- Stock had piled up. Inventory went from about 46 days of cost of sales to about 69. $48,000 of it, mostly toner for printers the customers no longer own and a range of desk chairs, hadn't sold in a year. Our inventory dashboard guide shows how to spot that by product.
- Cash was sitting idle. After paying off the line of credit, the business still held $140,000 against monthly outgoings of about $115,000, while paying interest on a term loan. That might be a sensible cushion or an expensive one; it's a decision to make on purpose.
Xero's guide makes the same point in general terms: a ratio above 3.0 "might mean you're holding too much idle cash or inventory." There's nothing magic about 3.0. The signal is a ratio rising faster than the business is growing.
Getting the current ratio from your books
- QuickBooks Online: run the Balance Sheet from Reports, then Standard reports. Divide Total Current Assets by Total Current Liabilities. On QuickBooks Online Advanced, the Performance center can chart the current ratio over time. Our QuickBooks balance sheet guide lists the lines to check first.
- Xero: the Executive Summary report shows "Current assets to liabilities". Xero's notes say it counts accounts of the Current Asset, Prepayment and Bank types, and that bank accounts with a credit balance are treated as current assets. In other words, an overdrawn account reduces current assets rather than adding to liabilities, so the figure can differ slightly from your own calculation.
- A spreadsheet:
=B10/B20, where B10 is total current assets and B20 total current liabilities. Keep one row per month end so you can chart the trend.
Before you rely on it, check that next year's loan repayments are in current liabilities and that any line of credit is too. Both are easy to mis-file, and both make the ratio look better than it is.
If you have a business loan, also read its covenants section. Some loan agreements set a minimum current ratio or working capital figure, and say exactly how the lender calculates it, including which balance sheet date counts. Work yours out the lender's way each month, so a breach never comes as a surprise at the annual review. Your accountant can help you read the definitions.
Where the current ratio misleads
It can be tidied up for one date
When the ratio is above 1, paying bills raises it. Pay $40,000 of supplier bills the day before the balance sheet date and Morrow's 2024 ratio moves from 1.60 to 1.76. Nothing about the business changed.
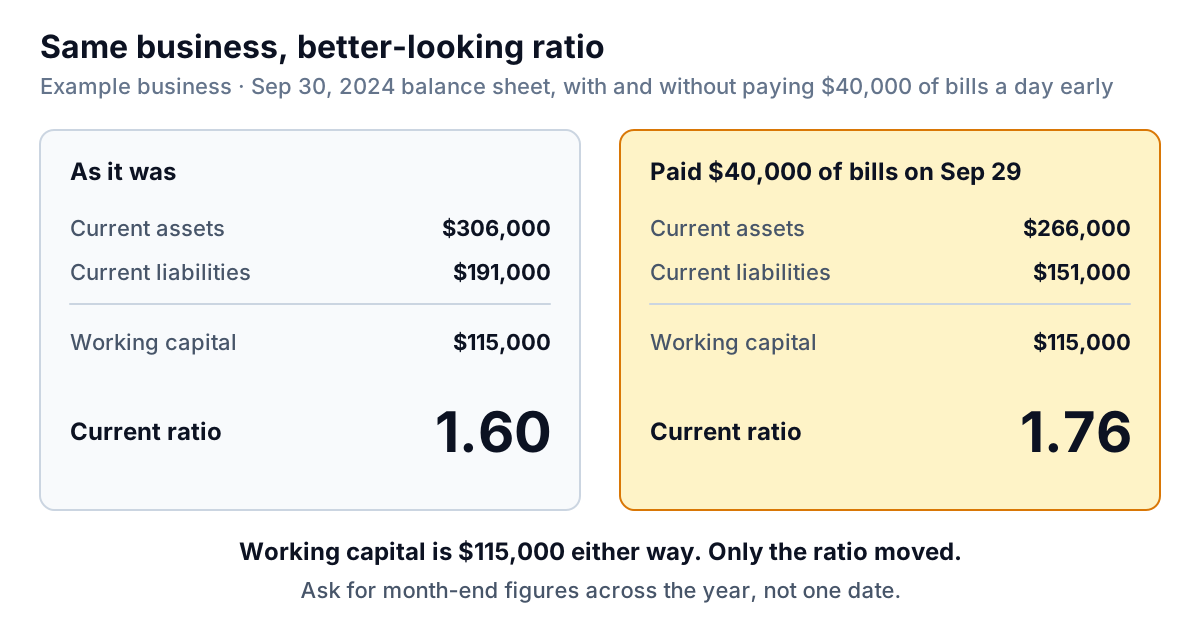
Borrowing does the reverse: drawing on a line of credit adds the same amount to both sides and pulls the ratio towards 1. If you're comparing yourself with last year, use the same month end, and ideally look at all twelve.
It's one day in a seasonal year
A supplier to schools has a very different balance sheet in August, full of stock for the new term, than in December. Compare like months, or chart every month end.
It's a ratio, not an amount
A ratio of 2.0 means $20,000 of cushion for a business with $20,000 of current liabilities and $200,000 for one with $200,000. Read it alongside working capital, the same two totals subtracted instead of divided.
It doesn't know when things fall due
A supplier bill due Friday and a loan payment due in eleven months count the same. So do receivables from a customer who always pays on day 30 and one who's been "processing" since spring. The cash conversion cycle measures that timing directly.
What to do when your current ratio moves
| What you see | Likely cause | First step |
|---|---|---|
| Below 1.0 and falling | Bills growing faster than cash and receivables; often losses or heavy short-term borrowing | Build a 13-week cash flow forecast and talk to your accountant and bank early |
| Falling while sales grow | Growth financed with supplier credit and short-term debt | Usually manageable; arrange working capital finance before it tightens |
| Rising while sales grow | Profit being retained in the business | Healthy; check the quick ratio rises too |
| Rising while sales are flat | Slow receivables, aging stock or idle cash | Break current assets down as Morrow did and deal with each parked amount |
At Morrow, the plan was simple. Chase the over-60-day accounts and move the two schools to purchase-order billing with a named contact. Sell the old toner and chairs through a clearance list, even at cost. Decide on a cash cushion, say one month of outgoings. Then use the cash above it, plus whatever the collections and clearance bring in, to pay down the term loan: about $111,000 if everything worked. Current assets would fall to about $403,000 and the current ratio to about 2.3. The ratio would be lower, the interest bill smaller and the business in better shape.
Keeping the current ratio honest every month
A ratio you check once a year at loan renewal tells you very little. Twelve month-end values, next to the quick ratio, receivables days and inventory days, tell you what's happening and why.
Parity builds that view from your books. Connect QuickBooks Online, or upload balance sheet and P&L exports from Xero or any other tool as CSV or Excel, and it builds a dashboard with the headline numbers and their trends, charts, what explains them and a table of what needs attention, such as customers past 60 days or the slowest-selling stock if you add an inventory export. Every number is checked against queries on the full dataset before you see it. Refine it by chat, share a read-only link with your accountant, or ask it to write the report for your bank from the same data.
Upload your balance sheet and get a checked dashboard showing the ratio, its trend and the receivables and stock behind it. Build a report from your data free
A good current ratio isn't the highest one. It's one that's high enough to pay your bills on time through your slowest month, with everything above that doing a job.