The owner of Summit Concrete, a made-up concrete subcontractor, has four things to do this month: price change orders on two jobs that are losing margin, walk a slab with its foreman, chase retainage on three finished jobs, and review two injuries with the crews. Eight numbers put those on the list. Each is a construction KPI: a number you calculate on a fixed schedule because it tells you early whether your jobs will make money and whether there will be cash to finish them. Each one needs a formula (backlog in months = signed but unearned work ÷ average monthly revenue, for example), a person who owns it, and a trigger that says when to act.
Lists of construction KPIs often run to dozens of metrics. A small contractor can act on about eight. This guide picks those eight, gives the formula for each, and works them through for Summit, which does about $7.2 million a year of foundations, slabs and flatwork. The test for every metric: if it moved, would you do something different this month? Summit's scorecard for the end of September looks like this:
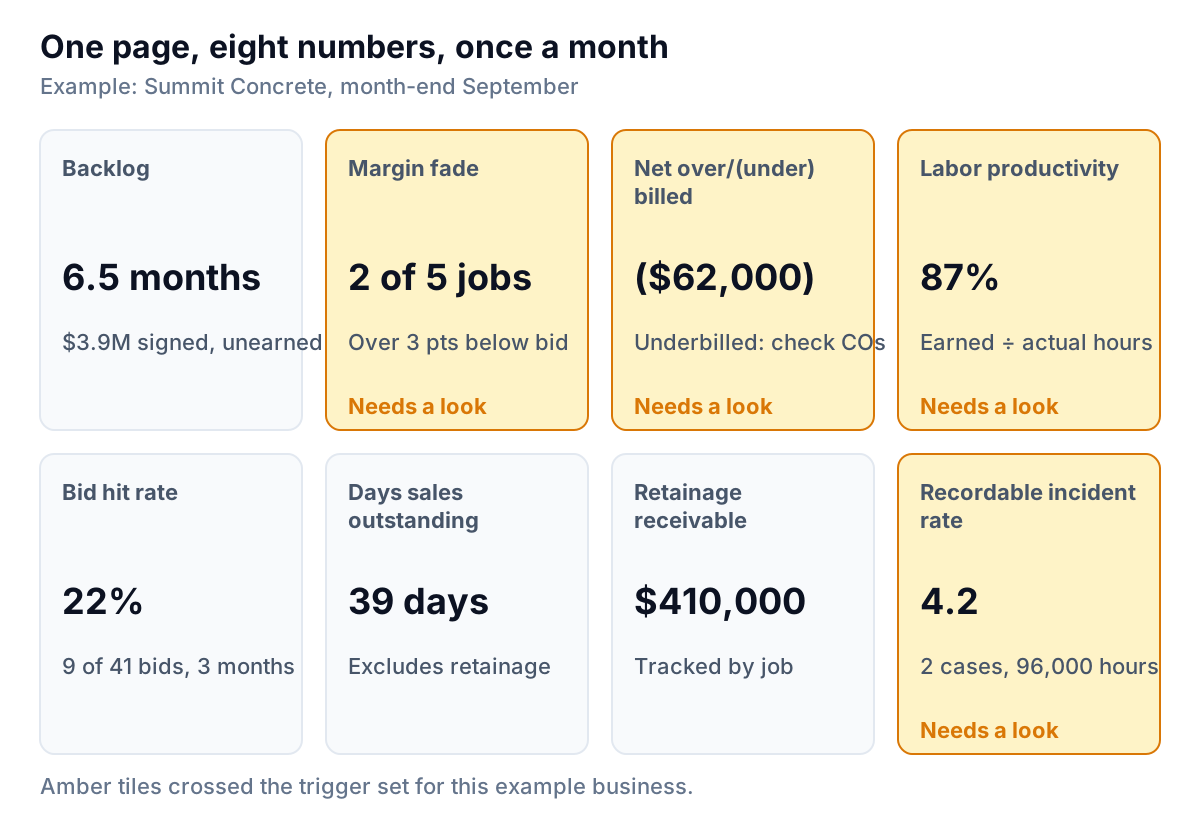
The eight fall into three groups: what's coming (backlog, hit rate), how the jobs in progress are going (margin fade, productivity, billing position), and whether the cash and the crew are safe (days sales outstanding, retainage, incident rate).
What's coming: backlog and bid hit rate
1. Backlog, in months
Formula: backlog = total value of signed contracts − revenue already earned on them. Months of backlog = backlog ÷ average monthly revenue (use the last three months to smooth out weather).
Summit: $3,900,000 of signed, unearned work ÷ $600,000 a month = 6.5 months.
For context, Associated Builders and Contractors' monthly member survey put its Construction Backlog Indicator at 8.5 months in August 2026, unchanged from a year earlier. That's an average across ABC's commercial and industrial contractor members, not a target. A concrete sub that's on site early in each project will naturally carry less backlog than a general contractor holding the whole building.
Act when: months of backlog falls for three months running, or drops below the time it takes you to win and start new work. If your bid-to-start cycle is four months and backlog is three, the crews will be idle before new work arrives. Also check backlog margin, not just size: a full order book at thin margins can make a busy year with no profit.
2. Bid hit rate
Formula: jobs won ÷ jobs bid, over a rolling three months. Track it by count and by dollars.
Summit: 9 won of 41 bid = 22% by count; $2.6 million won of $14.2 million bid = 18% by dollars. The gap says Summit wins smaller jobs more often than large ones.
Act when: the rate moves sharply either way. A falling hit rate can mean prices are high, or you're bidding work that isn't a good fit. A rate that jumps can mean you've left money on the table; check how far below the next bidder you landed. Split the rate by customer and job type before you change your markup, because one general contractor who never awards you anything can drag the whole number down.
How the jobs are going: fade, productivity and billing
These three are where most construction KPI scorecards earn their keep, because they catch a problem while there's still work left to fix it.
3. Gross margin by job, against the bid
Formula: current estimated gross margin = (contract price − current estimated total cost) ÷ contract price. Fade = bid margin − current estimated margin.
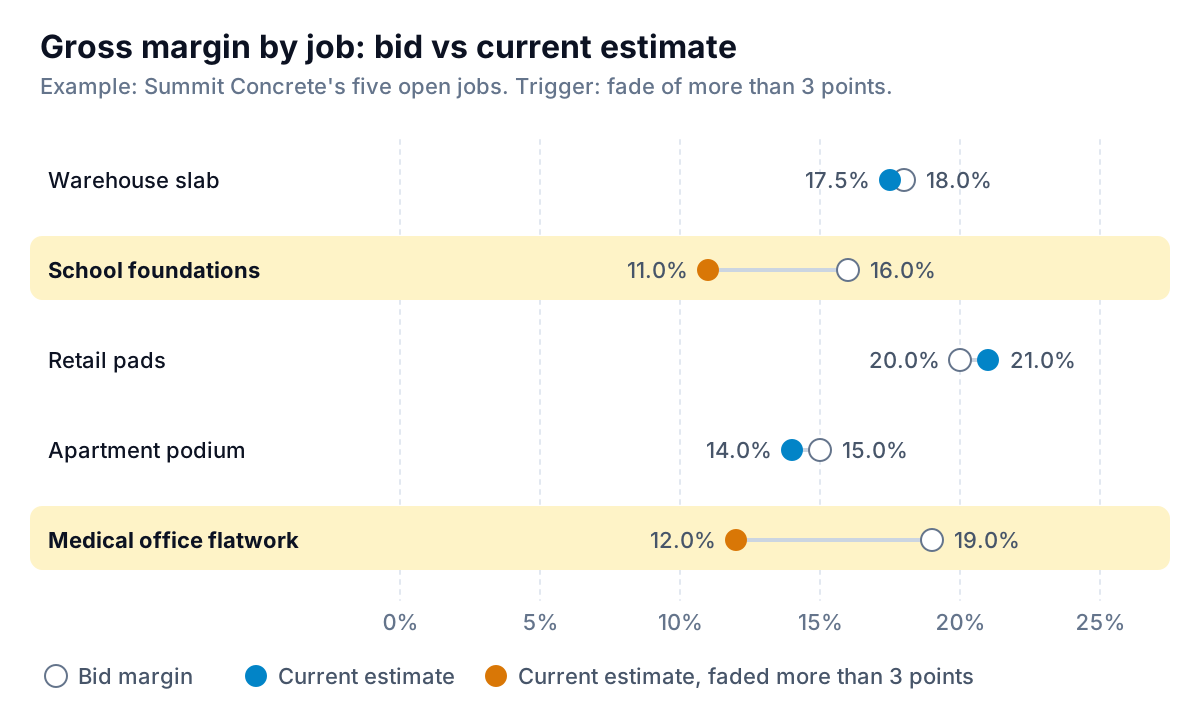
Summit: three jobs are within a point of their bid; the retail pads job is ahead. The school foundations have faded from 16.0% to 11.0%, and the medical office flatwork from 19.0% to 12.0%.
The current estimate is only as honest as the person who updates it. Ask each project manager to sign off a cost-to-complete figure every month, and compare it with last month's. A job whose estimate never changes until the last month isn't on budget; nobody has looked. How margin is set at bid, and why markup and margin differ, is covered in our guide to construction profit margin.
Act when: fade passes a trigger you set in advance. Summit uses 3 points, or any job now forecast to lose money. Then go to the job cost report by cost code (see our job costing guide) to find which line is running over.
4. Labor productivity: earned hours vs actual hours
Formula: earned hours = units of work completed × estimated hours per unit. Productivity = earned hours ÷ actual hours. Above 100% means the crew is beating the estimate.
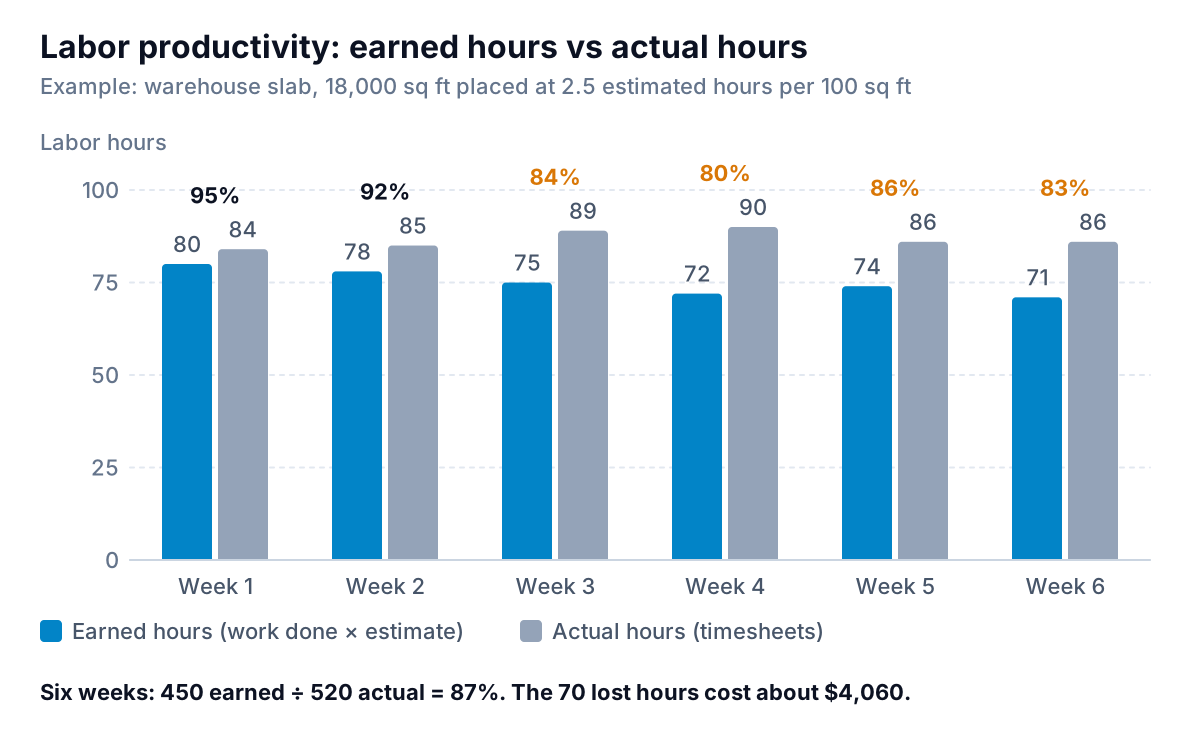
Summit: on the warehouse slab, the estimate allowed 2.5 labor hours per 100 square feet. After six weeks the crew had placed and finished 18,000 square feet, worth 450 earned hours, and timesheets show 520 actual hours. Productivity is 450 ÷ 520 = 87%. At Summit's burdened labor rate of $58 an hour, the 70 lost hours cost about $4,060. The warehouse margin has only faded half a point so far because the job's materials came in under budget, which is exactly why you track labor separately: a good line can hide a bad one.
Pick one unit per type of work that your estimate already uses: square feet of slab, cubic yards placed, linear feet of footing. Dollars are a poor unit for productivity, because a wage increase looks like the crew slowed down.
Act when: a job runs below 90% for two weeks in a row. Walk the site with the foreman. Common causes are waiting (for pump trucks, inspections, other trades), rework, or a crew mix that doesn't match the work. If one type of work runs below estimate on every job, the estimate is wrong, not the crews.
5. Net over or under billing
Formula: for each job, billed to date − earned revenue (earned revenue = percent complete × contract price). Add the jobs up for the company figure.
Summit: three jobs are overbilled by $95,000 in total and two are underbilled by $157,000, so the company is net underbilled $62,000. The two underbilled jobs are the school and the medical office, the same two that are fading. Rising costs plus unbilled work on the same job often point to extra work done without a signed change order.
The full method, including how sureties read these numbers, is in our construction WIP report guide. As a KPI, watch two things: the net figure, and any job underbilled two months in a row.
Cash and safety: DSO, retainage and incident rate
6. Days sales outstanding, without retainage
Formula: DSO = accounts receivable (excluding retainage) ÷ revenue for the period × days in the period.
Summit: $780,000 of receivables ÷ $1,800,000 of revenue in the last 90 days × 90 = 39 days.
Leave retainage out. It isn't late; it's held under the contract until completion, and mixing it in makes DSO swing every time a big job closes. Track it as its own number instead.
7. Retainage receivable, by job
Summit: $410,000 held across eleven jobs, including three that finished more than 90 days ago.
That $410,000 is about two-thirds of a month's revenue for Summit, for work already paid for in wages and concrete. The KPI that matters is the age of retainage on finished jobs. Every job that has been complete for more than 60 days without its retainage released needs a named person chasing the closeout paperwork: punch list sign-off, lien waivers, warranties and as-builts. Our construction cash flow guide shows how retainage and payment terms shape the cash curve of a job.
Act on cash when: DSO rises 10 days above its usual level, or a single customer's balance runs past its terms. Call before the next pay application, not after.
8. Recordable incident rate
Formula: (number of OSHA-recordable injuries and illnesses × 200,000) ÷ total hours worked. The 200,000 stands for 100 full-time workers for a year, so firms of any size can compare; the Bureau of Labor Statistics explains the calculation.
Summit: 2 recordable cases in 96,000 hours worked over the last twelve months: 2 × 200,000 ÷ 96,000 = 4.2.
The BLS reported a rate of 2.2 cases per 100 full-time workers for the construction industry in 2024. Summit is well above that. With a small workforce, one case moves the rate a lot, so look at the cases themselves as well as the number: what happened, and what changed afterwards.
Act when: any recordable case happens. Use the rate as the trend over twelve months, not as the trigger.
Mistakes that make construction KPIs useless
- Tracking too many. If a metric hasn't changed a decision in six months, drop it. Twenty numbers on a page means none of them gets read.
- No trigger written down. "Keep an eye on fade" means nothing. "Any job down 3 points from bid gets a meeting within a week" does.
- Company averages only. Summit's overall margin looks fine because the retail and warehouse jobs carry the school and medical office. Margin, productivity and billing are job-level numbers first.
- Stale cost-to-complete estimates. Fade and over or under billing both depend on them. If they're last quarter's, so is your scorecard.
- Retainage mixed into receivables. It makes DSO meaningless and hides old retainage nobody is chasing.
- Comparing against a benchmark that measures something else. A backlog survey of general contractors isn't a target for a trade sub, and a national incident rate isn't adjusted for your type of work.
Who owns each number
| KPI | Source | Owner | Summit's trigger |
|---|---|---|---|
| Months of backlog | Signed contracts, revenue to date | Owner | Three monthly declines, or below 4 months |
| Bid hit rate | Bid log | Estimator | Below 15% or above 35% for a quarter |
| Margin fade by job | Job cost report, PM cost-to-complete | Project managers | More than 3 points, or any loss |
| Labor productivity | Timesheets, quantities installed | Superintendent | Below 90% two weeks running |
| Over or under billing | WIP schedule | Office manager, PMs | Any job underbilled two months running |
| DSO (excluding retainage) | AR aging, revenue | Office manager | 10 days above normal |
| Retainage aging | Retainage ledger by job | Office manager | Finished job, unpaid after 60 days |
| Recordable incident rate | OSHA 300 log, payroll hours | Safety lead | Any recordable case |
The triggers are Summit's choices for an example business, not industry standards. Set yours from your own history, then leave them alone long enough to learn whether they work.
Building the monthly construction KPI scorecard
All eight numbers come from data most contractors already have: the accounting system for revenue, costs, receivables and retainage; timesheets and quantity logs for productivity; PM estimates for cost to complete; a bid log; the OSHA log. The work is pulling them together every month, and that's usually where the scorecard dies.
Parity connects to QuickBooks Online directly, or takes CSV and Excel exports from construction accounting software, time tracking and a bid log in Google Sheets. Upload the files and describe the scorecard: backlog in months, margin fade by job against bid, net over or under billing, DSO without retainage. It builds a dashboard with the headline numbers and their trends, charts, what explains the changes and a table of what needs attention, such as jobs past their trigger. Every number is checked against queries on the full dataset before you see it. Share it with your PMs as a read-only link, save it as a template, and update it with next month's exports. For more on choosing and laying out the numbers, see our KPI dashboard guide.
Upload job costs, billings and your PM estimates, and get a checked monthly scorecard with the jobs that need attention. Upload your job reports
When the scorecard works, the monthly meeting gets shorter, not longer. Four amber tiles, four owners, four decisions. Summit's this month: price the change orders on the school and medical office, walk the warehouse slab with its foreman, chase retainage on three finished jobs, and review two injuries with the crews involved.