"Twenty percent." That's what the owner of Stonegate Builders, an example general contractor we'll follow through this guide, says when you ask what he makes, because he adds 20% to the cost of every bid. His accountant's numbers for last year say 16.7% gross and 3.7% net, on $4.2 million of work. Both are a construction profit margin, profit as a share of revenue, and contractors need both versions. Gross profit margin = (revenue − direct job costs) ÷ revenue; net profit margin = (revenue − direct job costs − overhead) ÷ revenue.
Nothing went badly wrong on any one of Stonegate's jobs. The gap comes from two pieces of arithmetic most bids get wrong: markup isn't margin, and overhead has to be paid out of what's left. This guide works through both, then shows what published construction profit margin figures actually measure, so you can compare yourself with the right ones.
Gross margin and net margin: two numbers, two questions
Gross margin answers "did the jobs make money?". Net margin answers "did the company make money?". You need both, because a business can have healthy jobs and still lose money if the office costs too much for the volume of work.
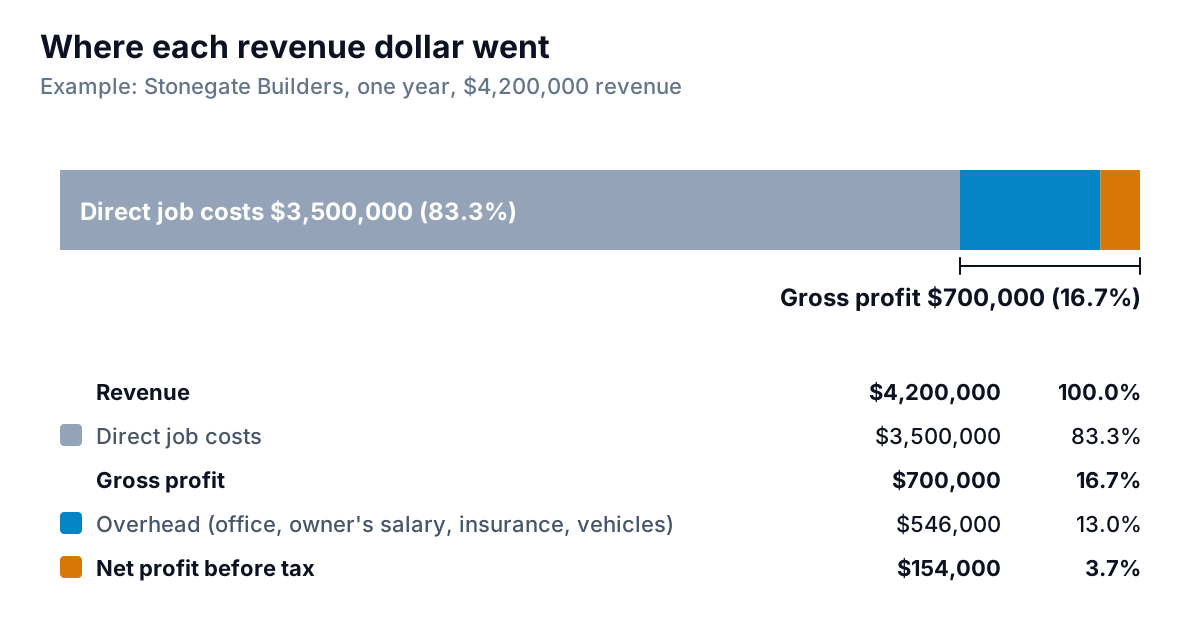
Stonegate's year, in the order it appears on the profit and loss statement:
- Revenue: $4,200,000.
- Direct job costs: $3,500,000. Everything charged to a job: crew labor at the burdened rate, materials, subcontractors, equipment, permits, job-site costs.
- Gross profit: $700,000, or 16.7% of revenue.
- Overhead: $546,000, or 13.0%. Office and estimating staff, the owner's salary, the office lease, vehicles, general liability insurance, software, accounting, marketing.
- Net profit before tax: $154,000, or 3.7%.
The line between direct cost and overhead decides what gross margin means. A project manager who runs one job at a time is a direct cost of that job; one who oversees five is usually overhead. A truck that lives on one site can be charged to it; the owner's pickup can't. Whatever rules you choose, keep them the same every year, or your margin trend will move for reasons that have nothing to do with performance. Our job costing guide covers how to charge costs to jobs, including labor burden.
The markup vs margin trap in construction bids
Markup is profit as a percentage of cost. Margin is the same profit as a percentage of the price. Because the price is always bigger than the cost, the margin is always the smaller number.
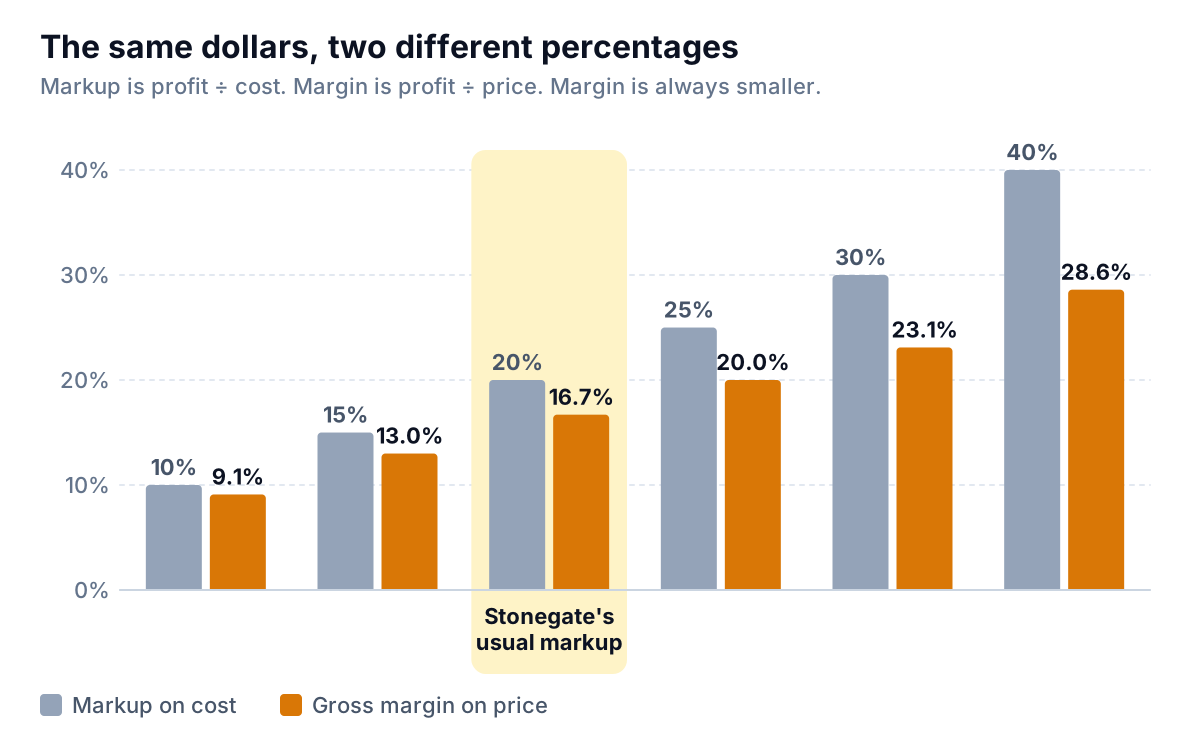
On a job that costs $300,000, Stonegate's 20% markup gives a price of $360,000. The profit is $60,000: 20% of the cost, but only 16.7% of the price. Do that on every job for a year and you get Stonegate's P&L: $3,500,000 of cost, $4,200,000 of revenue, a 16.7% gross margin.
The two conversion formulas are worth taping to the estimating desk:
- Margin from markup: margin = markup ÷ (1 + markup). 20% ÷ 1.20 = 16.7%.
- Price for a target margin: price = cost ÷ (1 − target margin). For a 20% margin on $300,000 of cost: $300,000 ÷ 0.80 = $375,000, which is a 25% markup.
The trap isn't only in your head. Overhead, profit targets and benchmarks are all quoted as a share of revenue, while most estimating spreadsheets add a percentage to cost. Mixing the two is how a contractor who "needs 20%" ends up with 16.7%. Our guide to margin vs markup has a full conversion table and more examples outside construction.
Overhead recovery: what every bid has to carry
Overhead doesn't belong to any job, but every job has to pay its share. The question to ask before you set a markup is: what gross margin do I need for the year's overhead to be covered and leave the profit I want?
The formula is short: required gross margin = overhead % of revenue + target net margin. For Stonegate, overhead is $546,000 on $4,200,000 of expected revenue, which is 13.0%. If the owner wants 6% net before tax, every job needs to earn 19.0% gross. Converted to markup: 19.0% ÷ (1 − 19.0%) = 23.5%.
Back on the $300,000 job, a 23.5% markup gives a price of $370,500 and $70,500 of gross profit, 19.0% of the price. Charging that job 13% of its price for overhead ($48,165) leaves $22,335, about 6% net. At the old 20% markup, the same job left $13,200, or 3.7%. The extra $10,500 on the bid is the difference between the profit the owner wants and the one he's been getting.
Now the uncomfortable part. Overhead is mostly fixed, so its share of revenue depends on how much work you win.
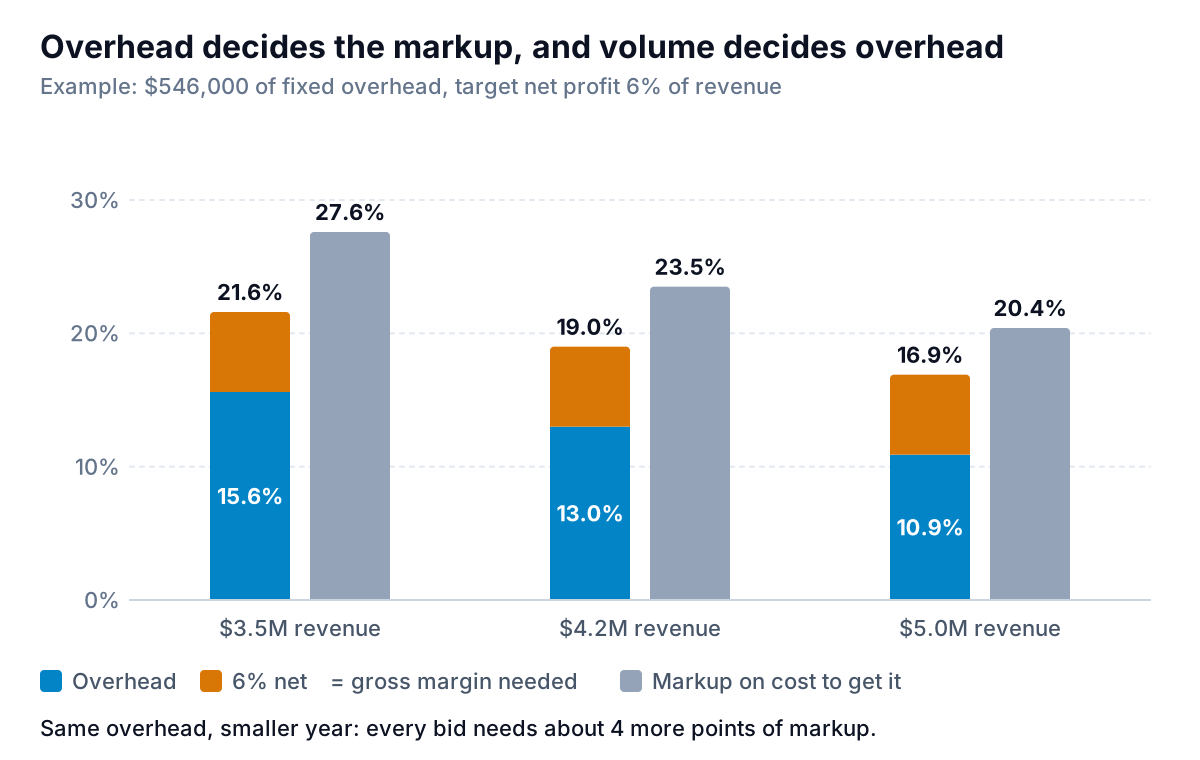
If Stonegate's revenue falls to $3.5 million, overhead becomes 15.6% of revenue and the required markup jumps to 27.6%. If it grows to $5.0 million without adding overhead, 20.4% would do. That's why the overhead rate in your estimate should come from a realistic revenue forecast, not last year's best month, and why it's worth re-checking every quarter. When volume drops, you can raise markups, cut overhead, or accept a smaller profit for a while. Pretending the old rate still applies is the one option that doesn't work.
What construction profit margins look like, by who measured them
Benchmarks only help if they measure the same thing as your P&L. Here are current published figures, with what each one counts:
| Source and sample | Gross margin | Net margin | What to know |
|---|---|---|---|
| NAHB Remodelers' Cost of Doing Business Study, fiscal 2024 (NAHB, April 2026) | 29.9% | 6.3% | Operating expenses 23.6% of revenue; average revenue $2.7 million |
| NAHB Builders' Cost of Doing Business Study, fiscal 2023 (NAHB, March 2025) | 20.7% | 8.7% | Home builders; cost of sales includes land. Operating expenses (finance, sales and marketing, G&A, owner's compensation) 12.0% |
| Same builders' study, top and bottom 25% (NAHB, July 2025) | 29.7% top, 17% bottom | 17.7% top, −1.4% bottom | A wide spread between the best and worst builders |
| CFMA Construction Financial Benchmarks, 2024 report, as summarised by CPA firm James Moore & Co. (June 2025) | About 14.8% general contractors; just over 16% specialty contractors | Not given in that summary | Mostly commercial contractors, where subcontracted work lowers gross margin |
Three things to take from the table. First, gross margin depends heavily on business model. A remodeler who does much of the work with its own crew and sells smaller jobs carries more overhead and needs a higher gross margin; NAHB's remodelers spent 23.6% of revenue on operating expenses, against 12.0% for builders. A commercial general contractor that subcontracts most of a large project passes a lot of cost through at thin markups, so its gross margin is lower but so is its overhead as a share of revenue.
Second, the range within a group matters more than the average. NAHB's bottom quarter of builders lost money while the top quarter cleared 17.7%. Being "average" isn't the goal; knowing which way your jobs drift is.
Third, compare like with like. Stonegate builds custom homes on clients' lots and light commercial work, with no land in its costs, so the builders' 20.7% gross (which includes land) isn't a fair yardstick. Its own overhead rate and target are the real benchmark: 19.0% gross at $4.2 million of revenue.
CFMA publishes its full results through its Financial Benchmarker, which we couldn't access, so the CFMA figures above come from a CPA firm's summary of the 2024 report rather than from CFMA directly. Treat them as a rough guide and check the original if you can.
Where margin leaks between the bid and the final number
Even with the right markup, a bid margin only becomes a real one if the job runs to budget. The usual leaks, in rough order of how often they show up in small contractors' job cost reports:
- Labor running over the estimate. Slower crews, rework or site conditions. It's the largest variable cost on most self-performed work.
- Extra work without a signed change order. The crew does it to keep the client happy, the cost lands on the job, and the invoice never goes out.
- Labor costed at the wage. Bids priced on wages instead of burdened rates miss payroll taxes, insurance and benefits. The margin disappears before the job starts.
- Allowances that don't cover what the client picks. Fixtures, finishes and tile chosen late, priced early.
- Warranty and callbacks charged to the next job or to overhead, so the original job looks better than it was.
On jobs that run for months, margin can also fade gradually as the cost estimate creeps up. A monthly work in progress report catches that while there's still time to price change orders or push back. If you account for long jobs on the percentage-of-completion method, the margin you report each period also depends on your cost-to-complete estimates; how and when to book revenue and losses is a question for a CPA who works with contractors.
Decision rules for bids and for the year
| Situation | Rule |
|---|---|
| Setting a bid price | Price = cost ÷ (1 − required gross margin), with the required margin from overhead % + target net |
| Revenue forecast drops 15% or more | Recalculate overhead %, then decide: raise markup, cut overhead, or accept lower profit, deliberately |
| Closed-job margins average 2+ points below bid for a quarter | Look at job cost reports by cost code; fix the estimate lines that keep overrunning before raising markup |
| A job type always earns less than others | Raise its markup, or stop bidding it |
| Tempted to cut markup to win a big job | Check whether it adds revenue without adding overhead. If it does, a lower margin can still raise net profit; if it needs another PM and truck, it probably doesn't |
These thresholds fit an example contractor, not every business. Use your own job history to set them. For the full set of numbers to review each month, including backlog and margin fade by job, see our construction KPI guide. And because thin margins leave little room for slow payment, the construction cash flow guide shows how retainage and payment terms shape the cash behind the profit.
Tracking construction profit margin by job, every month
Annual margins tell you what happened. Margin by job, every month, tells you what to change in the next bid. Most contractors have the data in their accounting system and their estimates; it's just in two places.
Parity connects to QuickBooks Online directly, or takes a CSV or Excel export from your construction software. Upload job costs and revenue by job with the bid margin for each, and ask for the view you want: gross margin by job against bid, overhead as a share of revenue by month, closed jobs ranked by margin lost. It builds a dashboard with headline numbers and their trends, charts, what explains the changes and a table of what needs attention. Every number is checked against queries on the full dataset before you see it. When you ask, it writes a client-ready report from the same data, such as a quarterly summary for your bank or a business partner.
Connect QuickBooks Online or upload a job export, and get a checked dashboard of gross margin by job and overhead by month. Build a report from your data free
The fix at Stonegate wasn't a new system. It was one number on the estimating sheet: required gross margin, worked out from real overhead and a real revenue forecast, then converted to markup. Do the same and the bid you send already contains the profit you meant to make.