Keystone Remodeling, a made-up company, bid a kitchen at a 25.0% margin and closed it at 21.0%. Forty extra carpentry hours, an unbilled circuit move and a fussier tile explain most of the four missing points. The owner knows that only because of job costing: charging every dollar of labor, materials, subcontracts and equipment to the job that used it, under the same cost codes as the estimate. At the end, job gross profit = contract price (including approved change orders) − actual job cost, and you can see which line of the estimate won or lost the difference.
Without it, a contractor learns about profit once a year, from a P&L that adds every job together. A remodeler can win twenty kitchens, lose money on six of them and never know which six. This guide follows Keystone's kitchen from estimate to close-out. Every number reconciles, so you can rebuild the arithmetic for your own jobs.
The four piles every job cost lands in
Every cost on a construction job belongs in one of four piles. Keep them apart, because each one goes wrong for a different reason.
- Labor: your own crew's hours, costed at the full burdened rate (more on that below). This is the pile that overruns most often, because the estimate is a guess about speed.
- Materials: lumber, cabinets, tile, fixtures, anything bought for the job. Overruns here usually mean price changes, waste or a missed item on the takeoff.
- Subcontracts: plumbing, electrical, HVAC and other trades you hire. These tend to hold to their quotes unless scope changes.
- Equipment and job overhead: rentals, dumpsters, permits, portable toilets, job-specific insurance. Small items that add up and often get forgotten in the estimate.
What doesn't belong on the job: the office lease, the owner's truck, the bookkeeper, marketing. Those are company overhead, recovered through the margin you put on every job. How much margin you need to cover them is the subject of our guide to construction profit margin.
Cost codes: make the books speak the estimate's language
A cost code is a short label that says what a cost was for. The rule that makes job costing work: the estimate and the books use the same codes. If the estimate says "Tile and flooring, $5,200" and the books scatter tile costs across "Materials" and "Subcontractors", you can never compare them.
Keystone uses nine codes for a typical kitchen, plus one per change order:
| Code | What goes in it | Main source document |
|---|---|---|
| 01 | Demolition and haul-off | Timesheets, disposal invoices |
| 02 | Carpentry labor | Timesheets × burdened rate |
| 03 | Plumbing subcontract | Sub's invoice |
| 04 | Electrical subcontract | Sub's invoice |
| 05 | Drywall and paint | Supplier bills, timesheets |
| 06 | Cabinets and countertops | Supplier bills |
| 07 | Tile and flooring | Supplier bills, installer invoice |
| 08 | Fixture install | Timesheets |
| 09 | Permit and dumpster | Permit receipt, rental invoice |
| CO-1, CO-2… | Each change order on its own | Signed change order, its costs |
Three rules for choosing codes. Use 10 to 25 for a small contractor; more than that and the crew will guess. Split labor from material where both are big, so you can tell a slow crew from a price rise. And give every change order its own code, so its profit doesn't hide inside the base contract.
Commercial contractors often borrow the division numbers from the project specifications. For a remodeler or small trade contractor, codes that mirror your own estimate template work better than a long standard list nobody on site has read.
Labor burden: the cost most job costing misses
The most common job costing mistake is costing labor at the wage. An hour of a carpenter's time costs you the wage plus payroll taxes, workers' compensation, insurance and paid time off. That extra is labor burden, and on most crews it's large.
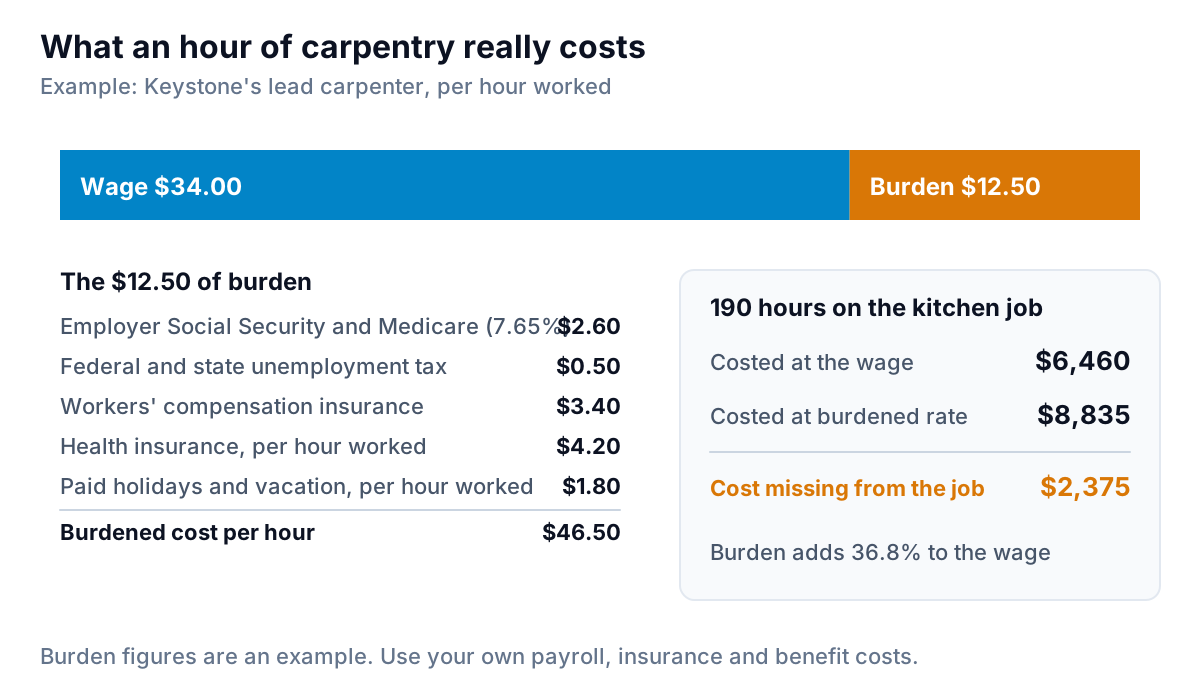
Keystone's lead carpenter earns $34.00 an hour. Employer Social Security and Medicare alone add 7.65% (6.2% plus 1.45%, per the IRS), or $2.60. Unemployment taxes, workers' comp, health insurance and paid holidays, spread over the hours actually worked, bring the total to $46.50. That's 36.8% on top of the wage.
Keystone's figures are an example, but the scale is typical. The Bureau of Labor Statistics' Employer Costs for Employee Compensation survey put construction employers' costs at $51.96 per hour worked in June 2026: $36.13 of wages and $15.84 of benefits (Table 4). That's about 44 cents of benefits for every dollar of wages across the construction industry, though the BLS figure includes items such as retirement plans and overtime premiums that a small remodeler may not pay.
Work out your own rate once a year, from last year's payroll and insurance bills, per hour actually worked (not per hour paid). Update it when your workers' comp rate or health plan changes. If you run payroll through QuickBooks Online, Intuit's help article on tracking hourly labor costs by project describes entering an hourly cost rate that can include employer taxes, workers' comp and overhead, on the Plus and Advanced plans.
Estimate vs actual: reading a job cost report
Keystone bid the kitchen at $68,000 against an estimated cost of $50,975, for a gross profit of $17,025 (25.0%). Mid-job the homeowner added a pantry cabinet and an outlet: change order CO-1, priced at $4,200 against $3,000 of estimated cost. The revised contract was $72,200 and the revised budget $53,975, for $18,225 of planned profit (25.2%).
Here's the job cost report at close-out:
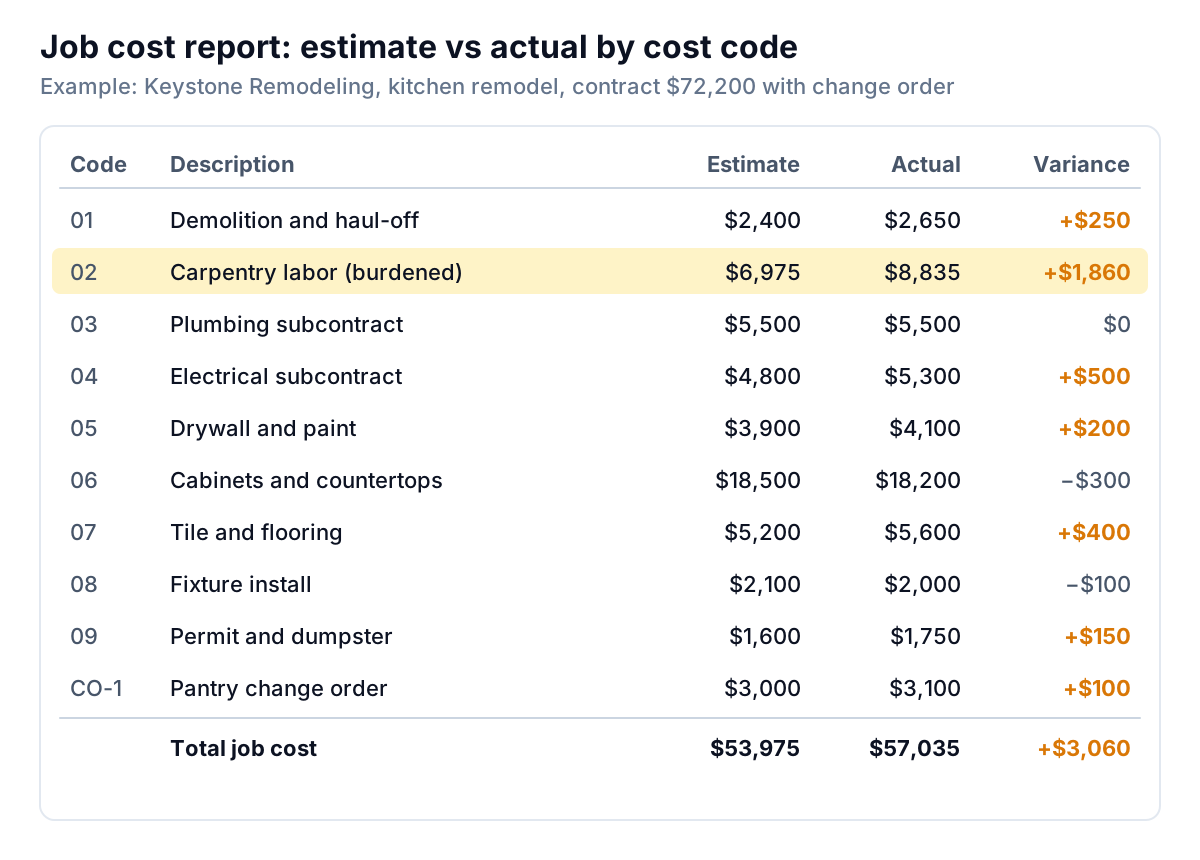
Actual cost came to $57,035, $3,060 over budget. Revenue was $72,200, so gross profit was $15,165, or 21.0%. Four points of margin went missing. The cost codes say where:
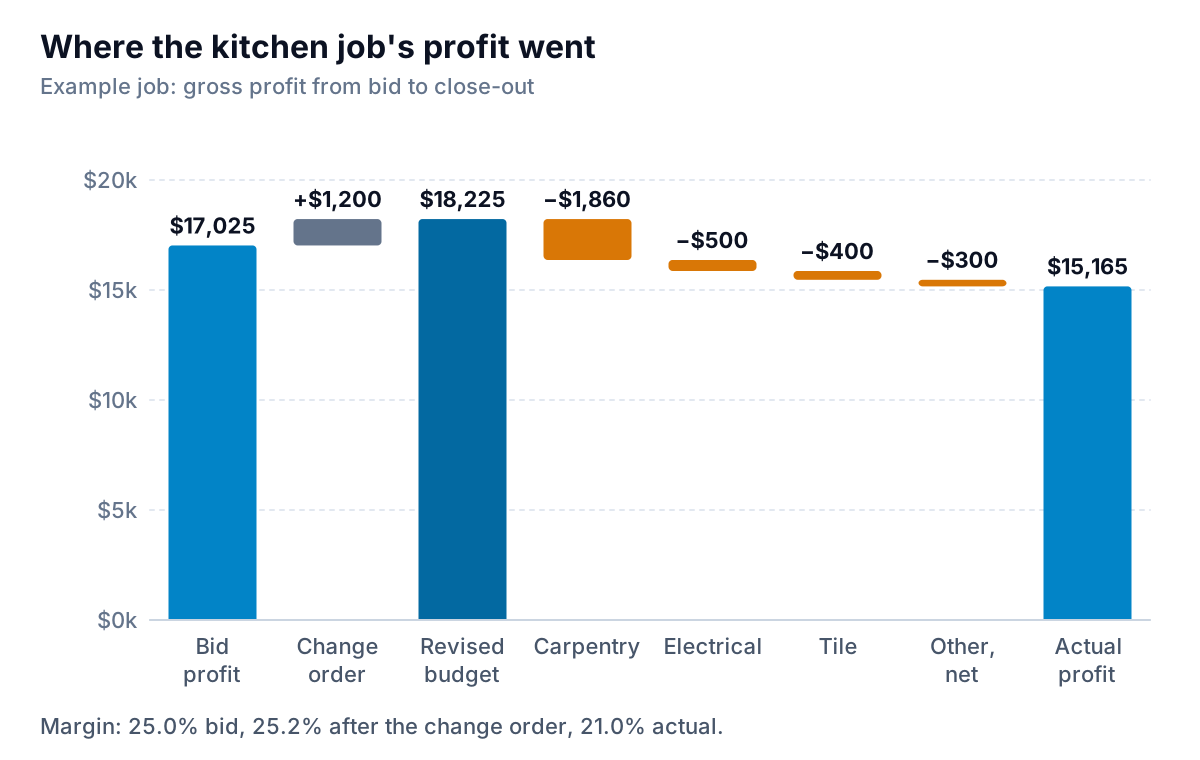
- Carpentry, −$1,860. The estimate allowed 150 hours; the crew took 190. Forty hours × $46.50 = $1,860. The job notes show out-of-square walls that needed shimming before cabinets went in.
- Electrical, −$500. The electrician moved a circuit the homeowner asked for on site. It was extra scope, but nobody wrote a change order, so Keystone paid for it and never billed it.
- Tile, −$400. The homeowner picked a tile that needed more cuts and more waste than the allowance assumed.
- Everything else, −$300 net. Small overruns on demolition (+$250), drywall (+$200), permit and dumpster (+$150) and the change order itself (+$100), partly offset by cabinets (−$300) and fixtures (−$100) coming in under.
Each cause has a different fix. The carpentry overrun is an estimating question: does Keystone's estimate for kitchens in older houses allow for walls that aren't square? The electrical loss is a process gap: any work outside the written scope needs a signed change order before it starts. The tile overrun is a contract question: allowances should say what happens when the client chooses something harder to install.
Change orders deserve their own scorecard
CO-1 made $1,100 of profit on $4,200 of price (26.2%), close to the base job's planned margin. That's healthy. The real change order lesson on this job is the one that never existed: the $500 circuit move. Track two numbers across all jobs each quarter: profit on signed change orders, and cost of unsigned extra work found in the job cost report. The second one should be close to zero.
Where the job costing numbers live
A job cost report pulls from four places. Most small contractors have all four already; the work is tagging each entry with a job and a cost code at the moment it's entered.
- Timesheets. Hours by person, job and cost code. A paper sheet works if someone codes it daily; a phone time-tracking app is easier. Hours without a cost code are the main reason labor lines end up useless.
- Supplier bills and receipts. Each bill coded to a job and cost code when it's entered. Card purchases at the supply house need the job written on the receipt, or they land in a general "materials" account.
- Subcontractor invoices. Coded to the job and the trade's code, with the sub's original quote kept against it.
- The estimate and change order log. The budget side of the report. Keep the signed estimate's cost by code in a spreadsheet or your estimating tool, and add each signed change order as a new line.
In QuickBooks Online Plus or Advanced, jobs can be set up as Projects, and Intuit's article above describes running a Project profitability report from a project's Project Reports tab. Construction accounting and project management tools usually store cost codes natively and can export job costs by code to CSV or Excel. Whatever you use, the fallback is the same: export actual costs by job and code, put the estimate by code next to it, and calculate the variance. A spreadsheet with a SUMIFS on job and cost code does the job for a handful of jobs. It gets fragile past ten or so, when someone pastes a new export with columns in a different order.
Mistakes that make job cost reports lie
- Costing labor at the wage. On Keystone's kitchen, that would have shown carpentry at $6,460, apparently under the $6,975 budget, when it was $1,860 over.
- Codes that don't match the estimate. If the estimate has "Tile and flooring" and the books have "Materials – flooring" and "Labor – install", someone has to translate every month, and eventually stops.
- Posting costs to the wrong period or the wrong job. A cabinet order delivered in March and billed in April makes March look cheap and April look terrible. Post bills to the month the material arrived, or add an accrual for big deliveries.
- Burying change orders in the base contract. You lose the ability to tell whether change work is profitable, and unsigned extras disappear into the overrun.
- Looking only at close-out. A job cost report reviewed weekly while the job runs lets you catch the carpentry overrun at hour 120, not hour 190.
- Not feeding results back into estimates. If kitchens in pre-1960 houses take 25% more carpentry than your estimate says, three jobs in a row, the estimate is wrong, not the crew.
Decision rules
| What the job cost report shows | What to do |
|---|---|
| A labor code over budget by more than 10% while the job is running | Talk to the lead that week: is it site conditions, rework or a bad estimate? Re-forecast the remaining hours |
| A cost with no matching scope in the estimate | Check for unsigned change work. Get it priced and signed before more is done |
| The same code over budget on three similar jobs | Raise that line in your estimate template |
| Change orders earning less than base work | Re-price your change order markup; they carry extra admin and disruption |
| Margin at close-out more than 3 points under bid | Do a 15-minute post-mortem by cost code and write down one estimating change |
The thresholds are starting points for an example remodeler, not industry standards. Set your own based on job size: a 10% overrun on a $2,000 code is a shrug, while on a $40,000 code it's a meeting. For the month-by-month version of this comparison across a whole business, see our guide to budget vs actual reports, and for the job-level numbers worth tracking every month, our construction KPI guide. Overruns also hit cash before they hit profit; the construction cash flow guide shows how.
Turning job cost exports into a report you'll actually read
Most small contractors have the raw data for job costing. What they lack is an hour a week to export it, line it up against the estimate and look for the outliers. That's the part Parity does.
Parity connects to QuickBooks Online directly, or takes a CSV or Excel export from your construction software. Upload the actual costs by job and cost code with your estimate by code alongside, and describe what you want to see: variance by cost code, margin by job, the jobs that slipped furthest from their bid. It builds a dashboard with the headline numbers and their trends, charts, what explains the changes and a table of what needs attention, such as labor codes running over. Every number is checked against queries on the full dataset before you see it. Refine it by chat ("show change order profit separately"), and next week update it with the newer export. Parity doesn't set your burden rate or your cost codes; those are your decisions, and the report is only as good as them.
Upload your job cost export and your estimates, and get a checked dashboard of variance by cost code and margin by job. Upload your job cost report
Start with one job. Code its hours and bills, cost labor at the burdened rate, and compare it with the estimate line by line when it closes. The first post-mortem usually changes the next estimate, and that's where the money comes back.