"We were busier." That was the owner's answer when the bank asked why Arbor Tree Care's EBITDA rose from $412,000 in 2024 to $439,520 in 2025. Arbor, an example tree service we'll use throughout this guide, did do 80 more jobs. But once the change was split into its causes, the extra jobs and the change in which jobs they were took $9,600 off EBITDA between them. Prices added $99,000, and higher crew and equipment costs gave half of that back.
That split is an EBITDA bridge: a breakdown of the change in EBITDA between two periods into price, volume, mix, direct costs and overheads, usually drawn as a waterfall chart. This guide builds Arbor's year-on-year bridge from the raw inputs, gives the spreadsheet formula for each bar, explains the mix effect people usually leave out, and covers what to do about each bar once you can see it. For the definition of EBITDA itself, see what EBITDA is.
What an EBITDA bridge shows
Here's the finished bridge. It starts at 2024 EBITDA, ends at 2025 EBITDA, and every bar between them is one cause, in dollars.
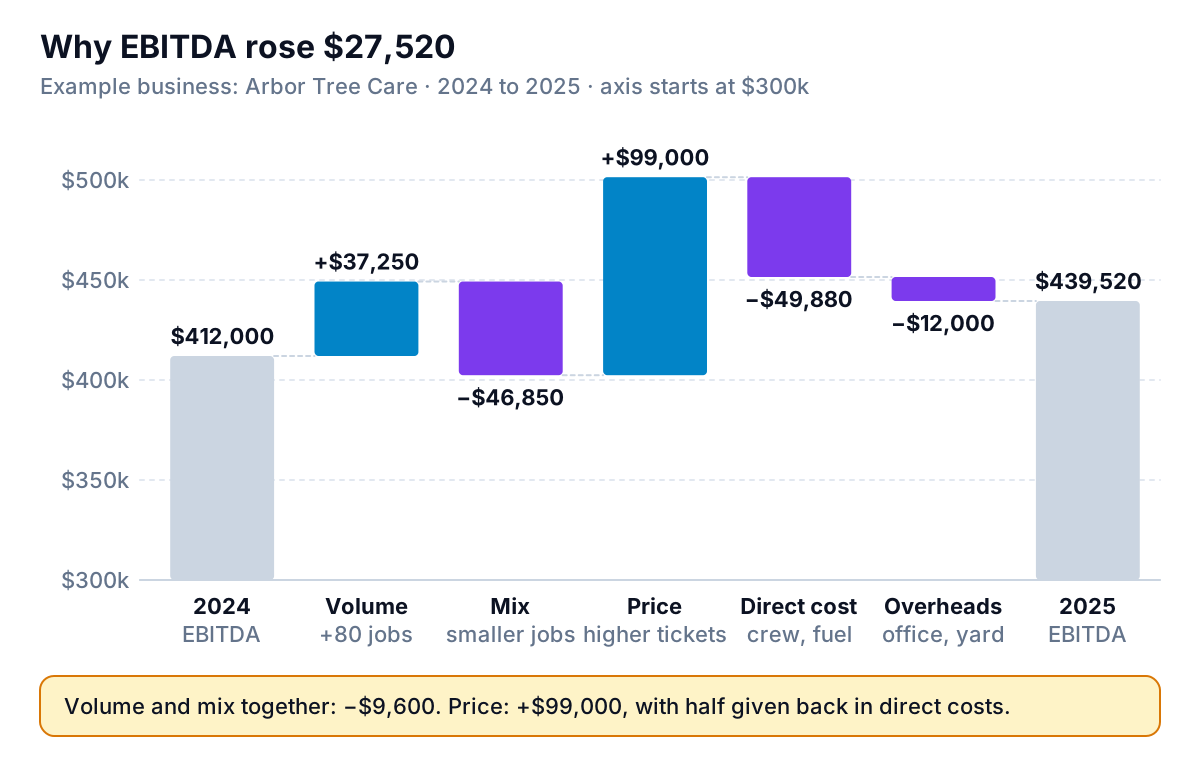
Read left to right, it tells a story the P&L can't:
- Volume (+$37,250): 80 more jobs, valued at what an average 2024 job earned.
- Mix (−$46,850): the extra jobs were mostly plant health care visits, which earn far less per job than removals, and removals fell.
- Price (+$99,000): average tickets rose on every service line.
- Direct costs (−$49,880): crew pay, fuel and disposal per job rose too.
- Overheads (−$12,000): office, yard, insurance and the owner's salary grew.
A bridge is different from comparing EBITDA margins year to year. Our guide to EBITDA margin explains a change in margin by cost line, in percentage points. A bridge explains the change in EBITDA dollars by cause, so it can separate "we charged more" from "we sold a different mix" when both show up as the same revenue line.
The inputs: jobs, price and direct cost by service line
An EBITDA bridge needs three numbers for each product or service line, for both years: units sold (here, jobs), average price per unit, and variable cost per unit. Plus total overheads for each year. Arbor has three service lines.
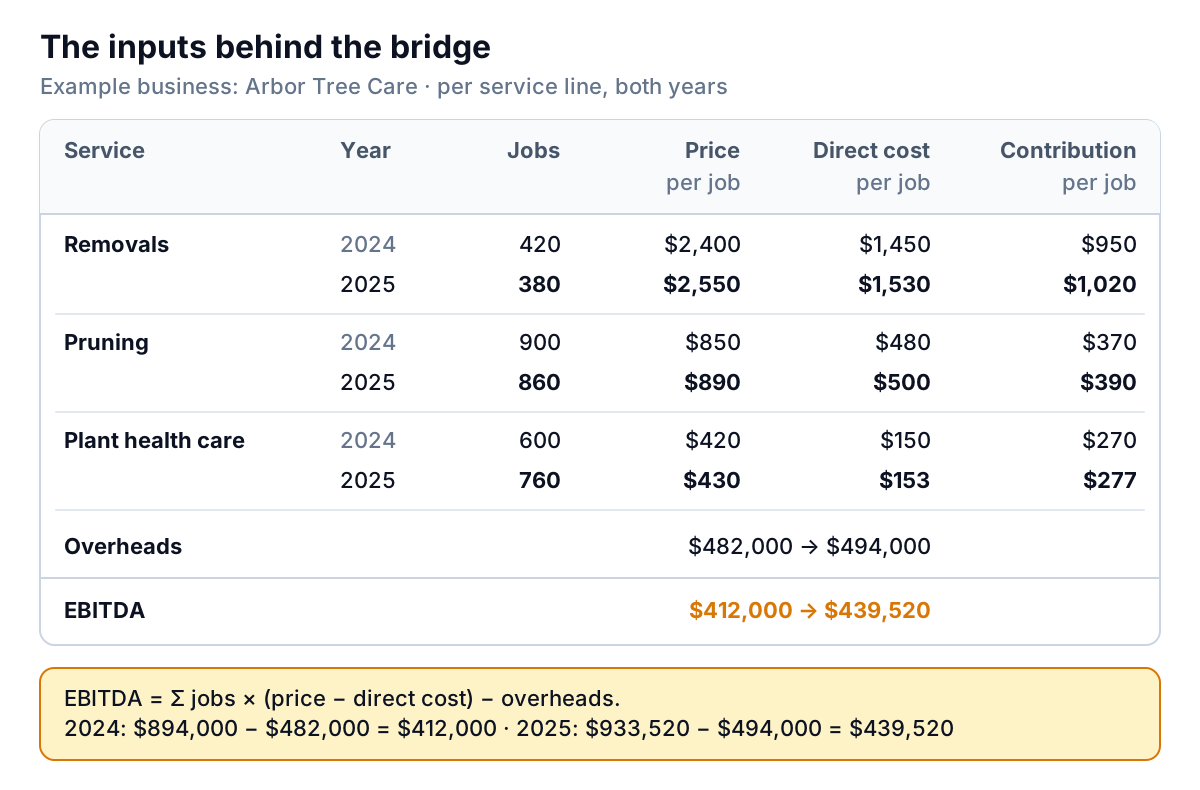
Contribution per job is price minus direct cost: what each job leaves to pay overheads. In 2024 a removal left $950, a pruning job $370 and a plant health care visit $270. Multiply by jobs, add up, subtract overheads, and you get EBITDA: $894,000 − $482,000 = $412,000 in 2024, and $933,520 − $494,000 = $439,520 in 2025. If your table doesn't reproduce the EBITDA on your P&L, fix that before you build anything else.
Where to get the inputs:
- Jobs and revenue by service. Field-service and job-management tools usually export completed jobs with a service type and amount. In QuickBooks Online, the Sales by Product/Service Detail report lists each sale by product or service, which you can count and total per line, provided your invoices use separate products or services for each kind of work.
- Direct cost per job. Crew labour, fuel, disposal fees and equipment rental for the job. If you track job costs, export them. If not, split your direct cost accounts across service lines using crew hours, and write down the rule you used.
- Overheads. Everything else above EBITDA on the P&L: office staff, yard rent, insurance, marketing, software, owner's salary.
Working out each bar of the EBITDA bridge
Each bar holds one thing constant and changes another. The convention used here, one of several, measures price and cost changes on this year's jobs, and volume and mix at last year's contribution per job. Because of that ordering, the bars add up exactly to the change in EBITDA with nothing left over.
Volume: how many more jobs
Volume = (jobs this year − jobs last year) × last year's average contribution per job
Arbor did 2,000 jobs in 2025 against 1,920. The 2024 average contribution was $894,000 ÷ 1,920 = $465.63. So 80 × $465.63 = +$37,250. This is what the extra jobs would have earned if they'd looked like an average 2024 job.
Mix: which jobs
Mix = for each line, (this year's jobs − total jobs this year × last year's share of jobs) × last year's contribution per job, summed
At the 2024 mix, 2,000 jobs would have been 437.5 removals, 937.5 pruning jobs and 625 plant health care visits. Arbor actually did 380, 860 and 760. Fewer removals at $950 each, fewer pruning jobs at $370, more plant health care at $270: −57.5 × $950 − 77.5 × $370 + 135 × $270 = −$46,850.
Price: what each job was charged
Price = for each line, this year's jobs × (this year's price − last year's price), summed
380 × $150 + 860 × $40 + 760 × $10 = $57,000 + $34,400 + $7,600 = +$99,000.
Direct cost: what each job cost to do
Direct cost = for each line, −(this year's jobs × (this year's cost per job − last year's)), summed
−(380 × $80 + 860 × $20 + 760 × $3) = −($30,400 + $17,200 + $2,280) = −$49,880. Removals carried most of it: bigger crews on bigger trees, a new chipper's fuel and a dump fee increase.
Overheads
Overheads = −(this year's overheads − last year's) = −($494,000 − $482,000) = −$12,000.
Check: $37,250 − $46,850 + $99,000 − $49,880 − $12,000 = $27,520, exactly the change in EBITDA.
The same thing in a spreadsheet
Put service lines in rows 2 to 4: last year's jobs in column B, price in C and cost per job in D; this year's jobs in E, price in F and cost in G. Then:
- Volume:
=(SUM(E2:E4)-SUM(B2:B4))*SUMPRODUCT(B2:B4,C2:C4-D2:D4)/SUM(B2:B4) - Mix:
=SUMPRODUCT(E2:E4-SUM(E2:E4)*B2:B4/SUM(B2:B4),C2:C4-D2:D4) - Price:
=SUMPRODUCT(E2:E4,F2:F4-C2:C4) - Direct cost:
=-SUMPRODUCT(E2:E4,G2:G4-D2:D4) - Overheads: last year's overheads minus this year's, from the P&L.
Add a check cell: this year's EBITDA minus last year's, minus the five bars. It should be zero. If it isn't, a line is missing from the table or the overheads don't match the P&L.
Why mix is the bar people miss
Without a mix bar, Arbor's owner would see 80 more jobs, a volume gain, and stop there. The mix bar is what shows the business drifted towards smaller work.
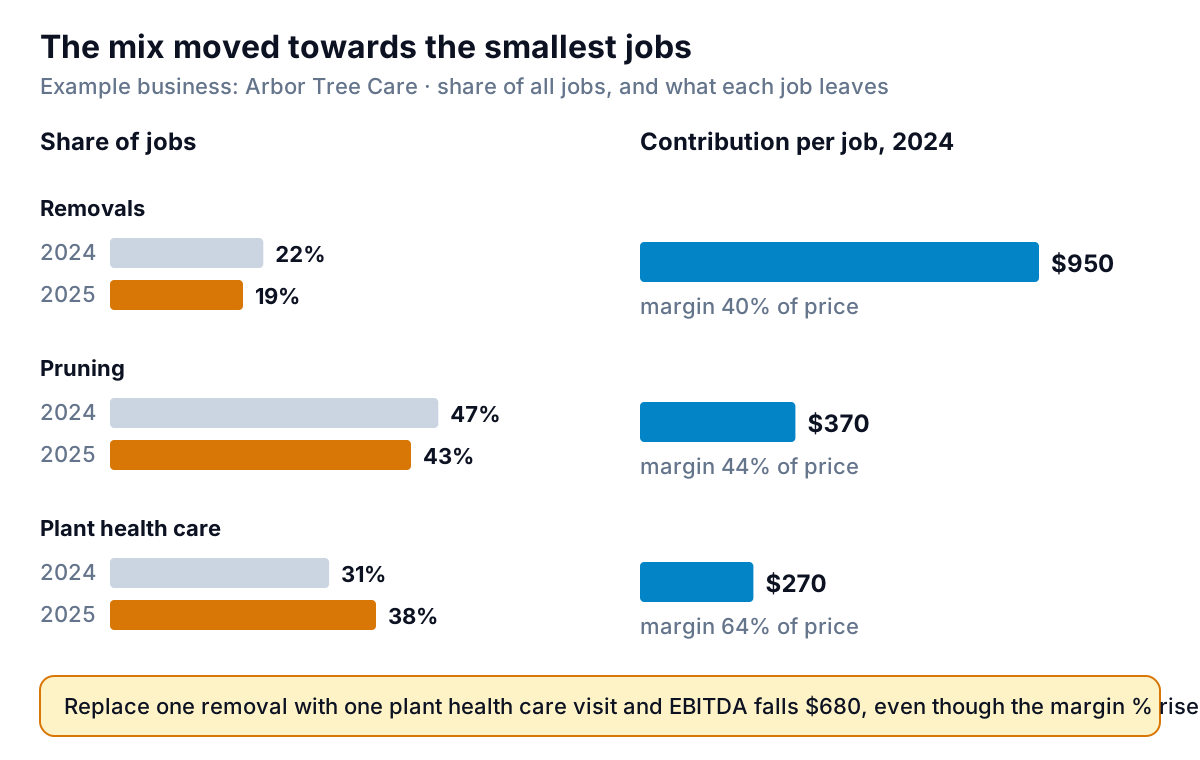
There's a trap here. Plant health care, spraying and feeding trees, has the best margin of the three lines: 64% of each visit's price is left after direct cost, against 40% for removals. On margin percentage, more of it looks like good news. But a visit leaves $270, and a removal leaves $950, so each removal replaced by a plant health care visit costs $680 of EBITDA. The bridge measures mix in contribution dollars per job, which is why it catches this.
FTI Consulting, in its paper on price-volume-mix analysis, calls mix "often overlooked, misunderstood, and not calculated correctly", and recommends working at the most detailed level you can: if you group products, mix shifts inside a group show up as price changes instead. For Arbor, splitting removals into small and crane removals would be the next step if the removals line starts to move.
Mix isn't automatically bad. Plant health care visits are often booked as recurring programmes, fill gaps between big jobs and need smaller crews. The owner may want more of them. The bridge just makes the cost of that choice visible: $46,850 of EBITDA in 2025.
Choices that change the bars
There's no single official method for an EBITDA bridge, so two analysts can produce different bars from the same books. FTI's paper, for example, measures price on last year's volume, where this guide uses this year's. The total is always the same; the split between bars moves a little. What matters:
- Pick one convention and keep it. Write it on the chart or in a note, and use it every year so bars are comparable.
- Keep one-offs as their own bar. A storm-cleanup contract, an insurance payout or a one-time legal bill would otherwise land in price or overheads and distort them. Give it a labelled bar.
- Match the periods. Full year against full year, or trailing twelve months against the twelve before. A bridge from a seasonal quarter to a different quarter mostly measures the weather.
- Use the same cost allocation both years. If you change how you split crew costs between service lines, the direct cost and mix bars will move for reasons that have nothing to do with the business.
The same method works against a budget instead of last year: put the budget's jobs, prices and costs in the "last year" columns. Our budget vs actual guide covers the monthly review it fits into.
Charting it, and what to do with each bar
Excel has a built-in waterfall chart in Microsoft 365 and Excel 2016 and later. Put the labels in one column and the signed values in the next, starting with last year's EBITDA and ending with this year's, insert the waterfall, then set the first and last bars as totals, as Microsoft's help page shows. Our waterfall chart in Excel guide walks through the formatting and the workaround for older versions.
Order the bars in the order you'd explain them: volume, mix, price, direct cost, overheads, then one-offs. Put the dollar value on every bar, and keep the start and end bars the same colour so the eye reads them as totals.
Then turn each bar into a question for next year:
| Bar | Arbor's 2025 | Question it raises |
|---|---|---|
| Volume | +$37,250 | Was it demand, or did we discount to fill the diary? |
| Mix | −$46,850 | Why did removals fall? Lost bids, crew capacity or fewer storms? |
| Price | +$99,000 | Will it stick? Did we lose removal bids because of it? |
| Direct cost | −$49,880 | Is cost per removal rising faster than its price? Re-quote the big jobs. |
| Overheads | −$12,000 | Did the new office hire pay for itself? |
For Arbor, the useful conversation is between the mix and price bars. Removal prices rose $150 a job, and Arbor won 40 fewer removals. If those were lost on price, the price bar and the mix bar are the same decision seen twice, and the owner should look at win rates on removal quotes before raising prices again.
If you'd rather not rebuild the table every quarter, Parity can do the arithmetic. Connect QuickBooks Online, or upload a CSV or Excel export of jobs or sales by service from any other tool, and it builds a dashboard with the headline numbers and their trends, charts, what explains them and a table of what needs attention. Ask by chat for a year-on-year EBITDA bridge split into volume, mix, price, direct cost and overheads. Every number is checked against queries on the full dataset before you see it, and you can export the chart to PDF for the bank.
Upload your jobs or sales by service with your P&L, and get a checked dashboard with a bridge from last year's EBITDA to this year's. Build a report from your data free
The next time Arbor's banker asks why EBITDA went up, the owner has a better answer than "we were busier": prices rose $99,000, costs took back half, and the business drifted towards smaller jobs. Each part comes with a decision attached for 2026.