A home goods store converts 1.10% of its visits. Good or bad? Next to the median for home and furniture stores in one vendor's Shopify sample (0.9%), it's a little ahead. Next to all the stores in that sample (1.4%), it's behind. Neither answer says what to do. That's the gap between a statistic and an ecommerce KPI: a store number you've chosen to steer by, with a target worked out from your own margins and a decision attached to it. Most of them are simple ratios: conversion rate is orders ÷ sessions, average order value is net sales ÷ orders, and cost per new customer is ad spend ÷ first-time customers.
The ratios are the easy part. Any store platform will calculate them. What it can't tell you is which conversion rate to aim for, how much you can afford to pay for a customer, or when a return rate means a product is broken. Without that, a KPI is just a statistic you glance at.
This guide picks the eight ecommerce KPIs that matter for a small online store and shows where each target should come from: your contribution per order, your own repeat history, your season plan, and, for one or two numbers, a published benchmark that measures the same thing. It follows Goldfinch Home Goods, an example Shopify store selling cushions, lamps, throws and kitchenware. For how to lay those numbers out on a screen, see our ecommerce dashboard guide; this post is about what the numbers should be.
The eight ecommerce KPIs and their targets
Here is Goldfinch's target sheet for September. Every KPI has a target, and every target has a reason written next to it. If you can't write the reason, the target is a guess.
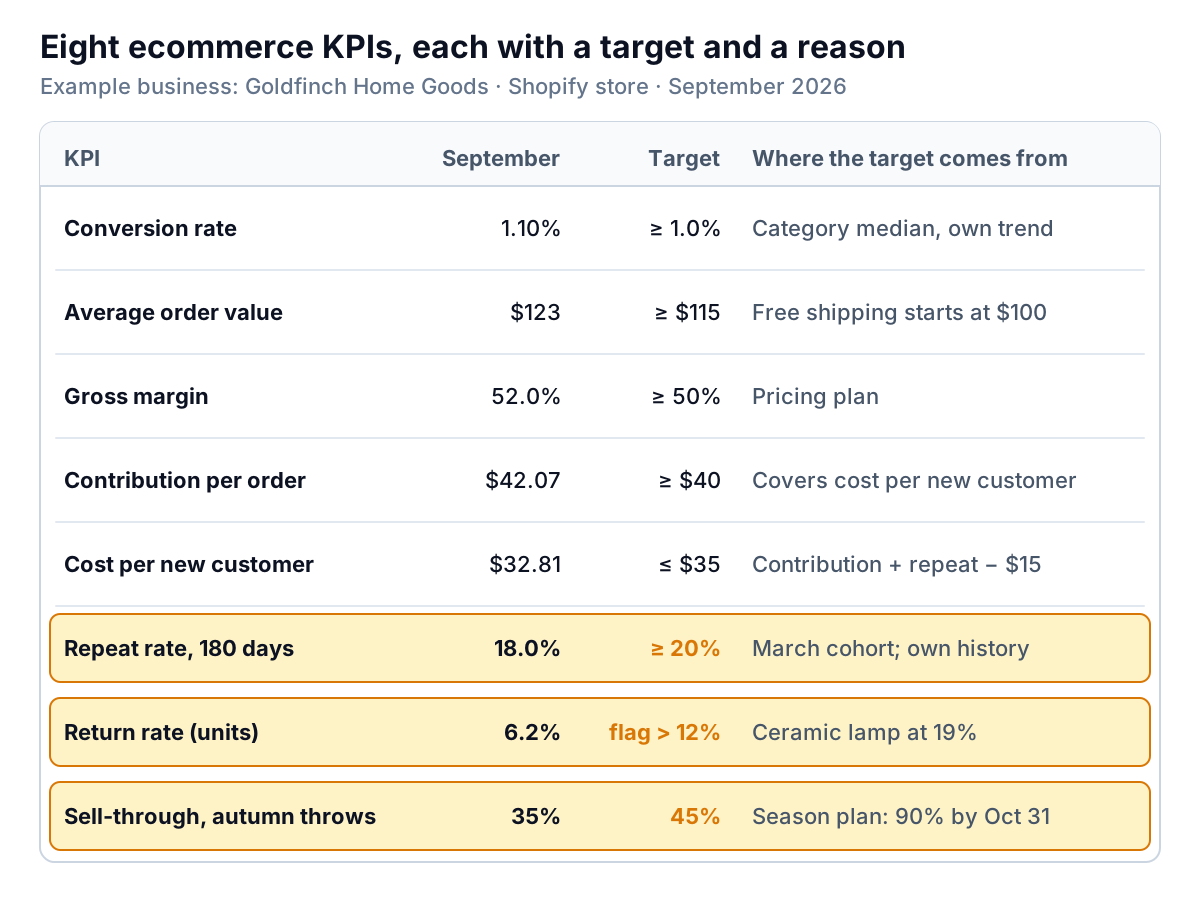
Goldfinch's September in brief: 52,000 sessions, 572 orders, $70,356 of net sales, and $12,600 spent on ads. Those four inputs drive most of the sheet. The rest comes from product costs, returns, and a customer list.
The KPIs fall into three groups. The first four tell you whether each order makes money. The next two tell you whether you can afford to keep buying customers. The last two catch product problems while there's still time to act.
Does each order make money?
Conversion rate and average order value
Goldfinch converted 572 of 52,000 sessions: 1.10%. Its average order value (AOV) was $70,356 ÷ 572 = $123.00. The dashboard guide shows how revenue breaks into sessions × conversion × AOV, so we won't repeat that here. The question for this post is what to aim for.
For conversion, a published benchmark helps if it measures the same thing for similar stores. Littledata, an analytics vendor, publishes a rolling benchmark from the Shopify stores that use its tracking. Its home and furniture benchmark covers 57 stores between July 6 and October 3, 2026, and defines conversion as the share of sessions that included at least one purchase. The median was 0.9% and the top 20% converted above 1.7%. Across all 426 stores in the sample, the median was 1.4%.
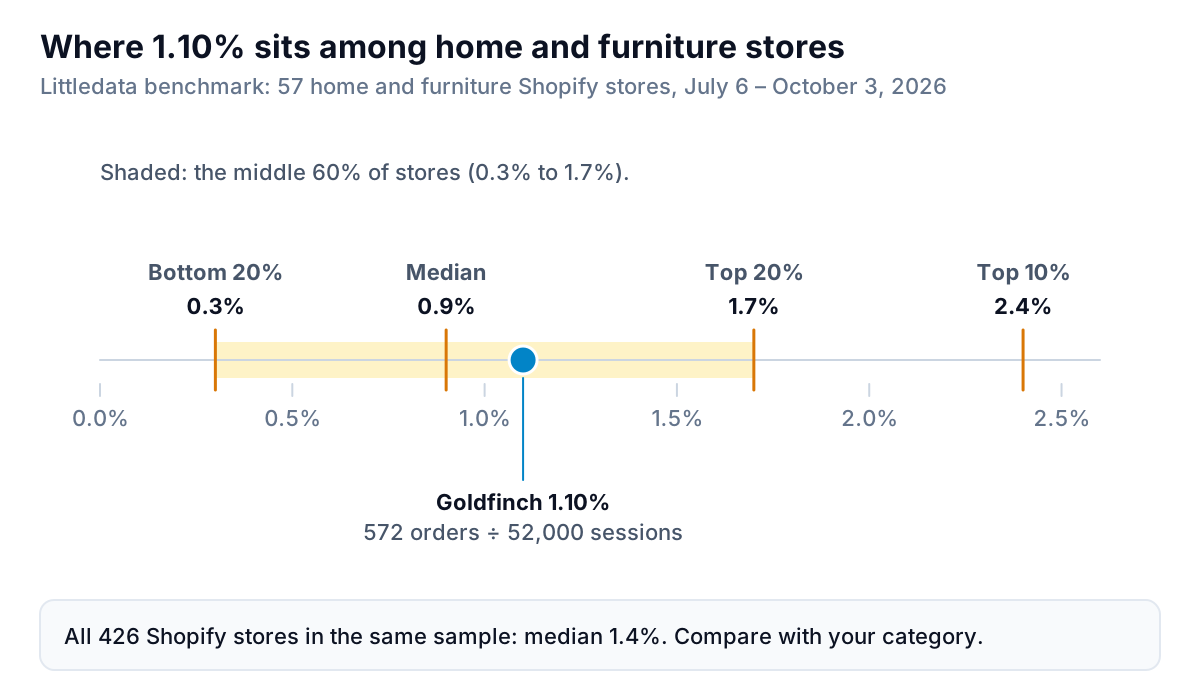
Three cautions before you use this. It's one vendor's customers, not a random sample. The numbers update as the 90-day window moves. And "home and furniture" mixes a $40 candle store with a $2,000 sofa store; that category's median AOV in the same sample was $237, almost twice Goldfinch's. So Goldfinch's target is 1.0%: a little above its category's median, and in line with its own last 12 months. Beating the top 20% isn't the target; staying ahead of its own trend is.
For AOV, the target comes from your shipping policy. Goldfinch offers free shipping from $100, and its packed-and-posted cost per order is about $15. If AOV drifts down toward $100, more orders get free shipping with less margin to absorb it. The $115 target keeps a cushion above the threshold.
Gross margin and contribution per order
Goldfinch's product cost was $33,771, so gross margin was ($70,356 − $33,771) ÷ $70,356 = 52.0%. On Shopify, this only works if every product has a cost entered: Shopify's profit reports state that profit is reported only for products and variants that had cost recorded at the time they were sold. A product with no cost looks like 100% margin.
Contribution per order goes one step further: gross profit minus the costs every order carries. For Goldfinch, that's $36,585 of gross profit, minus $8,580 of shipping and packing, $2,111 of payment fees and $1,830 of return costs, leaving $24,064, or $42.07 per order before advertising. The contribution margin guide explains the idea in general; here it's the number that sets the next target.
Can you afford the customers you're buying?
Cost per new customer, with a ceiling
Goldfinch spent $12,600 on ads in September and gained 384 first-time customers, so each new customer cost $32.81. The useful question isn't whether that's high; it's what the ceiling should be. Build it from your own numbers:
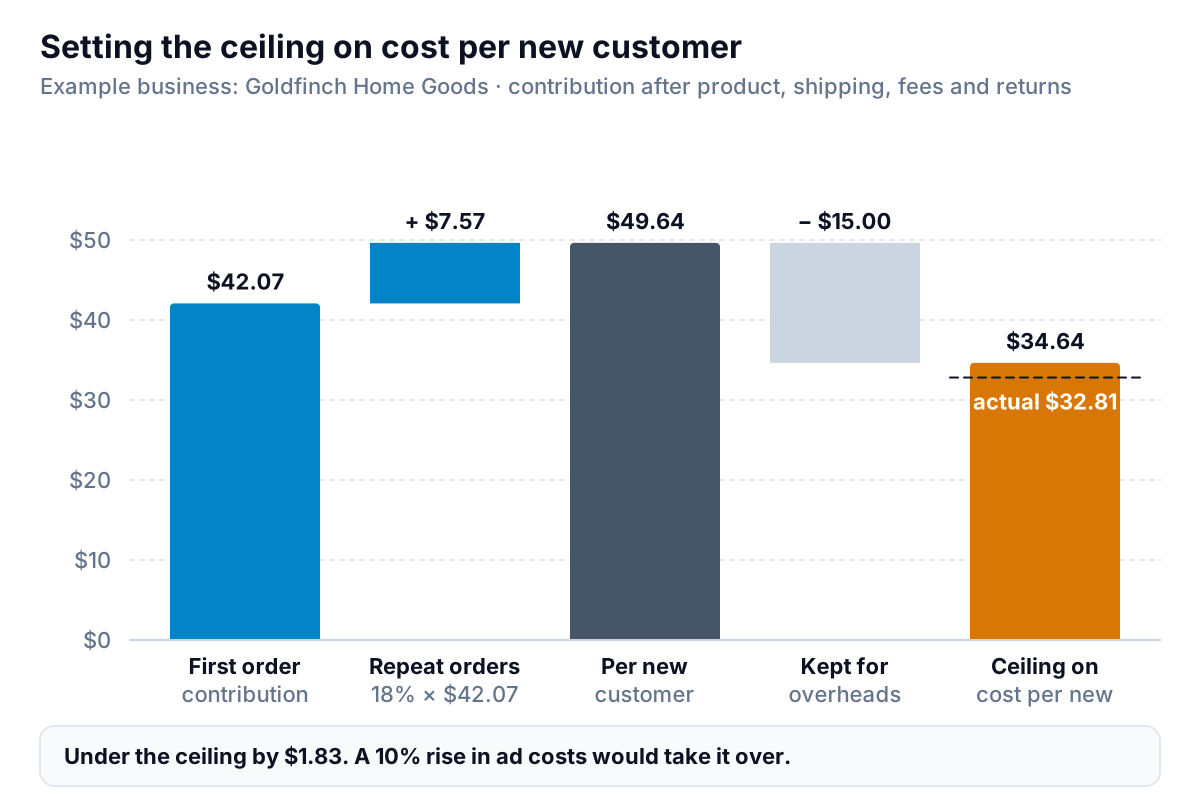
- First-order contribution: $42.07, assuming a first order looks like an average one. If your first orders are smaller, use their own average.
- Add expected repeat contribution: 18% of new customers order again within 180 days (see below), so add 18% × $42.07 = $7.57. Total: $49.64.
- Subtract what you need to keep: Goldfinch wants each new customer to leave $15 toward overheads such as rent, software and wages. Ceiling: $34.64.
At $32.81, Goldfinch is under the ceiling by $1.83, which is thin: a 10% rise in ad costs would take it over. The decision rule follows directly. If cost per new customer runs above the ceiling for two months, cut the campaigns with the highest cost per first order, not the whole budget. If it runs well below, there's room to spend more.
Use 180 days of repeat, not "lifetime value". A small store rarely has the history to know lifetime value, and money you might collect in three years shouldn't justify ad spend today.
Repeat rate, measured by cohort
Shopify's analytics define returning customer rate as the percentage of returning customers relative to all customers who placed orders in the period. That's useful, but it moves whenever new-customer volume moves: a big acquisition month makes it fall even if loyalty didn't change.
For a target, measure a cohort instead: of the customers whose first order came in a given month, what share ordered again within 180 days? Goldfinch's March cohort had 410 first-time customers, and 74 of them ordered again by the end of September: 18.0%. Its target is 20%, based on its better cohorts last year. Our cohort analysis guide shows how to build the table in a spreadsheet.
Below target, the fixes are about the second order: a follow-up email when a product is likely to need replacing or matching, a reason to come back for the next season's range, or a better unboxing. Track each cohort, so you can see whether a change helped the customers it was aimed at.
Is the product mix working?
Return rate, by product
Goldfinch sold 1,430 units in September and 89 came back: a 6.2% return rate. The store-wide figure matters less than the outliers. Goldfinch's rule is to flag any product returned at more than twice the store rate, once it has sold at least 20 units. That flagged a ceramic table lamp: 12 of 63 returned, 19%. The return reasons said "arrived broken", so the fix is packaging, not the product page. Without the per-product view, a 19% problem hides inside 6.2%.
Sell-through on seasonal stock
Sell-through = units sold ÷ units received, for a batch of stock over a set period. Goldfinch received 600 autumn throws on September 1 and wants 90% sold by October 31, when winter stock takes the space. That's roughly 45% by the end of September. It sold 210: 35%.
The rule: if a seasonal line is more than 10 points behind plan halfway through its season, act now. Move it to the home page and email list, bundle it with a best seller, or start a modest markdown. A 20% markdown in week five costs far less than a 50% clearance in week ten, plus the storage. For stock that isn't seasonal, track days of stock left instead; our dashboard guide covers that one.
Reviewing your ecommerce KPIs: a monthly routine
Most of these numbers come from your store platform's reports and its customer and order exports. Ad spend comes from each ad account or your accounting software, and shipping and fees from your carrier and payment processor statements. If you're on Shopify, our guide to Shopify reports shows which report holds which number.
Review monthly, in this order:
- Contribution per order. If it fell, find which cost grew: product, shipping, fees or returns.
- Cost per new customer against the ceiling. Recalculate the ceiling every quarter, because it moves with contribution and repeat rate.
- Repeat rate for the cohort that just reached 180 days.
- Product flags: return outliers and seasonal lines behind plan, each with an owner and a decision.
- Conversion and AOV against your own trend, and against a category benchmark once a year.
Mistakes that make ecommerce KPIs mislead
- Targets copied from the internet. A conversion rate that's typical for supplements is a fantasy for furniture. Use a benchmark only if its category, definition and sample fit your store.
- Revenue-based targets for ad spend. A return-on-ad-spend target that ignores your margin can approve campaigns that lose money. Set the ceiling from contribution.
- Missing product costs. Margin and contribution are wrong if some products have no cost entered.
- Period repeat rates. Use cohorts, or acquisition swings will look like loyalty changes.
- Store-wide averages for product problems. Returns and sell-through need to be read per product.
Turning the target sheet into a dashboard
You can keep this sheet in a spreadsheet, filled from monthly exports. It works if someone does it every month without fail. Parity connects to Shopify, Stripe and Square directly, and takes a CSV or Excel export of anything else, such as ad spend or carrier invoices. It builds a dashboard with the headline numbers and their trends, charts, what explains them, and a table of what needs attention, and every number is checked against queries on the full dataset before you see it. You can ask it by chat for exactly this sheet: "contribution per order, cost per new customer against a $35 ceiling, 180-day repeat rate by first-order month, and products returned at more than twice the store rate". You can save it as a template for next month and share a read-only link with a business partner.
Connect your store and get a checked dashboard of contribution, customer cost, repeat rate and product flags. Connect your store free
Goldfinch's September comes down to three actions, all visible on the sheet: repack the lamp, push the autumn throws before October, and give March's customers a reason to come back. None of those came from the headline revenue. They came from KPIs with targets and reasons attached.