Two cents. That's what Greenleaf Neighborhood Market, an independent grocery store we'll use as an example here, kept from every dollar that crossed its checkout last year: $191,040 of pretax profit on $9.6 million of sales. A grocery store profit margin is pretax profit ÷ sales, so Greenleaf's is $191,040 ÷ $9,600,000 = 2.0%. A café owner would call that a disaster. A grocer calls it a normal year.
Thin margins are the defining fact of grocery, and they change how you should run the store. This guide explains why the margin is so thin, what the latest industry studies say it is, and the three things that decide whether a grocer makes 0.5% or 6%: department mix, shrink and how fast inventory turns.
Why the grocery store profit margin is so thin
The gross margin in grocery isn't small. Greenleaf keeps 28.5 cents of every dollar after paying for the goods it sold. The problem is that running a store eats almost all of it: long opening hours, a lot of staff, refrigeration, a large building and card fees on nearly every sale.
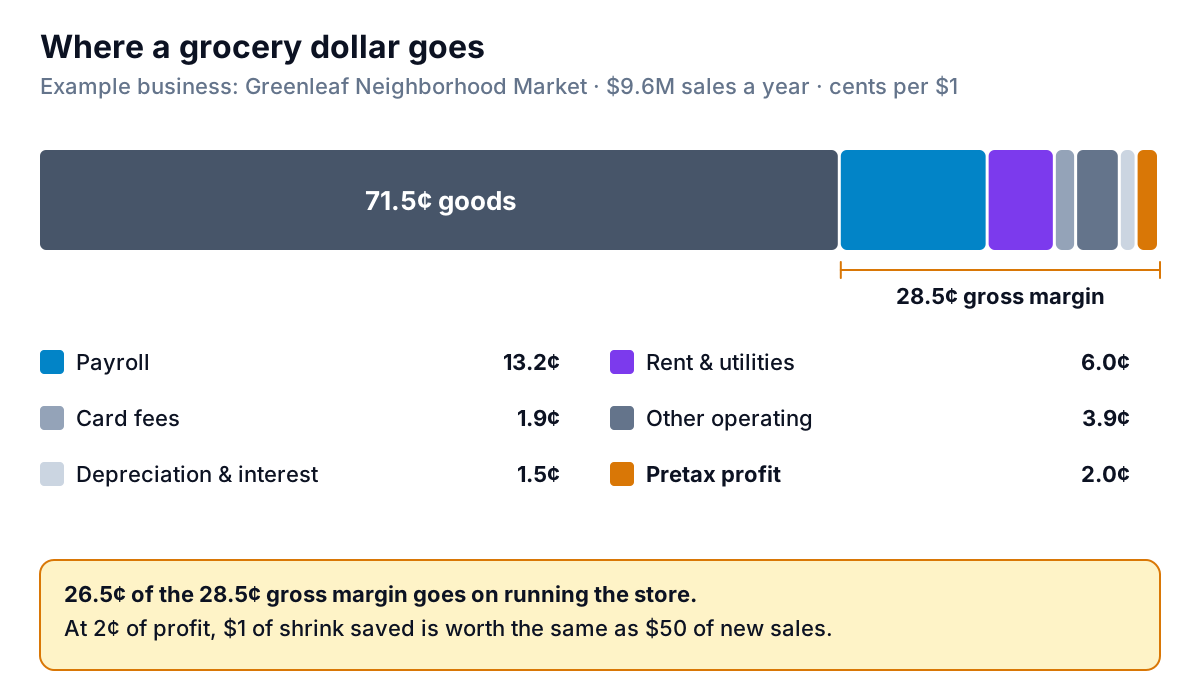
Here's the same year in dollars:
| Line | Annual | % of sales |
|---|---|---|
| Sales | $9,600,000 | 100.0% |
| Cost of goods sold (after known shrink) | $6,864,960 | 71.5% |
| Gross margin | $2,735,040 | 28.5% |
| Payroll, payroll taxes and benefits | $1,267,200 | 13.2% |
| Rent, property tax and common charges | $432,000 | 4.5% |
| Card processing fees | $182,400 | 1.9% |
| Admin, insurance and professional fees | $153,600 | 1.6% |
| Utilities | $144,000 | 1.5% |
| Supplies and bags | $76,800 | 0.8% |
| Repairs and maintenance | $76,800 | 0.8% |
| Advertising | $67,200 | 0.7% |
| Depreciation | $115,200 | 1.2% |
| Interest | $28,800 | 0.3% |
| Pretax profit | $191,040 | 2.0% |
If you're new to the gross margin line, our guide to calculating gross margin walks through it, and margin vs markup explains why a 40% markup on a case of cereal is only a 28.6% margin.
What the industry numbers say
Three sources measure grocery margins regularly. They measure slightly different things, so read the definitions before you compare.
- Net profit, all food retailers. FMI, the food industry association, reports that average net profit for food retailers was 2.1% in 2025, from its annual survey of retailers, The Food Retailing Industry Speaks. FMI's 2026 summary calls that "up slightly" on the year before.
- Net profit before taxes, independents. The 2026 Independent Grocers Financial Study by FMS Solutions and the National Grocers Association, covering fiscal 2025 for 503 independent operators running nearly 2,000 stores, found average net profit before taxes of 2.20%, up from 1.90%. Total store gross margin was 27.9%, up from 27.4% (The Shelby Report; further results in an FMS-written summary). The full study is sold, not published, so these come from those two articles.
- Gross margin, all grocery stores. The Census Bureau's Annual Retail Trade Survey puts gross margin for grocery stores (NAICS 4451) at 28.0% of sales in 2022, its latest benchmarked year, up from 27.3% in 2021. This is a government estimate covering chains and independents alike.
So a grocery store profit margin of around 2% is the norm, on gross margins in the high 20s. Greenleaf's 28.5% gross margin and 2.0% pretax profit sit right in that range.
The average hides a huge spread, though. In the FMS/NGA study, the top quarter of independents averaged 6.7% net profit before taxes. The other three-quarters averaged 0.56%.
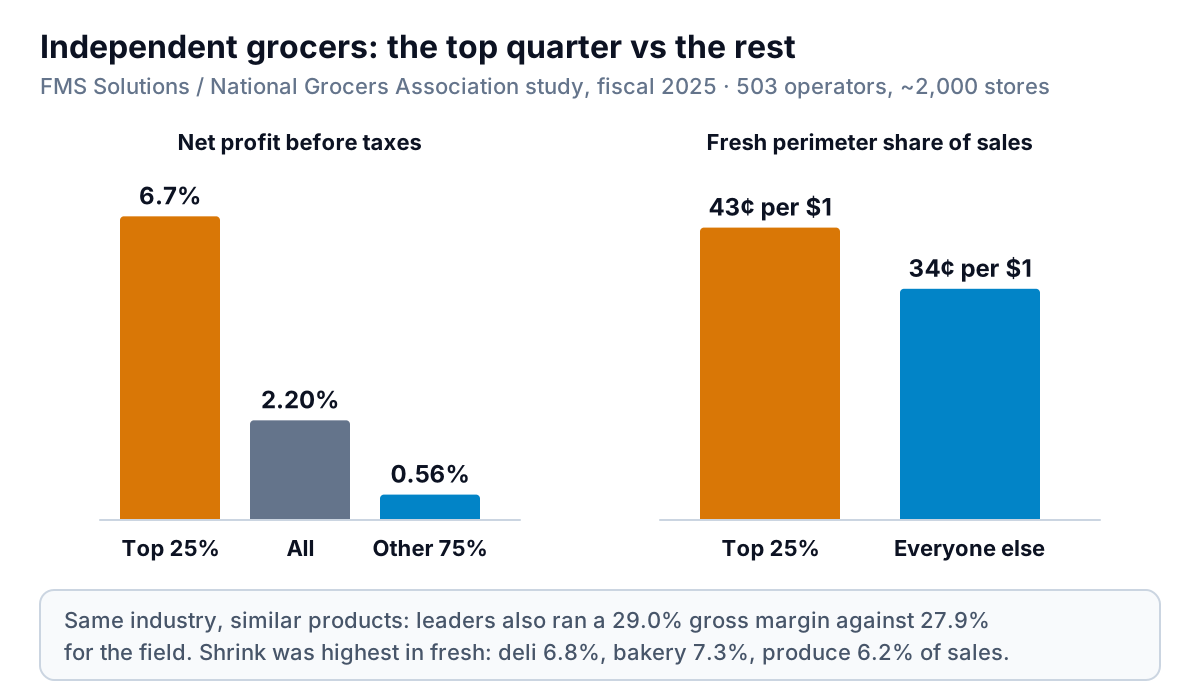
The study's summary points to what separates them: leaders take about 43 cents of every sales dollar from fresh perimeter departments, against 34 cents for everyone else, and run a 29.0% gross margin against the field's 27.9%. That leads to the first lever.
Department margins: where the money is made
A grocery store is several businesses under one roof, each with its own margin. Here's Greenleaf's, with gross margin after known shrink:
| Department | Sales | Share | Gross margin | Gross margin $ | Avg inventory at cost |
|---|---|---|---|---|---|
| Center-store grocery | $3,840,000 | 40% | 23% | $883,200 | $230,000 |
| Meat and seafood | $1,536,000 | 16% | 28% | $430,080 | $38,000 |
| Dairy and frozen | $1,440,000 | 15% | 26% | $374,400 | $55,000 |
| Produce | $1,248,000 | 13% | 35% | $436,800 | $22,000 |
| Deli and prepared foods | $768,000 | 8% | 42% | $322,560 | $18,000 |
| Health, beauty and general merchandise | $480,000 | 5% | 33% | $158,400 | $60,000 |
| Bakery | $288,000 | 3% | 45% | $129,600 | $7,000 |
| Store | $9,600,000 | 100% | 28.5% | $2,735,040 | $430,000 |
Center store is 40% of Greenleaf's sales and the lowest margin, because shoppers compare those prices with every chain and online seller. Fresh departments (produce, meat, deli and bakery) are 40% of sales and earn higher margins, because customers choose a store for its fresh food and compare those prices less.
Margin percentage only tells half the story. The other half is how much stock a department needs to earn it.
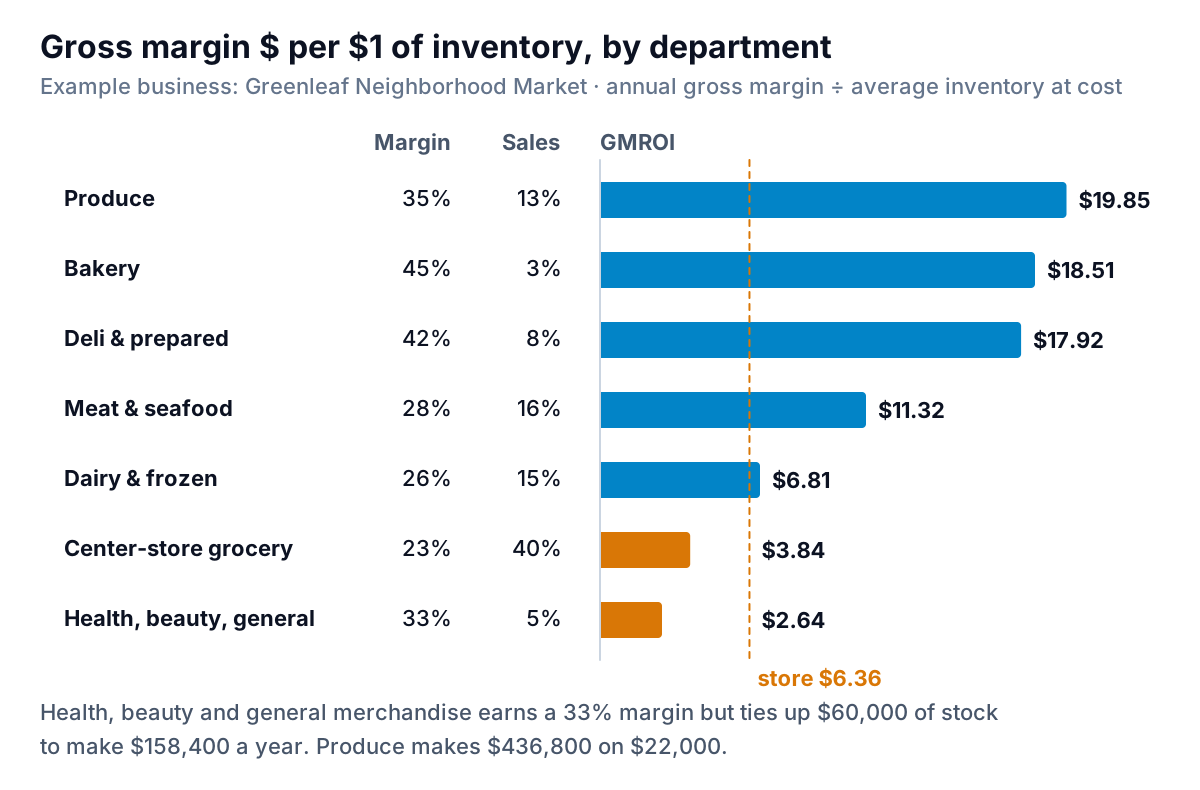
GMROI is annual gross margin dollars divided by average inventory at cost. Greenleaf's store-wide figure is $2,735,040 ÷ $430,000 = $6.36: every dollar tied up on the shelves earns $6.36 of gross margin a year. Produce earns $19.85, because it sells out every few days. Health, beauty and general merchandise has a respectable 33% margin but earns only $2.64 per dollar of stock, because that stock sits for weeks. That's a case for cutting slow items in that aisle and giving the space to something that sells.
Shrink: the line that decides the year
Shrink is inventory you paid for and couldn't sell: spoilage, damage, theft, markdowns gone too far and receiving errors. In the FMS/NGA study, shrink rose from 3.5% to 3.9% of sales in fiscal 2025, higher than the average net profit of 2.20%. It was worst in the fresh departments: deli 6.8%, bakery 7.3% and produce 6.2% of department sales.
At a 2% margin, the arithmetic is brutal. Greenleaf's produce shrink runs at 7.5% of produce sales, or $93,600. Bringing it down to the study's 6.2% saves 1.3% of $1,248,000: $16,224 a year, all of it profit. To earn the same $16,224 through growth at a 2% net margin, Greenleaf would need more than $800,000 of extra sales.
How to get shrink under control:
- Measure it by department, every period. Shrink is book inventory (what your records say should be there) minus counted inventory, at cost. Store-wide shrink hides the department that's bleeding.
- Record known shrink as it happens. Have staff scan out spoiled and damaged items with a reason code. Known shrink tells you what to fix; unknown shrink (the gap at count time) tells you where to look.
- Order to sales, not to the shelf. Most fresh shrink starts with an order that was too big for the week's demand.
- Mark down earlier and smaller. A 30% markdown two days before the date sells more than a 50% markdown on the last day, and loses less.
Inventory turns: why a 2% margin can still be a good business
A 2% margin sounds weak until you add speed. Greenleaf's cost of goods sold was $6,864,960 on an average inventory of $430,000, so the store turned its inventory 16 times last year. The FMS/NGA study's average was 16.1 turns in fiscal 2025, down from 17.8 the year before and the lowest in several years.
Turns matter because inventory is cash sitting on a shelf. A store that turns its stock 16 times a year gets that cash back roughly every three weeks, sometimes before the supplier invoice is due. A slower store needs more cash for the same sales. When turns fall, check:
- Center store variety creep. New items added without old ones removed.
- Forward buying. Deals bought in bulk that take months to sell through.
- Slow non-food. At Greenleaf, health, beauty and general merchandise turns about 5 times a year against the store's 16.
Our inventory dashboard guide shows how to put turns, stock on hand and slow movers on one page.
Decision rules for a grocer
- Judge every department by gross margin dollars and GMROI, not margin percentage alone. A 45% margin department that sells little matters less than a 28% one that sells a lot.
- Treat shrink above your net margin as an emergency. If a department's shrink is more than double the store's net margin, fix ordering there before anything else.
- Grow fresh before center store. Fresh brings higher margins and is the reason customers choose an independent; center store is where you match prices.
- Count the cost of growth. Extra sales at a 2% margin add little profit. A new department needs to earn its space, staff hours and shrink.
- Watch payroll per sales dollar weekly. At 13.2% of sales, it's the biggest cost you control week to week.
Mistakes that hide the real margin
- Using purchases as cost of goods. A month with a big forward buy looks like a margin collapse; the next looks like a record. Cost of goods is opening inventory plus purchases minus closing inventory.
- Booking vendor allowances in the wrong month. Rebates and promotional allowances can be large next to a 2% margin. Record them against the period whose sales earned them, or margins swing for no reason.
- Counting at retail in one department and at cost in another. Pick one basis for each department and keep it, or GMROI and shrink stop being comparable.
The same measures work in any shop that carries stock; our retail KPI guide applies GMROI and sell-through to a small specialty store.
Getting the numbers from your own systems
The inputs for all of this already exist: sales by department from the POS, purchases from supplier invoices, inventory from your counts or perpetual inventory system, shrink from scan-outs and counts, and payroll and overheads from your accounting software. Many grocery POS and back-office systems export department sales and movement reports to CSV. The hard part is putting them side by side every period.
Parity connects QuickBooks Online directly, or takes a CSV or Excel export from your POS, inventory or back-office system, and builds a dashboard from it: headline numbers with their trends, charts, what explains them, and a table of what needs attention, such as the department whose shrink jumped this period. Every number is checked against queries on the full dataset before you see it. You can refine it by chat ("show GMROI by department", "shrink as a share of sales by week"), save it as a template and update it with next period's files. When you ask, it writes the report for your partners or lender from the same data.
Upload your department sales, inventory and shrink exports and get a checked grocery dashboard. Build a report from your data free
A grocery store profit margin of 2% leaves almost no room for error, and that's the point. When each dollar of shrink is worth $50 of sales, the store that measures its departments every week is the one that ends up in the top quarter.