The door counter at Paperbark Stationery, a small independent shop we'll use as an example in this guide, logged 300 fewer visitors this September than last, yet the till took 6.7% more. The reason shows up in a retail KPI (key performance indicator), a number tracked the same way every period against a target: conversion rate, or transactions ÷ visitors, rose from 26.0% to 29.0%.
That's the short answer to "what is a KPI in retail". The longer answer is which ones to track. A big chain watches dozens. A shop with one till and 1,200 square feet needs about eight, chosen so that each one points to something you can change. This guide sets out those eight, with formulas, a worked example from Paperbark, where each number lives in your POS, and what to do when it moves.
Three groups of retail KPIs
Every useful retail KPI answers one of three questions:
- Why did sales change? Traffic, conversion rate, average transaction value and units per transaction. Multiply the first three and you get sales.
- Is the space and staff earning its keep? Sales per square foot and sales per labor hour.
- Is the stock earning its keep? Gross margin, sell-through, GMROI and weeks of supply.
Here's Paperbark's set for September, with the last twelve months where a month is too short to judge:
| KPI | Formula | Paperbark |
|---|---|---|
| Traffic | Visitors counted at the door | 4,800 (Sept) |
| Conversion rate | Transactions ÷ visitors | 29.0% |
| Average transaction value (ATV) | Net sales ÷ transactions | $31.50 |
| Units per transaction (UPT) | Units sold ÷ transactions | 2.5 |
| Sales per square foot | Last 12 months' net sales ÷ selling area | $390 |
| Sales per labor hour | Net sales ÷ staff hours worked | $84.32 (Sept) |
| Gross margin | (Net sales − cost of goods sold) ÷ net sales | 52.0% (12 months) |
| Sell-through | Units sold ÷ units received, for a line or delivery | 18% for the 2027 planners after 8 weeks |
| GMROI | Gross margin $ ÷ average inventory at cost | $3.12 (12 months) |
| Weeks of supply | Inventory at cost ÷ average weekly cost of goods sold | 18 weeks |
That's ten lines, but traffic, conversion, ATV and UPT read as one block, so it's eight things to think about.
Sales KPIs: traffic, conversion and average transaction
Sales on their own don't tell you what to fix. Split them into the retail sales equation instead:
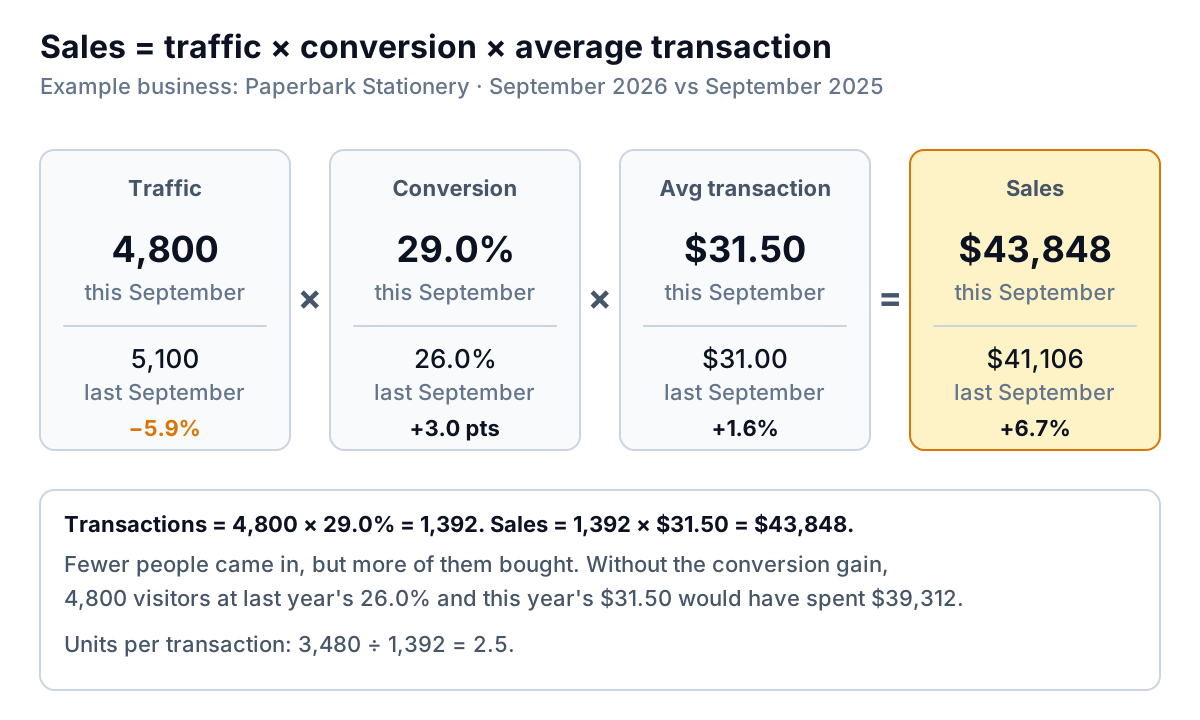
At Paperbark, 4,800 visitors × 29.0% conversion = 1,392 transactions, and 1,392 × $31.50 = $43,848. A year earlier, 5,100 × 26.0% = 1,326 transactions at $31.00 = $41,106.
Each part of the equation has its own causes and its own fixes:
- Traffic is about getting people through the door: the window, the street, local events, Instagram, the weather. A door counter is the only reliable source. Without one, you can't calculate conversion, and you'll misread every slow week.
- Conversion rate is about what happens inside: whether the item they wanted was in stock, whether someone greeted them, whether the queue was short. Paperbark's rose after it moved the bestselling notebooks to the front and added a second person on Saturdays.
- Average transaction value moves with price and with units per transaction. Paperbark's UPT of 2.5 (3,480 units ÷ 1,392 transactions) is where a card-by-the-till or "pen to go with that notebook" habit shows up.
Decision rule: compare each part with the same month last year. If traffic is down and conversion is up, as at Paperbark, the shop is doing its job with fewer people, so spend effort on getting people in. If traffic is up and conversion is down, look inside the shop first: stock gaps, staffing at peak hours, the queue.
Space and staff: sales per square foot and per labor hour
Sales per square foot is twelve months of net sales divided by selling area (the floor customers can walk, not the stockroom). Paperbark's is $468,000 ÷ 1,200 = $390. Use a rolling twelve months, because a single month swings with the season.
The number is most useful in two places: comparing sections of your own shop (if the card wall earns twice the gift table per foot, the gift table is too big) and judging a lease. If a new space would raise rent per square foot by more than you can expect to raise sales per square foot, the move is a cost, not an upgrade.
Sales per labor hour is net sales ÷ staff hours. Paperbark worked 520 hours in September: $43,848 ÷ 520 = $84.32. Break it down by day and hour once a quarter. A Tuesday morning at $30 an hour next to a Saturday afternoon at $160 tells you where the second person belongs.
We haven't found current, published figures for either measure that define them the same way for small specialty shops, so set your targets from your own best twelve months.
Inventory KPIs: gross margin, sell-through and GMROI
For most small shops, the money is tied up on the shelves. These KPIs tell you whether that stock is paying for itself.
Gross margin
Paperbark's gross margin over the last twelve months is 52.0%: $243,547 of gross margin on $468,000 of sales. For context, the Census Bureau's Annual Retail Trade Survey estimated gross margin at 53.6% of sales in 2022 for miscellaneous store retailers, the group (NAICS 453) that includes office supply, stationery and gift stores along with florists, used merchandise and other specialty shops. It's a broad group, so treat it as a rough reference. If gross margin is new to you, our guide to calculating gross margin covers it, including why a 100% markup is a 50% margin.
GMROI
Gross margin return on inventory investment: gross margin dollars ÷ average inventory at cost. It tells you how many dollars of gross margin each dollar of stock earns in a year. Paperbark's store-wide figure is $243,547 ÷ $78,000 = $3.12.
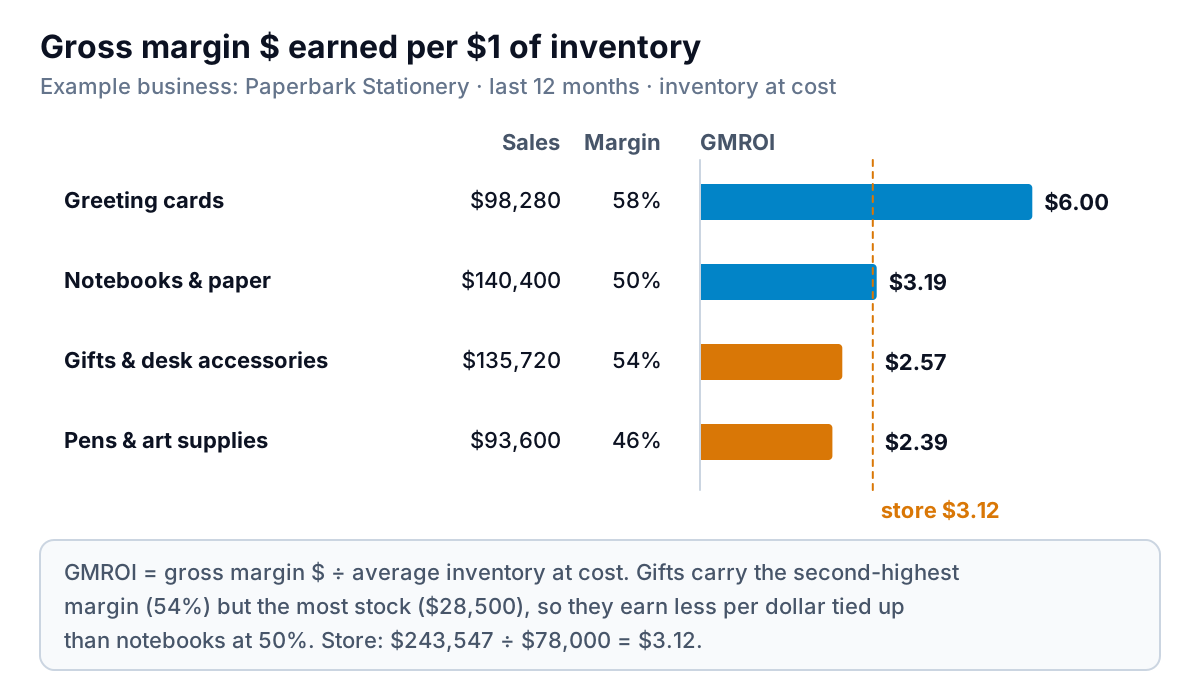
Cards earn $6.00 per dollar of stock because they're cheap to hold and sell fast. Gifts and desk accessories carry a 54% margin, but $28,500 of stock to earn $73,289 a year: $2.57. The decision this points to isn't "drop gifts". It's "carry fewer slow gift lines and more of what turns", and to review the bottom 20% of gift items by sales each season. A Pareto analysis of item sales shows which those are.
Sell-through
Units sold ÷ units received, for a delivery, a seasonal line or a new product. It's the early warning for stock you'll have to mark down. Paperbark received 400 planners for 2027 on August 1, planning to sell 70% by December 26.
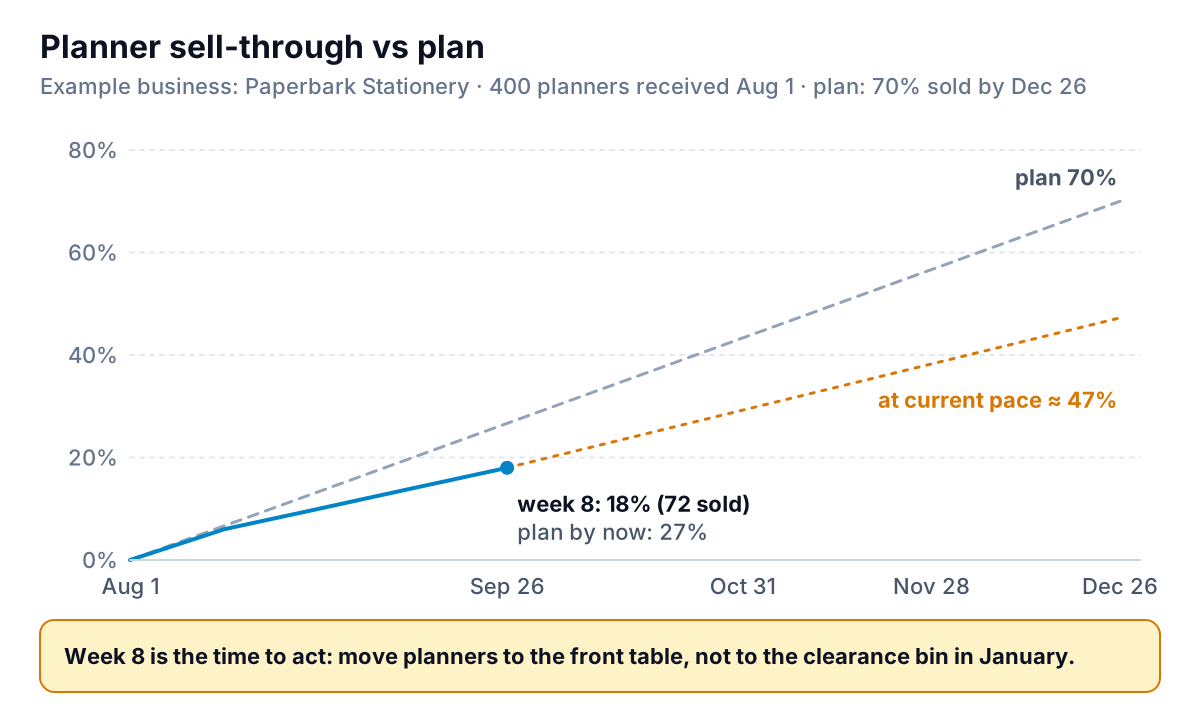
After eight weeks, 72 have sold: 18%, against the 27% the plan needed by then. At 2.25 points a week, the shop would reach about 47% by December 26 and be left with over 200 planners in January, when they're worth a fraction of their price. Acting in week 8 (a better spot, a bundle with a pen, a small markdown in November) costs far less than a 50% clearance later.
Weeks of supply
Inventory at cost ÷ average weekly cost of goods sold. Paperbark's cost of goods sold over the year was $224,453, about $4,316 a week, and it holds $78,000 of stock at cost: 18 weeks of supply. Before a reorder, check the line's weeks of supply. If it's already above the store's average and sell-through is behind plan, don't reorder.
Our inventory dashboard guide shows how to put these stock measures on a single page.
Mistakes to avoid with retail KPIs
- Tracking sales without traffic. Without a door count, a quiet week and a badly run week look the same.
- Comparing with last month instead of last year. Retail is seasonal. September against August tells you about back-to-school, not about your shop.
- Judging stock by margin percentage alone. A high-margin line that doesn't sell ties up cash. Use GMROI.
- Measuring sell-through only at the end of the season. By then the only tool left is a deep markdown. Check it weekly for seasonal and new lines.
- Too many KPIs. If a number on the report doesn't change a decision, take it off.
Where the numbers come from
Nearly everything here comes from three places: the POS (net sales, transactions, units, sales by item and category, and inventory if you track it there), a door counter (traffic), and your accounting or payroll system (staff hours, cost of goods). Most POS systems will export sales by item and an inventory snapshot to CSV. If you use Square, our Square reports guide shows which built-in reports hold these numbers.
A workable rhythm for a small shop:
- Weekly: traffic, conversion and ATV against the same week last year, plus sell-through on anything seasonal or new.
- Monthly: the full set, with gross margin and sales per labor hour for the month and sales per square foot on a rolling twelve months.
- Each season: GMROI and weeks of supply by category, before you place the next big order.
Write the target next to each number once, from your own best year, and only change it when something real changes, such as a new layout or a price rise.
Parity connects Square, Shopify and QuickBooks Online directly, or takes a CSV or Excel export from another POS or a door counter, and builds a dashboard from it: headline numbers with their trends, charts, what explains the changes, and a table of what needs attention, such as a seasonal line falling behind its sell-through plan. Every number is checked against queries on the full dataset before you see it. You can refine it by chat ("add GMROI by category", "compare conversion with the same month last year"), save it as a template and update it with next month's export. When you ask, it writes a monthly report for a business partner from the same data.
Connect Square or Shopify, or upload your POS export, and get a checked retail dashboard. Build a report from your data free
Pick your eight, set targets from your own best year, and look at them on the same day every month. For Paperbark, this month's set says two things: get more people through the door, and get the planners in front of the ones who come in.