Every job Forgepoint Machining quotes earns less than its estimate says. The shop, an example CNC job shop with four machines and one shift, prices work at $145 a machine hour, and an hour of good production costs it $160. Manufacturing KPIs are how it found out: the few numbers, measured the same way every week, that tell a plant whether it shipped on time, used its machines well, made good parts and made them at a cost below the price. The one most people start with is OEE (overall equipment effectiveness): availability × performance × quality, or, more simply, good parts × ideal cycle time ÷ planned production time.
That last formula explains why so many small shops find their first OEE number shocking. Forgepoint's busiest machine, a 5-axis mill, was "running all week". When the owner worked it out, the machine had spent just over half its planned time making good parts. The rest went on setups, waiting, a breakdown, slow running and scrap.
This guide covers the five numbers a small manufacturer needs, how to work each out from records you already keep, and what to do when each moves.
The five manufacturing KPIs a small shop needs
Lists of 30 manufacturing KPIs are easy to find. A small shop can't collect 30 numbers well, and doesn't need to. Five questions cover almost every weekly decision:
- Did we ship when we promised? On-time delivery.
- How well did the machines run while they were scheduled? OEE, on the machine that limits the shop.
- Did we make good parts first time? First-pass yield, and scrap in dollars.
- Is next week's work going to fit? Load against capacity, machine by machine.
- What does an hour of good production cost us? Cost per earned hour, compared with the rate you quote.
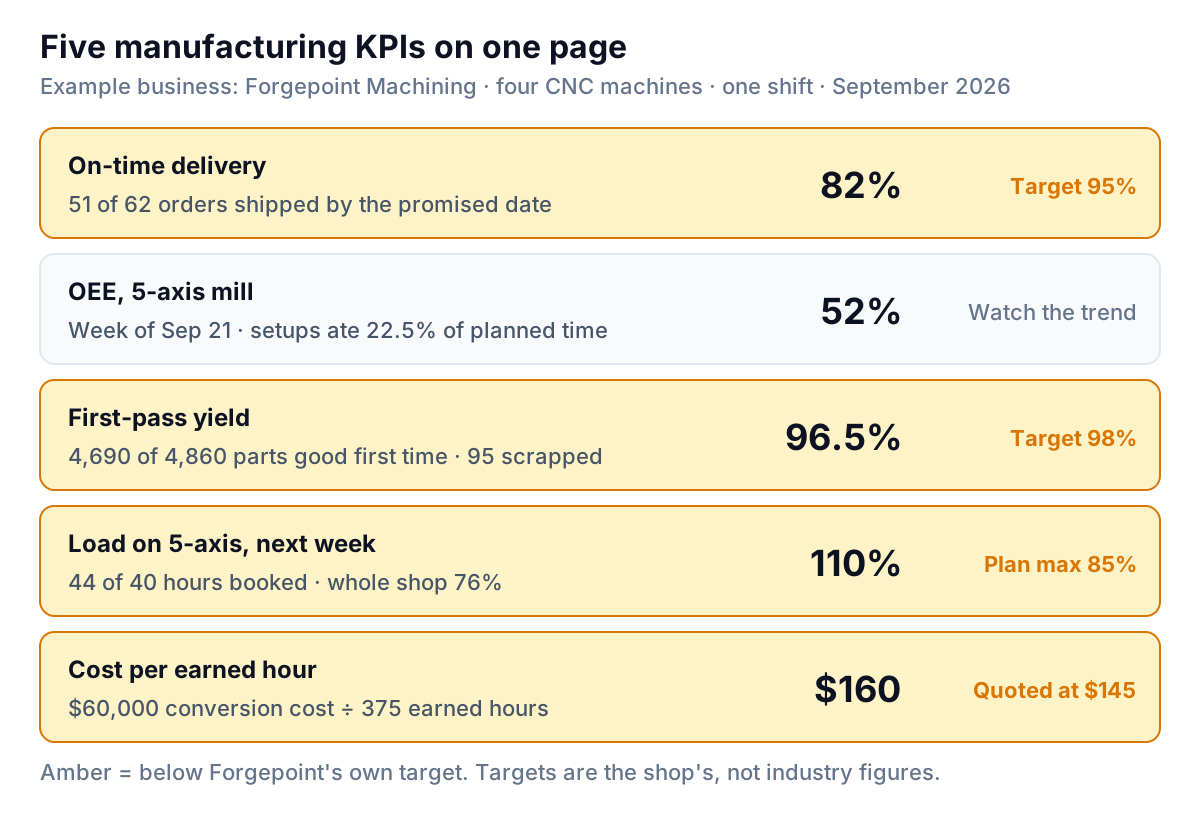
Read the page in that order. The customer sees the first number, the next three explain it, and the last tells you whether the shop makes money at its prices.
On-time delivery: measure it against the promise
On-time delivery = orders shipped by the promised date ÷ orders shipped. Forgepoint shipped 62 orders in September, and 51 left by the date on the customer's order acknowledgement: 82%, against the shop's own target of 95%.
Two rules keep this number honest:
- Use the first promised date, not the latest one. If the date was moved three times and you shipped by the third, the customer still waited. Keep the original date in its own column and never overwrite it.
- Count an order as late if any line is late. A customer who gets 400 of 500 brackets on time can't build anything with them.
Then record why each late order was late, from a short fixed list. Forgepoint's 11 late orders had three causes: 6 were waiting for time on the 5-axis mill, 3 had material that arrived late, and 2 needed parts remade after scrap. Sorting causes biggest first, as in a Pareto analysis, turns "we're late a lot" into a fix you can assign.
OEE: where a machine's planned time goes
OEE splits a machine's planned time into the part that produced good parts and the losses. The definitions below follow the standard calculation published by Vorne, a company that makes OEE monitoring equipment:
- Availability = run time ÷ planned production time. Planned time is the shift minus breaks; run time is planned time minus every stop, planned or not.
- Performance = (ideal cycle time × total parts) ÷ run time. It catches slow cycles and small stops.
- Quality = good parts ÷ total parts.
- OEE = availability × performance × quality.
Forgepoint's 5-axis mill was planned for five 8-hour shifts in the week of September 21: 2,400 minutes. It stopped for 840 of them (540 minutes of setups, 180 waiting for material or programs, 120 for a spindle fault), so it ran for 1,560 minutes: availability 65.0%. The parts it made had an ideal cycle time of 6 minutes, and it made 220, so the work it did was worth 1,320 ideal minutes: performance 1,320 ÷ 1,560 = 84.6%. Eleven parts were scrapped, leaving 209 good: quality 95.0%.
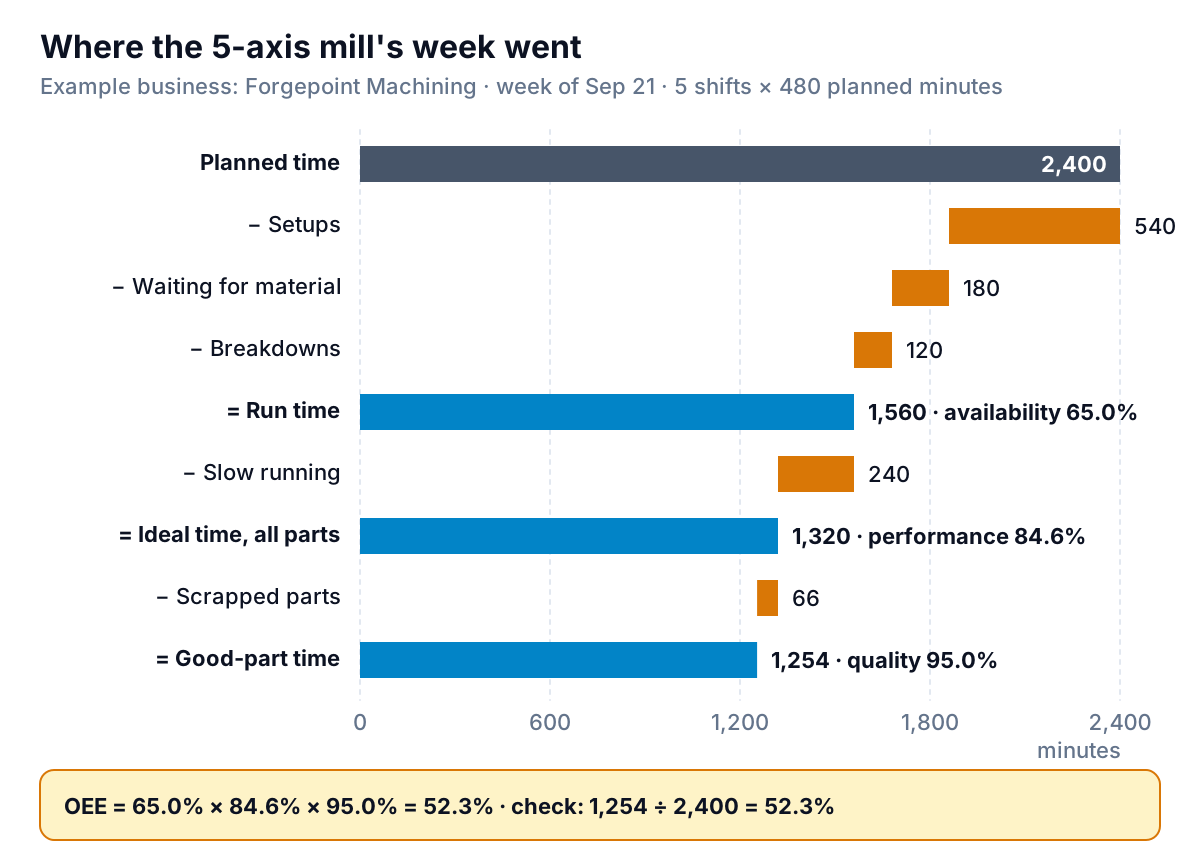
OEE = 65.0% × 84.6% × 95.0% = 52.3%. The short formula gives the same answer: 209 good parts × 6 minutes = 1,254 minutes, ÷ 2,400 = 52.3%. If your parts have different cycle times, add up good parts × ideal cycle time for each job; that's the "good-part minutes" at the bottom of the chart.
Is 52% bad?
Vorne's site says a "world-class" OEE of 85% traces back to Seiichi Nakajima's work on Japanese plants in the 1970s and 1980s, and that most manufacturers today score closer to 60%. Treat both figures loosely. They come from a vendor's experience, not a survey with a stated sample, and a high-mix job shop isn't a plant running one part all month. If a shop changes jobs three times a day and counts setups as downtime (it should), its OEE will sit well below a line that runs the same part for weeks.
So don't compare your OEE with anyone else's. Use it on yourself, in two ways:
- Track it on the machine that limits the shop, not as an average of every machine. An hour lost on a machine with spare capacity costs nothing. An hour lost on the bottleneck is an hour of output the whole shop never gets back.
- Attack the biggest loss first. At Forgepoint that's setups: 540 minutes, 22.5% of the week. Running similar jobs back to back on shared fixtures, presetting tools off the machine, and having the next job's material and program ready before the current job ends all shrink it, and none needs new equipment.
First-pass yield and scrap: count parts and dollars
First-pass yield = parts good the first time through ÷ parts started. Across all four machines in September, Forgepoint started 4,860 parts. 95 were scrapped and 75 needed rework, so 4,690 were good first time: a first-pass yield of 96.5%, against a target of 98%. The scrap rate on its own was 95 ÷ 4,860 = 2.0%.
Report scrap in dollars as well as a percentage. A scrapped part costs its material plus the machine time spent on it before it failed. Forgepoint's 95 scrapped parts averaged about $65 each, or $6,175 for the month. A percentage invites a shrug; $6,175 gets a meeting.
Record a cause for every scrapped or reworked part, from a short list: wrong setup, tool wear, material defect, programming error, handling damage, other. Sort the causes by cost, not by count. Ten scrapped aerospace housings matter more than forty scrapped spacers.
Capacity and load: check the bottleneck, not the average
Load = hours of work booked for a period ÷ hours available, worked out machine by machine. Forgepoint has 40 planned hours per machine per week, and its schedule for next week books 122 of the 160 available across the shop. That's 76%, which looks comfortable.
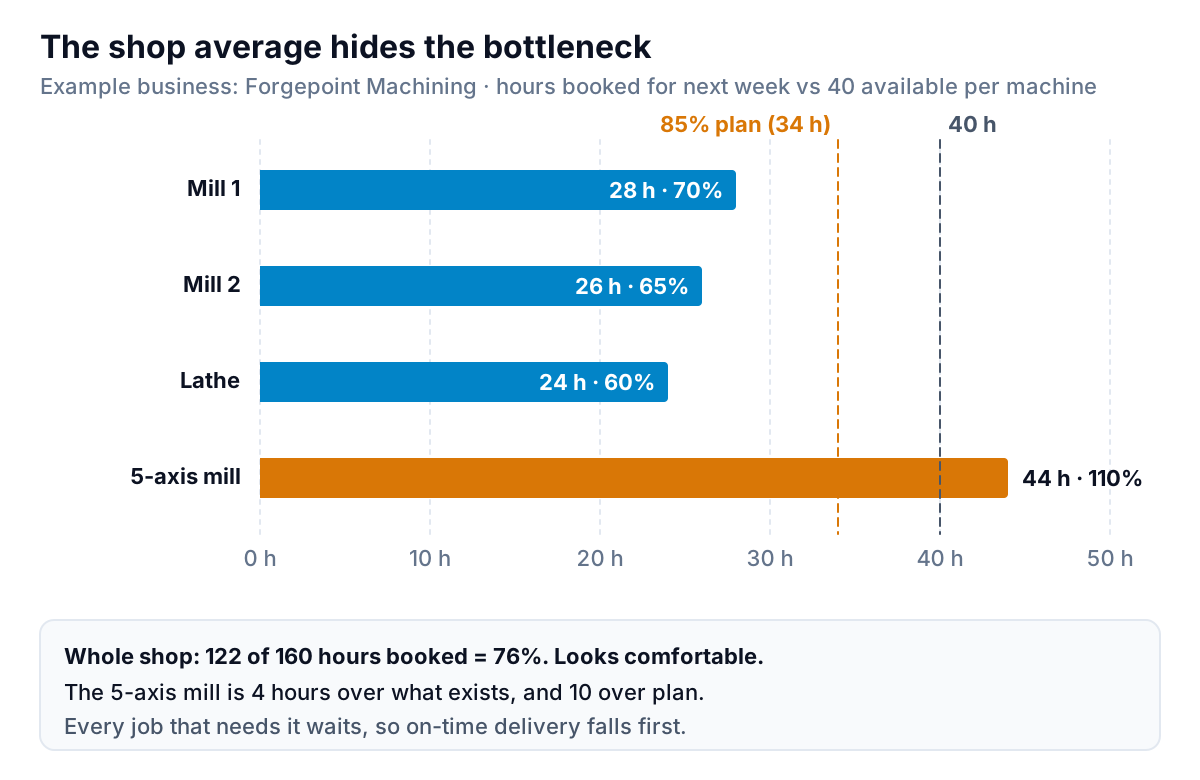
Machine by machine, it's a different picture. The 5-axis mill is booked for 44 hours in a 40-hour week. That's why six orders were late in September: they were queued for the one machine that couldn't fit them.
Book in the hours a job will really take, not the ideal cycle time. If a machine's OEE is 52%, a job with 10 hours of ideal cycle time will need about 19 hours of planned time on that machine. Forgepoint plans each machine to a maximum of 85% of its hours, so that one overrun doesn't push every later job back. Our operations dashboard guide shows why running near 100% makes lateness spread.
When the bottleneck is booked above plan for the next two weeks, you have four moves:
- Move work that doesn't need it onto a machine with spare hours, even if it runs slower there.
- Add hours to that machine only: a second-shift operator or Saturday running for one machine is cheaper than overtime for the whole shop.
- Send simpler operations out to a subcontractor.
- Quote longer lead times on new work that needs that machine, until the backlog falls.
Cost per earned hour: the number that sets your prices
Most job shops quote with a shop rate per machine hour. The question is whether that rate covers what an hour actually costs. Work it out like this:
Cost per earned hour = conversion cost for the month ÷ earned hours
Conversion cost is everything except material and outside services: wages and payroll costs for the people on the floor, rent, power, tooling, machine leases and maintenance, insurance, and the owner's and office salaries. Earned hours are the good-part hours: good parts × ideal cycle time, added up across every job and machine, divided by 60.
Forgepoint's conversion cost in September was $60,000: $38,400 of labor and $21,600 of overhead. Its four machines were planned for 672 hours (4 machines × 8 hours × 21 working days), and they earned 375 hours of good parts, a shop-wide OEE of 55.8%. So each earned hour cost $60,000 ÷ 375 = $160. Forgepoint quotes $145 an hour.
Here's what that does to one job. A bracket has $8.40 of material, 6 minutes of ideal cycle time, and $2.10 of outside anodizing. At the quoted rate, the machining is 0.1 hour × $145 = $14.50, so the estimated cost is $25.00 and the $31.00 price leaves a 19.4% margin. At the real $160, machining costs $16.00, total cost is $26.50, and the margin is 14.5%. Every job quoted this way earns less than its estimate says. If you want the margin arithmetic in more detail, our guide to margin vs markup covers why the two get confused in quotes.
There are two fixes, and they compound. Raise the shop rate, or raise OEE so the same $60,000 buys more earned hours. If Forgepoint's shop-wide OEE rose from 55.8% to 64.0%, it would earn 430 hours, and the cost per earned hour would fall to $60,000 ÷ 430 = $139.53, under the quoted rate. That is the business case for cutting setup time: it sets the price you can afford to charge.
Where the numbers come from, and how to track them weekly
None of this needs new software to start. The inputs are already in records most shops keep:
| KPI | Inputs | Usually found in |
|---|---|---|
| On-time delivery | Original promise date, ship date, late reason | Order acknowledgements and shipping log, or your ERP or job-tracking system |
| OEE | Planned time, stop times by reason, parts made, ideal cycle time, good parts | Operator logs or job travelers; machine monitoring if you have it |
| First-pass yield and scrap | Parts started, scrapped, reworked, cause, cost | Inspection or nonconformance log |
| Load | Hours booked per machine for the next few weeks | Schedule or job routing estimates |
| Cost per earned hour | Monthly costs excluding material; earned hours | Accounting software plus the OEE records |
If your job-tracking or ERP system can export a CSV, use that. If not, a shared spreadsheet with one row per job operation works: job number, machine, date, planned minutes, stop minutes by reason, parts made, parts good, ideal cycle time. Fill it in at the end of each shift, not at the end of the week, when stops have been forgotten. Material and outside services come out of your cost of goods sold; everything else in the monthly costs is conversion cost.
Mistakes that make manufacturing KPIs mislead
- Leaving setups out of OEE because they're "planned". In a job shop, setup time is the biggest loss, and excluding it hides the thing you most need to fix.
- Averaging OEE across machines. It treats an idle machine's lost hour the same as the bottleneck's.
- Using a generous ideal cycle time. If "ideal" is padded, performance will look like 100% and the losses vanish. Use the fastest proven cycle.
- Measuring on-time against moved dates. The number goes up and customers notice nothing.
- Quoting from a shop rate set years ago. Recalculate cost per earned hour every quarter.
Review the page weekly, in about twenty minutes, and cost per earned hour monthly. For each number, agree one action and an owner.
Building the scorecard without the spreadsheet chores
A spreadsheet will do all of this. What tends to break is the weekly routine of pasting in exports. Parity builds the dashboard from the files instead. Upload your job or production log and shipping export as CSV or Excel, connect QuickBooks Online for the costs, and describe what you want ("on-time delivery against the original promise date with late reasons, OEE for the 5-axis mill, scrap cost by cause, and cost per earned hour"). Parity builds a dashboard with the headline numbers and their trends, charts, what explains them and a table of what needs attention, and checks every number against queries on the full dataset before you see it. You refine it by chat, update it each week with a newer file, and share a read-only link with your production lead. When a partner or lender wants a monthly summary, ask Parity to write the report from the same data.
Upload a job or production export and get a checked scorecard of on-time delivery, OEE, scrap and cost per earned hour. Build a report from your data free
Forgepoint's page told one story in four numbers: the 5-axis mill is overbooked and loses more than a fifth of its week to setups, so orders wait, a few get rushed and scrapped, and every hour costs more than the quote assumes. The fix starts at one machine. That's what good manufacturing KPIs do. They don't just grade the month; they point to where the next hour of effort pays most.