Why static P&L and budget spreadsheets break during seasonal swings
Your annual budget says the business will finish the year with a healthy net profit margin. On the income statement tab, every month looks profitable because annual revenue and fixed expenses are spread evenly across the calendar. Then a slow quarter arrives, inventory bills come due before customer payments clear, and the checking account hits a dangerous low.
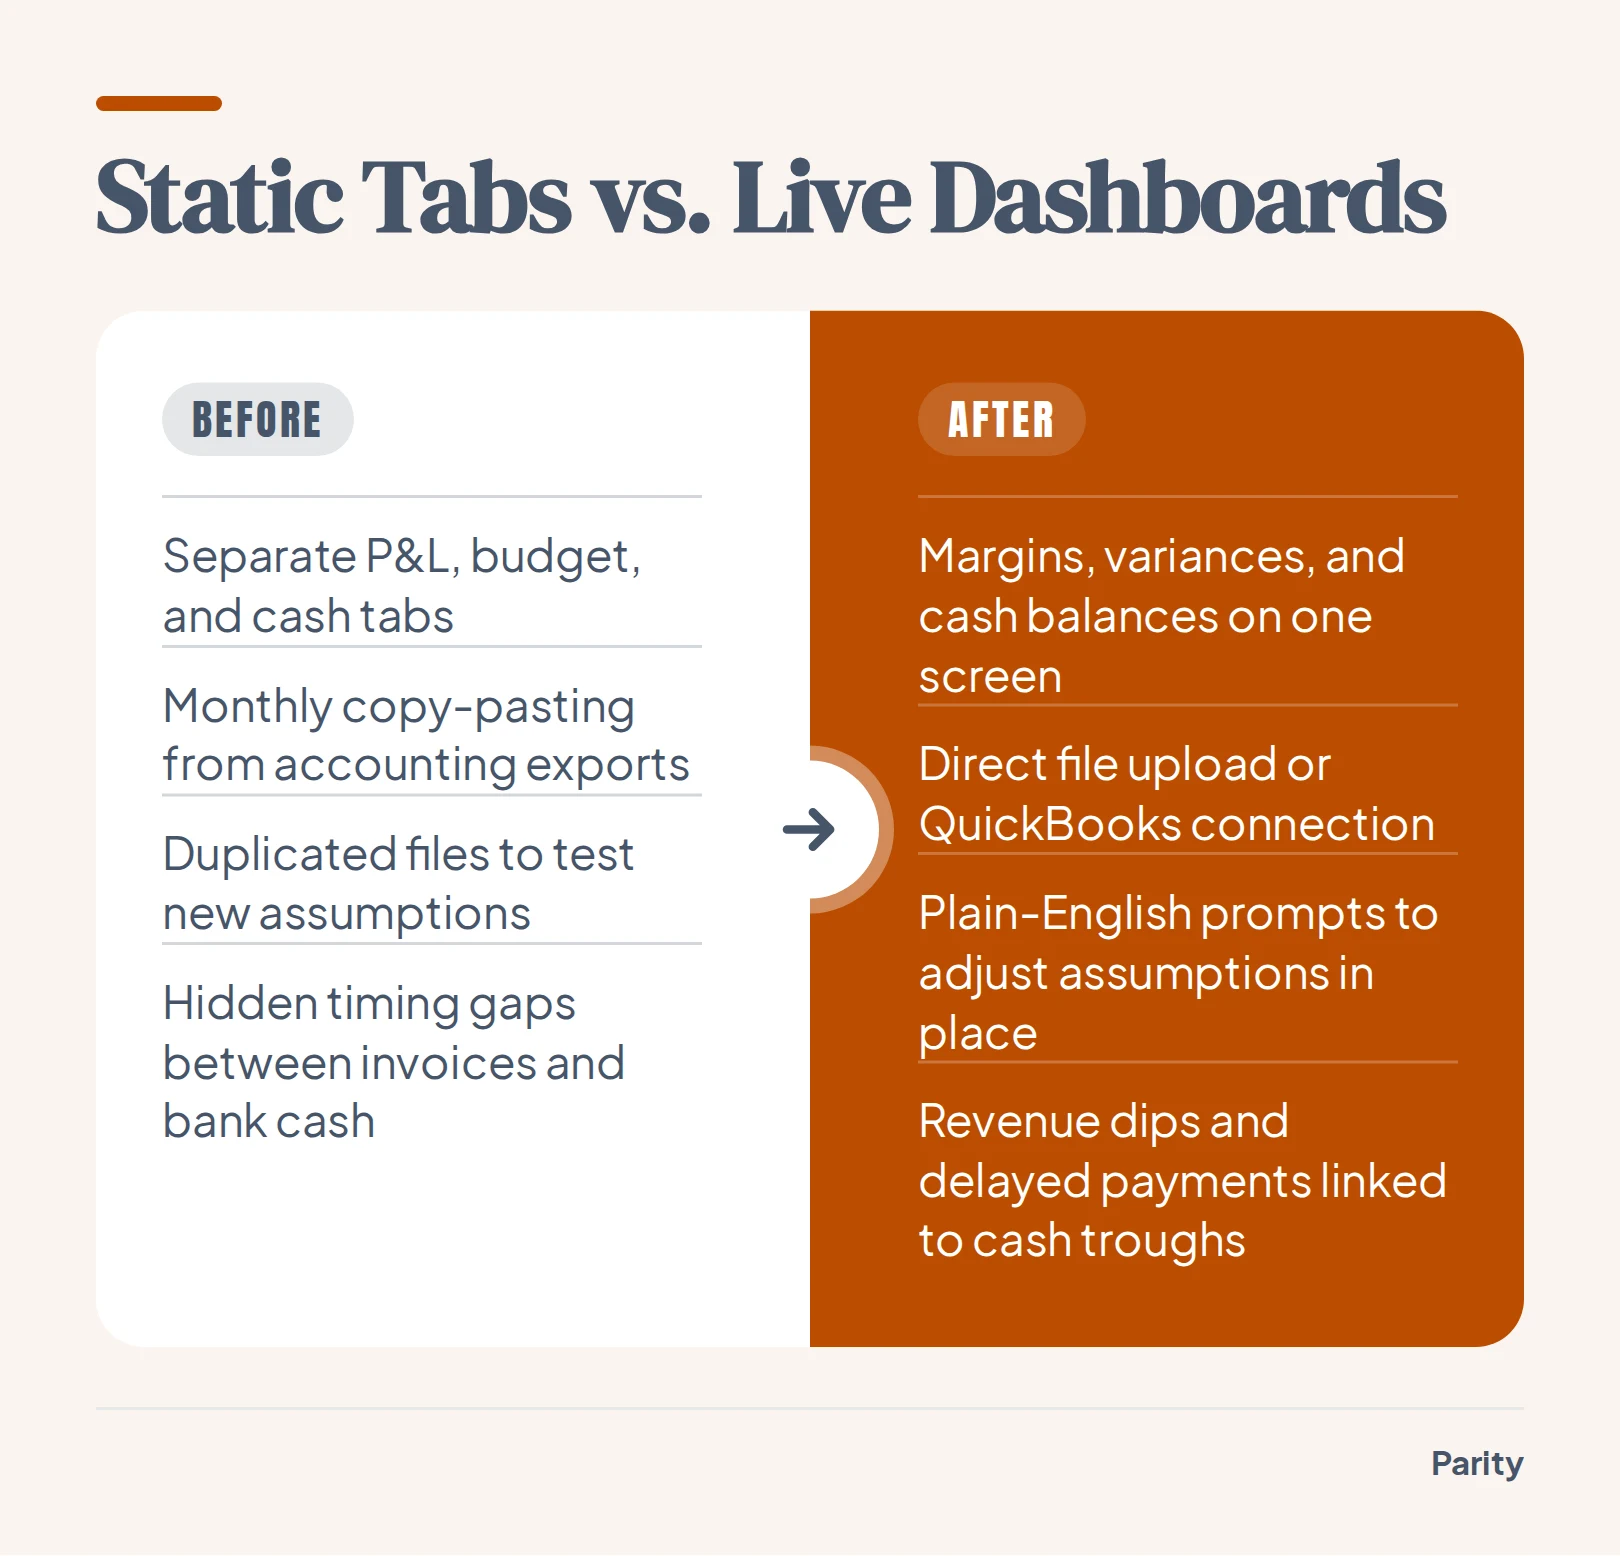
The workbook was not wrong about the full year. It simply separated the profit and loss statement from the timing of cash coming in and going out. When finance teams, medical practices, and small business owners keep their P&L, budget, and cash forecast in separate tabs, a single seasonal dip breaks the links between them.
Static spreadsheets fail during seasonal swings for three common reasons:
- Disconnected tabs: Updating a revenue assumption on the budget tab rarely flows cleanly into the accounts receivable timing on the cash tab.
- Accrual versus cash timing: Standard income statements record revenue when an invoice is issued, hiding the gap before the customer actually pays.
- Rigid overhead allocation: Fixed costs like rent, payroll, and insurance sit at flat monthly averages while seasonal inflows fluctuate wildly.
Many operators start with a static cash flow forecast template to map out these monthly obligations. A template gives you a structured starting point for listing inflows and outflows. However, copying new accounting exports into a multi-tab workbook every month invites broken references just when cash gets tight.
When you test a new hiring plan or a supplier price increase in a traditional spreadsheet, you often have to duplicate the entire file to preserve your baseline numbers. Within a few weeks, leadership is reviewing three different versions of the forecast with no clear audit trail of which assumptions changed.
Moving to a live dashboard puts profit margins, budget variances, and bank balances on one screen. Instead of hunting through cell references after a slow month, you see immediately how a revenue dip or a delayed receivable affects your cash trough.
Which financial planning and analysis tools offer out-of-the-box dashboards?
Teams looking to upgrade from manual workbooks usually evaluate three categories of tools. Traditional spreadsheet templates require you to map your chart of accounts by hand and maintain complex lookup formulas. Enterprise business intelligence platforms offer live charts, but they require technical setup, data modeling, and weeks of configuration.
For most mid-sized finance teams, medical clinics, and growing businesses, both traditional paths create a bottleneck. Waiting on a technical specialist to build a data pipeline delays monthly reporting, while maintaining fragile lookup tables eats up hours that should go toward analyzing variances.
An automated AI dashboard generator takes a more direct path. With Parity AI, you upload a CSV, Excel (.xlsx), or .xls file, or connect a tool like QuickBooks, Stripe, or Shopify via read-only access. You describe what you want to see, and the software builds an interactive dashboard with charts, KPI cards, tables, and written insights in seconds.
There are no chart wizards, formulas, or data modeling steps to configure. Parity AI reads every row of your dataset, profiles the columns, and lays out the visual breakdown automatically. When you want to adjust a view, you refine the dashboard by chatting with plain-English prompts.
For teams comparing reporting options, our guide to an AI dashboard for accounting walks through how automated views handle general ledger exports and client summaries without manual chart-building.
| Feature | Spreadsheet Templates | Traditional BI Tools | Parity AI |
|---|---|---|---|
| Setup time | Hours of manual cell mapping | Weeks of data modeling | Seconds to generate |
| Data inputs | Copy-paste into tabs | Database pipelines | CSV, Excel, or read-only connectors |
| Refining views | Rewrite cell formulas | Rebuild chart configurations | Chat with plain-English prompts |
| Number verification | Manual cell trace | Separate query audit | Click figure to see query and rows |
Core views every FP&A dashboard needs: P&L variance, overhead, and seasonal cash flow
A practical FP&A dashboard does not cram every ledger line onto one screen. Instead, it organizes financial performance into three connected views that explain where profit comes from, where fixed money goes, and when cash actually hits the bank.
P&L budget-to-actual variance
Your first view tracks actual revenue, cost of goods sold, and gross margin against your budget targets. Displaying variance in both absolute dollars and percentages helps you spot whether a revenue shortfall came from lower unit volume or rising direct costs. Choosing the right visual layout matters here, and our breakdown of essential financial charts shows how variance bars expose monthly dips that cumulative lines hide.
Separating volume variances from price or cost variances keeps management discussions focused on actionable fixes. When gross margin slips by two percentage points during a busy quarter, leadership needs to see immediately whether discounting, supplier freight surcharges, or overtime labor drove the gap.
Overhead and fixed cost tracking
Operating expenses can quietly erode healthy gross margins if they are only reviewed at year-end. Grouping overhead into clear categories lets you monitor burn rate alongside seasonal revenue:
- Payroll and benefits: Base wages, seasonal overtime, payroll taxes, and contractor fees.
- Occupancy and facilities: Rent, utilities, property insurance, and equipment leases.
- Software and administration: Recurring subscriptions, accounting fees, and office supplies.
Tracking these categories over a rolling twelve-month window highlights creeping fixed costs before renewals lock in for another year. It also shows what share of gross profit is consumed by baseline overhead during your slowest revenue months.
Seasonal cash flow and runway
The third view bridges the gap between accounting profit and actual bank liquidity. By plotting monthly cash receipts against scheduled outflows, you can see the exact months where seasonal troughs occur. When a business faces tight seasonal dips, pairing the annual view with a rolling 13-week cash flow projection gives leadership early warning to adjust purchasing or draw on a credit line.
Tip: Always view overhead as both a dollar total and a percentage of monthly cash inflows, so fixed costs during your slowest sales month never catch your bank balance by surprise.
How do you generate a P&L and seasonal cash flow dashboard with dynamic assumptions?
Building an interactive financial view does not require rebuilding your accounting workbook from scratch. You can take the spreadsheet exports you already use and turn them into a live dashboard in four straightforward steps.
Before you upload your file, make sure your export has clean column headers for dates, account names, categories, and amounts. Keeping actuals and budget figures in structured columns or clearly labeled rows ensures that variance comparisons align across every fiscal period.
- Prepare or connect your source data: Export your monthly P&L, budget, and cash ledger as a CSV, .xlsx, or .xls file, or connect your accounting tool like QuickBooks via read-only access.
- Upload and describe your focus: Drop the file into Parity AI and state what you want to track, such as monthly budget variance, overhead categories, and seasonal net cash movement.
- Review the automated layout: Parity AI reads every row, profiles the columns, and generates KPI cards, charts, tables, and written insights in seconds.
- Test assumptions and breakdowns via chat: Use plain-English follow-up prompts to add charts, filter by department or cost category, or re-summarize seasonal periods while the dashboard updates in place.
Because the conversational interface updates the dashboard in place, you never risk overwriting a master cell formula. You can isolate specific cost spikes, compare peak months against off-peak quarters, and follow the software's suggestions on what to look at next.
How finance teams, medical practices, and small businesses track overhead and cash troughs
While every organization watches revenue and expenses, the specific drivers behind seasonal cash troughs differ by industry. An in-house finance team, a healthcare clinic, and a retail or service business each face distinct timing gaps between billing and bank deposits.
In-house finance teams and accounting consultants typically focus on departmental budget adherence and multi-month receivables. When enterprise clients pay on net-60 or net-90 terms, strong quarterly bookings on the P&L can coincide with a cash dip when annual software renewals or bonus payouts clear.
Medical and dental practices deal with a different seasonal rhythm. High-deductible health plans reset in January, slowing patient collections early in the year, while insurance payer reimbursements lag behind clinical visits. Meanwhile, clinical payroll, lab fees, and equipment leases remain fixed every month.
Seasonal small businesses, such as contractors, landscapers, and specialty retailers, must buy inventory and hire staff months before peak selling weeks arrive. Agencies, consultants, and in-house teams use automated client reports to keep a consistent layout across reporting cycles. When next month's numbers close, they re-run the report on the new data so stakeholders always see a familiar format.
| Reader Group | Primary P&L Drivers | Key Overhead Metrics | Seasonal Cash Triggers |
|---|---|---|---|
| In-house finance teams | Department revenue vs budget | Headcount and SaaS spend | Net-60 receivables and annual renewals |
| Medical and dental practices | Patient volume and payer mix | Clinical payroll and lab leases | Q1 deductible resets and claim lags |
| Seasonal small businesses | Peak-season unit margin | Warehouse rent and base payroll | Pre-season inventory deposits |
Verifying every budget variance and sharing board-ready PDF reports
In financial planning and analysis, a fast chart is useless if you cannot defend the numbers in a board or partner meeting. When a stakeholder asks why operating expenses spiked in the third quarter, you need to trace the headline figure directly to the source rows.
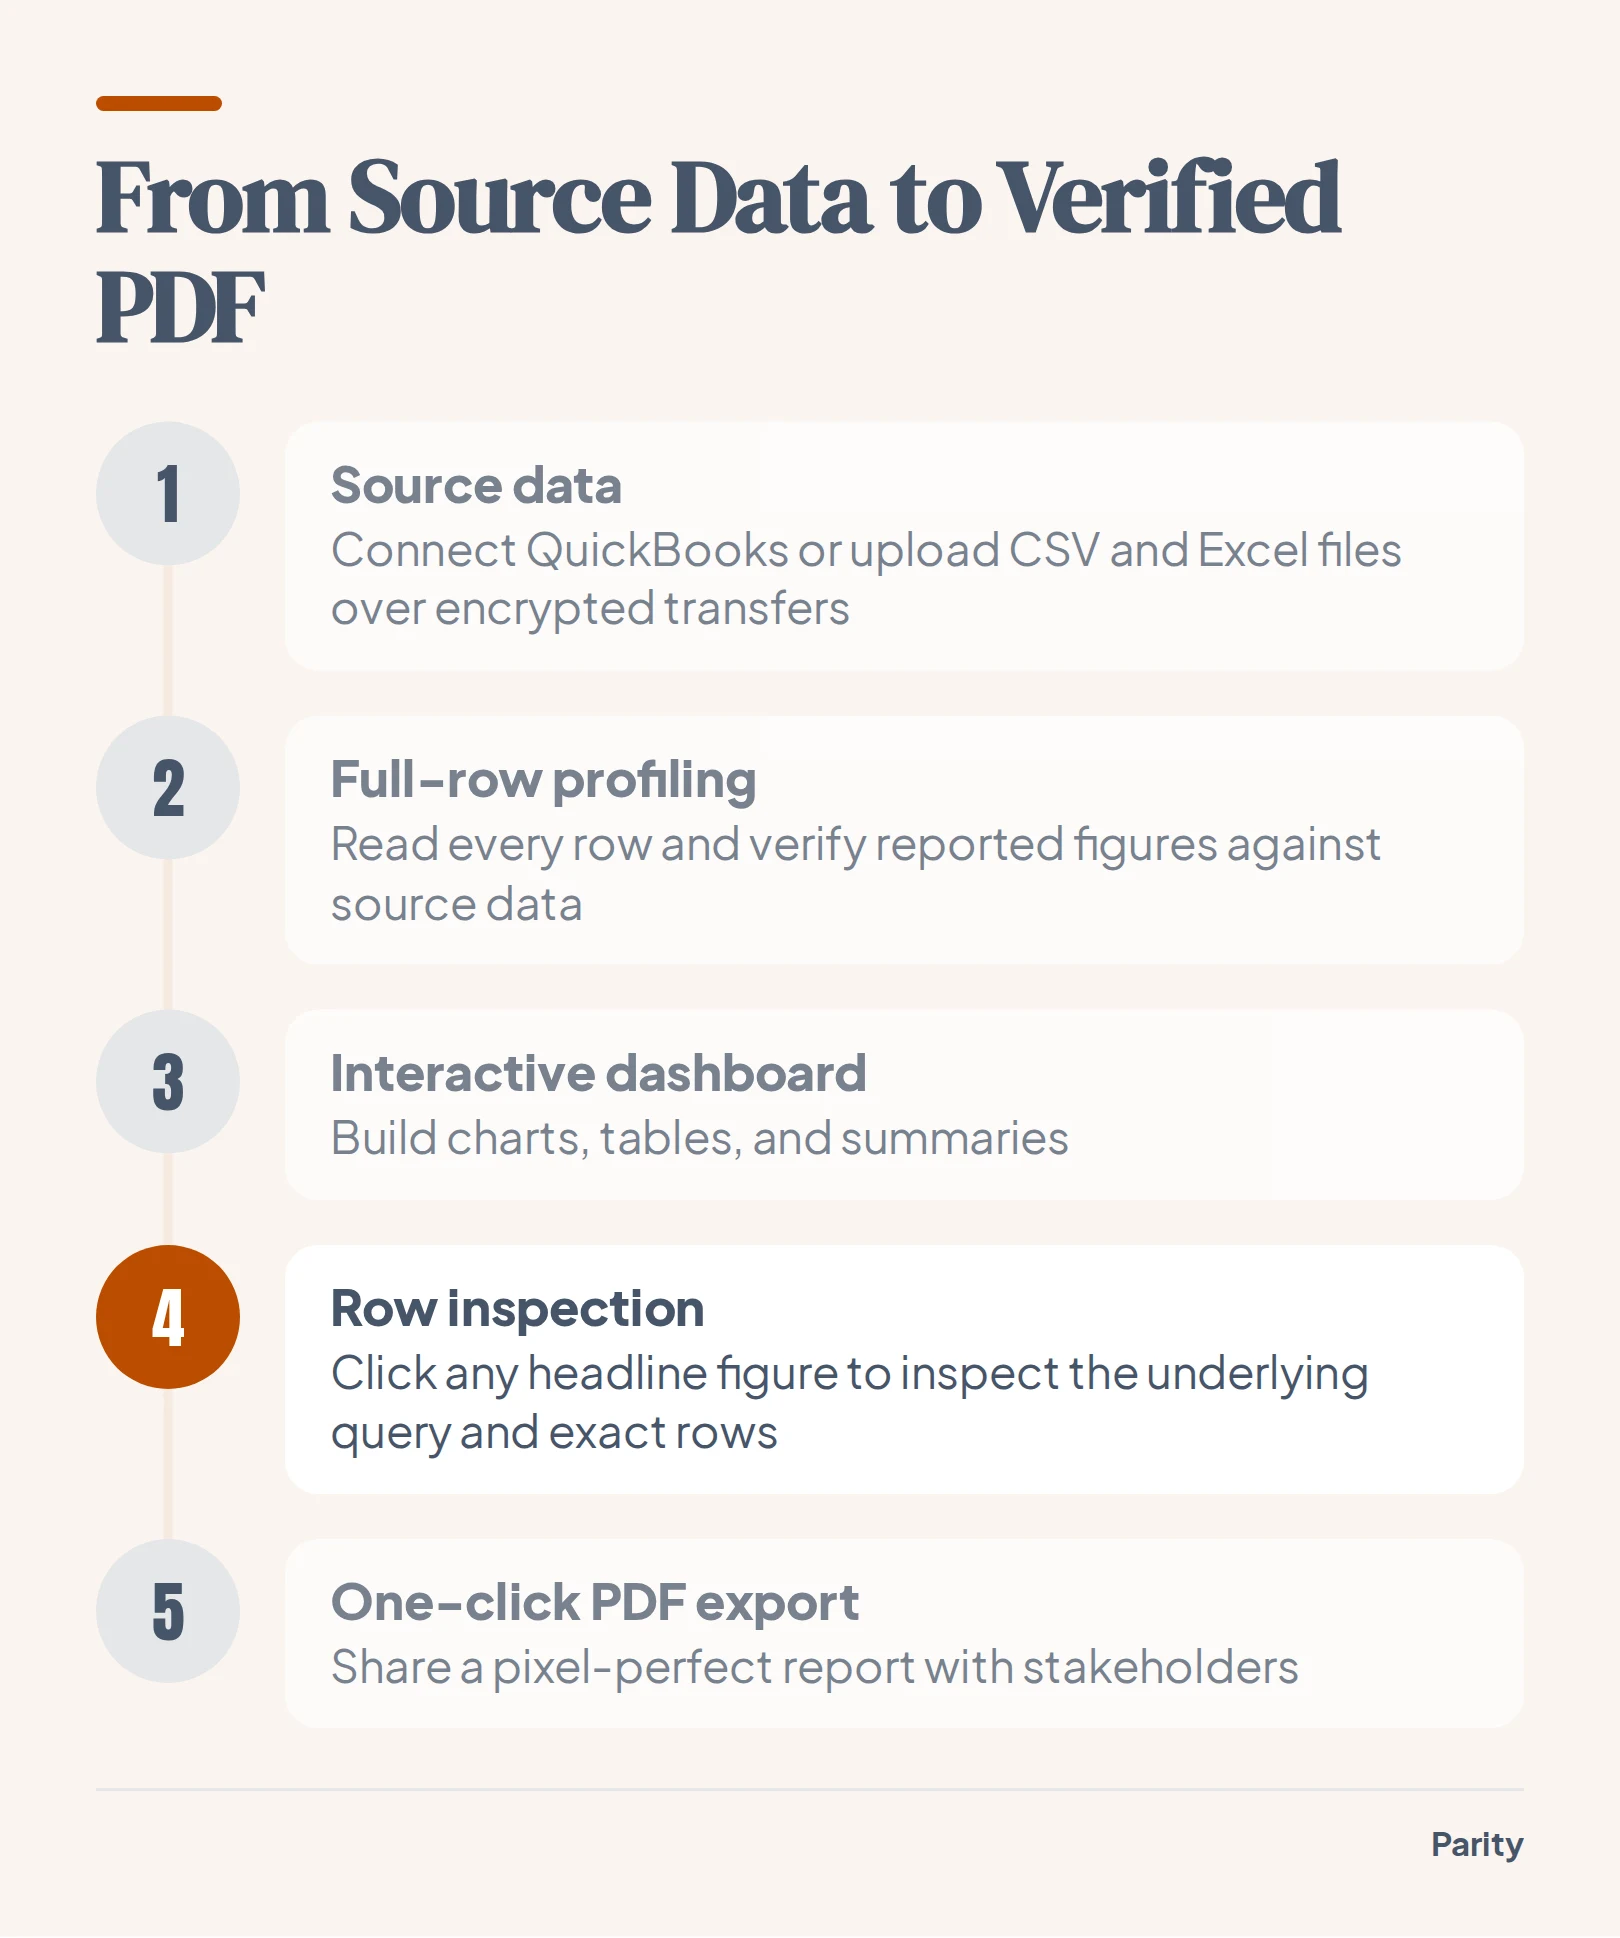
Parity AI verifies every reported figure against source data to ensure accuracy. You can click any headline figure on a dashboard to inspect the underlying query and see the exact rows counted behind it. That transparency removes the anxiety of hidden spreadsheet errors.
Data privacy is built into the workflow from the start:
- Encrypted transfers and private storage: Uploaded files travel over an encrypted connection and stay stored privately with your report so only your account can access them.
- No AI model training: Your financial data is never used to train AI models, and deleting a report deletes the underlying file.
- One-click PDF export: Once you finish refining your summaries, tables, and charts, you can export a pixel-perfect PDF in one click that looks exactly like the dashboard or report on screen.
Watch out: Never send a monthly budget packet until you can trace every variance figure back to the underlying accounting rows, or a single question about an unexpected cost spike can stall the entire review.
Upload a CSV or Excel file or connect QuickBooks to build an interactive dashboard and report with every figure checked against your source data. Build your dashboard free