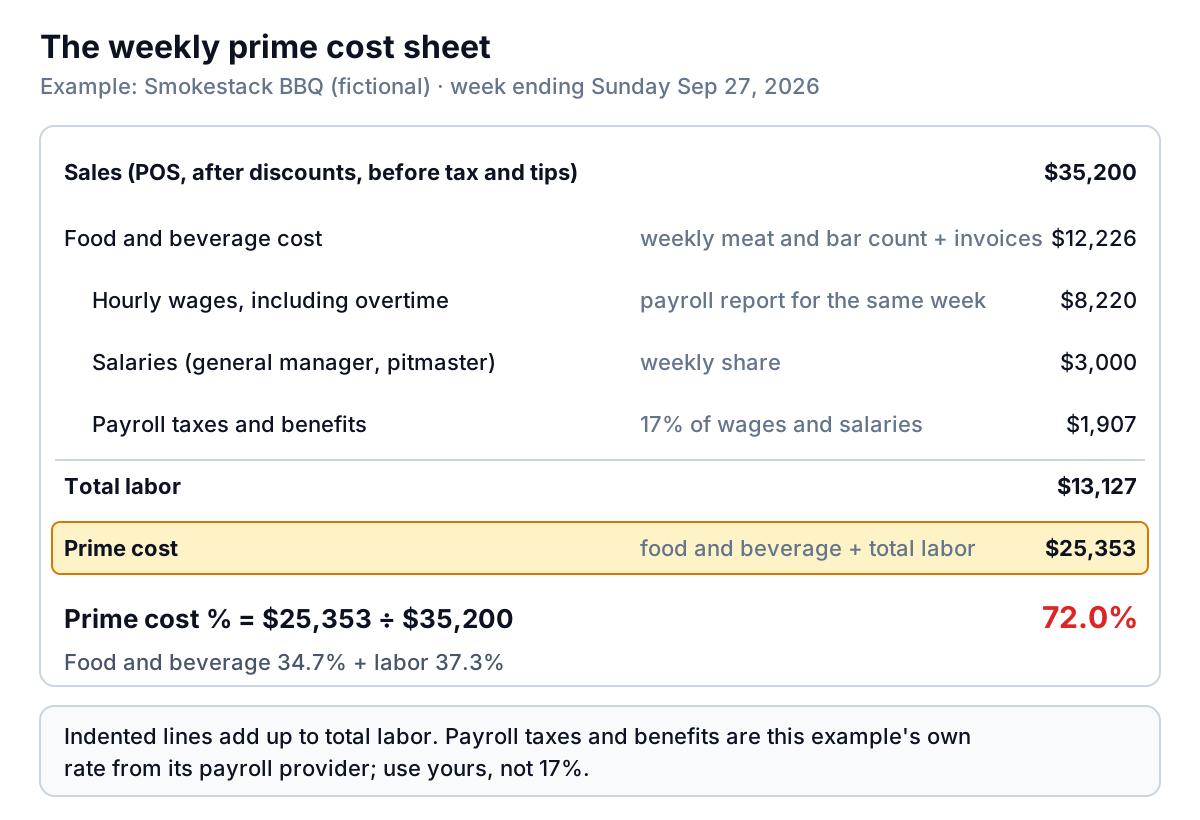
On Monday, September 28, the owner of Smokestack BBQ, an example restaurant, rewrote the week's schedule and the smoke plan before lunch. One number had told her to: last week's prime cost. Restaurant prime cost is cost of goods sold plus total labor cost, and at Smokestack the week ending September 27 came to $12,226 + $13,127 = $25,353, or 72.0% of $35,200 in sales. The four weeks before had run at about 64%.
Eight points in one week is the difference between a profitable week and a free one. She found out on Monday morning, not at the end of the month, because Smokestack tracks prime cost weekly. This guide shows how to get a weekly prime cost restaurant owners can act on, without a full stock count every week, what belongs in each half of the number, what published data says about typical levels, and how to break a bad week down into decisions you can fix.
What goes into restaurant prime cost
Prime cost = cost of goods sold (food and beverage) + total labor cost. Prime cost % = prime cost ÷ sales.
The two halves are the biggest costs a restaurant controls week to week. Rent, insurance and loan payments are fixed for months at a time. Food and labor change with every order you place and every shift you schedule. That's why restaurant operators watch them together: a kitchen that cuts a prep cook can see food waste rise, and a menu that saves on ingredients can cost more in labor.
Cost of goods sold is food and beverage used, not bought: opening inventory plus purchases minus closing inventory. Our food cost percentage guide walks through it in detail.
Total labor is where most prime cost numbers go wrong, because people count only the wages. It should include:
- Hourly wages, including overtime premiums.
- Salaries for managers, chefs and anyone else on the payroll who works in the restaurant.
- Employer payroll taxes. Social Security and Medicare alone are 6.2% and 1.45% of wages on the employer's side, before state and federal unemployment taxes.
- Workers' compensation insurance, health insurance contributions and paid leave.
Leave out tips your staff receive from guests; they aren't your cost. The employer's payroll taxes on reported tips are, though, and our guide to restaurant labor cost percentage covers that and the rest of the labor line. If you, the owner, work a station full time and don't pay yourself a wage, add what you'd pay someone to do that job. Otherwise your prime cost looks better than the restaurant really is.
Tracking prime cost weekly without a full weekly count
Monthly prime cost arrives too late to act on. By the time the bookkeeper closes September, October's schedule is already written. Weekly is the useful rhythm, and it doesn't need a full count of every shelf.
Smokestack builds each week's number from three sources:
- Sales from the POS sales summary: after discounts, before sales tax and tips.
- Food and beverage cost from a short weekly count plus the week's invoices. Smokestack counts brisket, pork shoulder, ribs, chicken, sausage and the bar every Sunday night. In this example those lines make up most of what it spends on food and drink. Everything else is treated as used when it's bought, and a full count on the last Sunday of each month trues it up. Our restaurant inventory template works for either count.
- Labor from the timeclock, not from payroll. Payroll runs every two weeks and lands late, but the scheduling or POS timeclock report shows hours and wages for the week the day it ends. Smokestack adds one week's share of salaries, then adds payroll taxes and benefits at its own rate, 17% of wages and salaries, taken from the last full month of payroll reports.
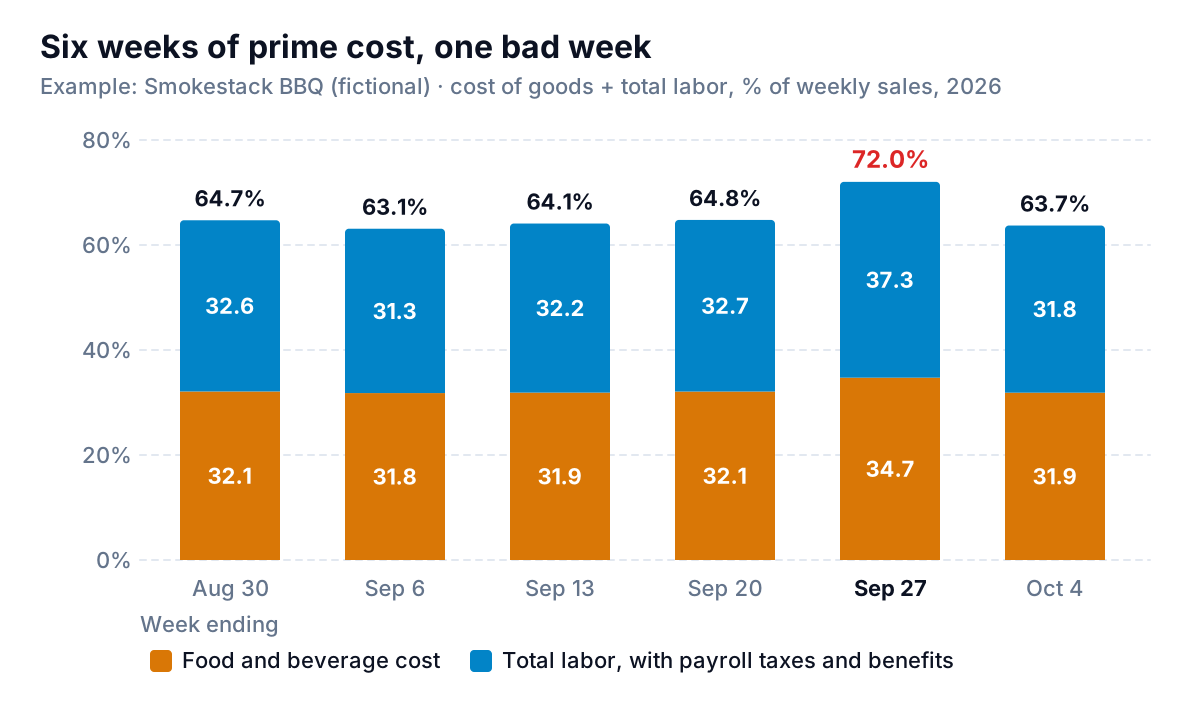
Here's the six-week log the sheet produces:
| Week ending | Sales | Food & beverage | Total labor | Prime cost | Prime % |
|---|---|---|---|---|---|
| Aug 30 | $38,600 | $12,390 | $12,589 | $24,979 | 64.7% |
| Sep 6 | $42,900 | $13,640 | $13,432 | $27,072 | 63.1% |
| Sep 13 | $39,200 | $12,500 | $12,624 | $25,124 | 64.1% |
| Sep 20 | $38,300 | $12,290 | $12,519 | $24,809 | 64.8% |
| Sep 27 | $35,200 | $12,226 | $13,127 | $25,353 | 72.0% |
| Oct 4 | $39,400 | $12,560 | $12,542 | $25,102 | 63.7% |
Notice the week ending September 6, which took in the Labor Day holiday weekend. Sales jumped to $42,900, labor went up less than sales because salaries stayed at $3,000, and prime cost fell to its best level of the six weeks. Fixed labor works for you in a busy week and against you in a slow one.
Breaking down a bad week
A prime cost number tells you something went wrong. To find out what, compare the bad week with a normal one, line by line, and turn each difference into percentage points of sales.
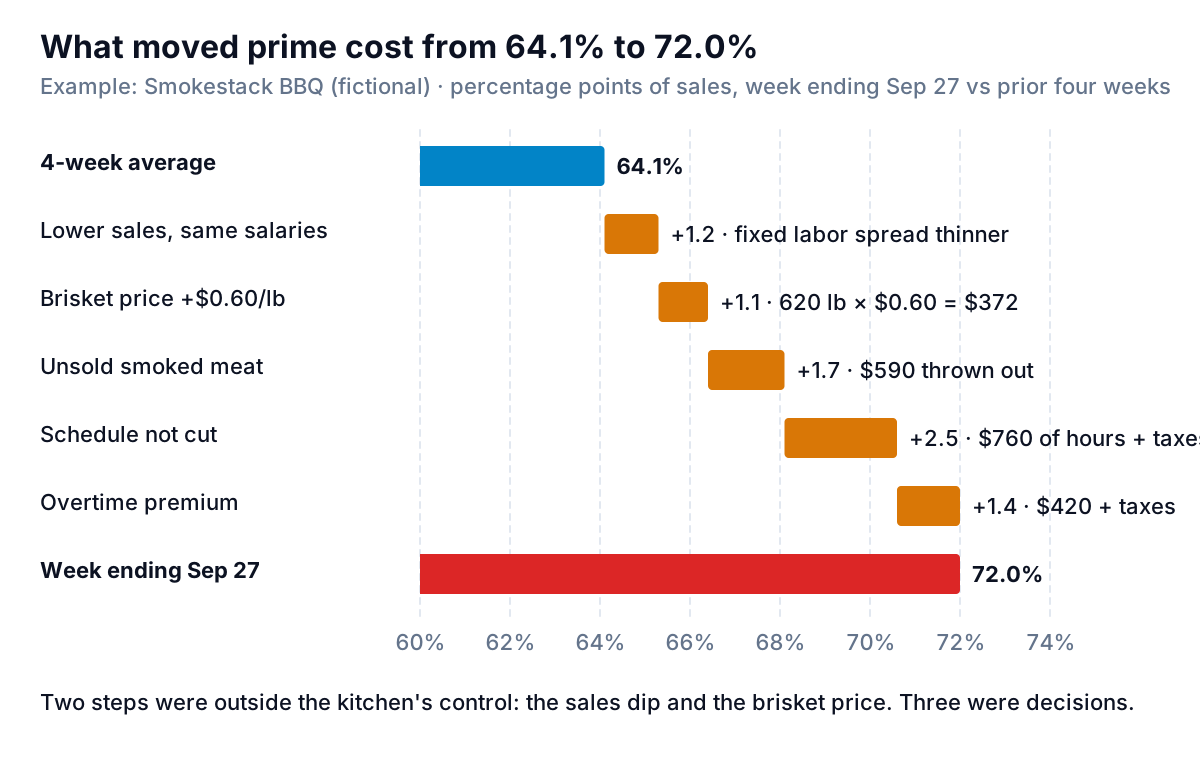
What happened at Smokestack that week, in order of size:
- The schedule wasn't cut (+2.5 points). Rain was forecast for Saturday, but the schedule was written for a normal $39,000 week. About $760 of hourly wages went to staff standing around, plus 17% in taxes and benefits.
- Unsold smoked meat (+1.7 points). The pits were loaded for a normal Saturday. $590 of brisket and pork that couldn't be held or reused went in the bin.
- Overtime (+1.4 points). Two cooks went past 40 hours because shifts weren't balanced across the week, adding $420 of overtime premium.
- Lower sales, same salaries (+1.2 points). The general manager and pitmaster cost the same in a $35,200 week as in a $39,000 one.
- Brisket price (+1.1 points). The supplier raised brisket by $0.60 a pound on 620 lb. Expect more of this: the USDA's Economic Research Service forecasts wholesale beef prices up 8.5% in 2026.
Only the brisket price and the weather were outside the kitchen's control. The rest came from production and scheduling that didn't react to a forecast. The fixes the following week were simple: a smoke plan tied to a sales forecast by day, a schedule with cut times written in, and a check on hours each Thursday so nobody crosses into overtime by accident. Prime cost for the week ending October 4 came back to 63.7%.
Prime cost restaurant benchmarks: what the data says
You'll see "keep prime cost under 60%" or "60 to 65%" on almost every restaurant software blog. We couldn't trace either figure to a published survey with a stated sample and definition, so treat them as rules of thumb.
The best public data comes from the National Restaurant Association's 2025 Restaurant Operations Data Abstract, based on more than 900 operators. It reports the two halves separately for 2024:
| Median, % of sales (2024) | Full-service | Limited-service |
|---|---|---|
| Food and non-alcohol beverage costs | 32.0% | 32.4% |
| Salaries and wages (including benefits) | 36.5% | 31.7% |
| Income before taxes | 2.8% | 4.0% |
It's tempting to add the first two rows and call the result median prime cost: 68.5% for full-service, 64.1% for limited-service. Be careful. The median of a sum isn't the sum of the medians, the food figure leaves out alcohol, and the labor figure is described as salaries and wages including benefits, so it may not match a labor line built with every payroll tax. Read the sums as "around two-thirds of sales", which agrees with the Association's own description of a typical independent restaurant before the pandemic, where food and labor each took about 33 cents of every sales dollar. Accounting firms publish restaurant benchmarks too, such as Baker Tilly's annual report covering food cost and store labor percentages, but its figures sit behind a download form, so check how it defines each measure before you compare.
Set your own line from your P&L
A better target comes from working backwards. Take everything that isn't prime cost: rent, utilities, card fees, repairs, marketing, insurance, supplies. At Smokestack those run about 28% of sales. If the owner wants a 7% profit before tax, prime cost has to stay at or below 100% − 28% − 7% = 65%. The four-week average of 64.1% clears it. The 72.0% week left nothing at all: 72% + 28% is the whole sales dollar.
Your numbers will differ. A restaurant with cheap rent can run a higher prime cost; one in an expensive location needs a lower one. The method is the same.
Mistakes that make prime cost meaningless
- Wages only. Leaving out payroll taxes, benefits and salaries understates labor by thousands a month. At Smokestack, salaries and the 17% add-on were $4,907 of the $13,127 in the bad week.
- Purchases instead of usage. A week with a big meat delivery looks terrible and the next week looks great. Count the expensive lines weekly.
- Payroll dates instead of work dates. A paycheck dated October 2 covers two weeks of September work. Use timeclock hours for the week you're measuring.
- Different definitions over time. Moving the bar into or out of COGS, or adding the owner's wage one month and not the next, breaks the trend.
- Judging by the month. A month at 65% can hide one week at 72%. The weekly view shows when and why.
Decision rules for the Monday number
| What you see | What to do this week |
|---|---|
| Prime cost within your line | Nothing. Note it and move on |
| Over your line by 1–3 points, one week | Find the biggest of the five causes (sales, prices, waste, schedule, overtime) and fix that one |
| Over your line two weeks running | Bridge both weeks; if prices drove it, re-cost the top sellers and consider menu prices |
| Labor up, food flat | Compare scheduled hours with forecast sales by day; cut times and overtime checks |
| Food up, labor flat | Item-level usage on proteins; check production against forecast |
The weekly sheet takes about 20 minutes once the counts and timeclock export are in. What takes longer is pulling the numbers from three systems. Parity can build a prime cost dashboard from them: connect Square or QuickBooks Online directly, and upload your timeclock export and weekly count as Excel or CSV files. You get the headline numbers with their trends, charts, what explains them and a table of what needs attention, with every number checked against queries on the full dataset. Ask by chat to show prime cost by week with food and labor stacked, update it each Monday with the new files, and share a read-only link with your business partner. Our profit and loss statement guide covers the rest of the P&L the prime cost line feeds into.
Bring your POS sales, timeclock export and weekly counts together in a checked dashboard you update every Monday. Build a report from your data free
The point of prime cost isn't the percentage. It's the Monday conversation: which of the five causes moved it, and what changes on this week's schedule and smoke plan because of it.