For a year, the owner of Blue Heron Diner, an example business, told her bank that labor ran at about 30% of sales. Last week's payroll report backed her up: $8,441 of wages against $27,600 of sales, or 30.6%. But restaurant labor cost percentage is total labor cost ÷ sales × 100, and total labor cost means wages plus salaries, employer payroll taxes and benefits. Counted that way, the week cost $10,201.42, or 37.0%.
The 6.4-point difference is employer taxes, tax on tips, insurance and benefits: $1,760 a week that's just as real as the wages. This guide works through the full calculation for Blue Heron, splits it into front and back of house, compares it with published survey data, and then turns it into the number you actually manage shift by shift, sales per labor hour, and a schedule built from a sales forecast.
What counts as labor cost
Labor cost % = total labor cost ÷ sales × 100, where sales are net sales from the POS (after discounts, before sales tax and tips), and total labor cost covers everything you pay because people work for you:
- Hourly wages, including overtime premiums and any training pay.
- Salaries for managers and chefs who work in the restaurant.
- Employer payroll taxes: Social Security and Medicare at 6.2% and 1.45% on the employer's side, plus federal and state unemployment taxes.
- Insurance and benefits: workers' compensation, health insurance contributions, paid leave, retirement contributions.
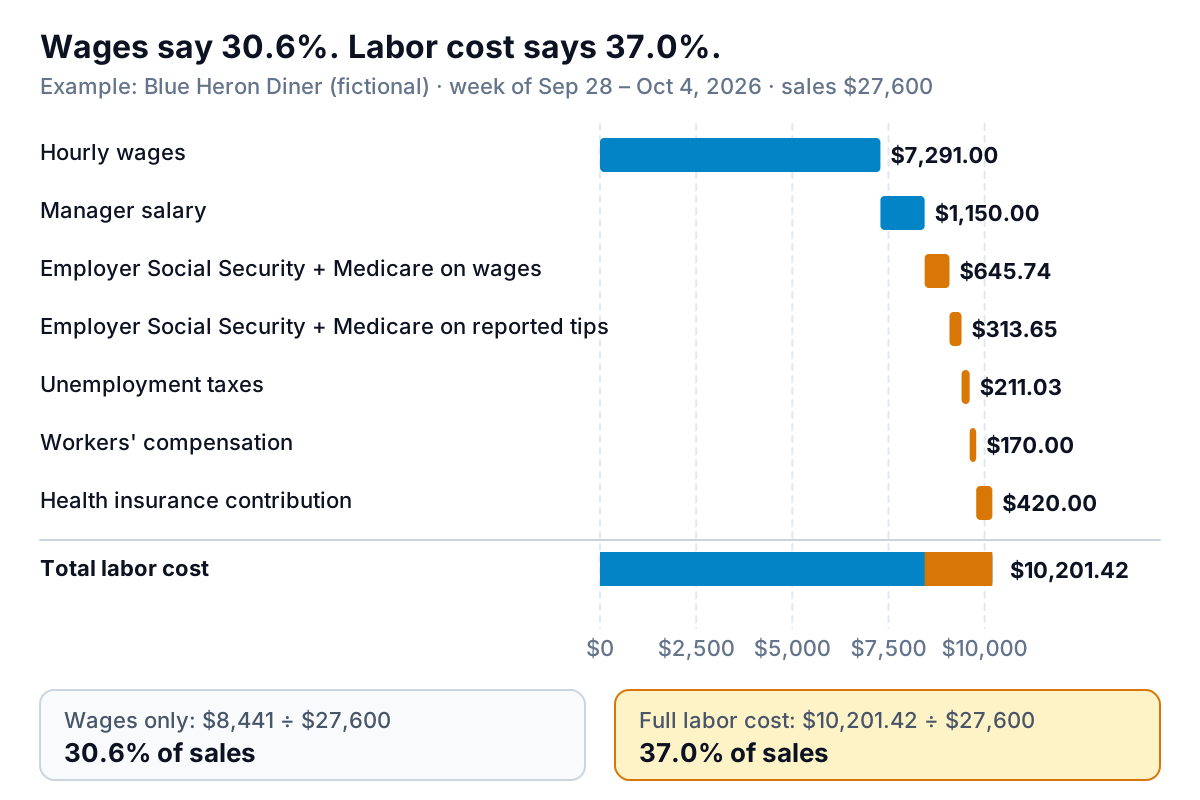
How big is the add-on for restaurants generally? The Bureau of Labor Statistics measures it. In June 2026, for private employers in accommodation and food services, wages and salaries averaged $16.18 an hour and benefits $3.85, so benefits were 19.2% of total compensation, or about 24 cents on top of every wage dollar. Legally required benefits (Social Security, Medicare, unemployment insurance and workers' compensation) were $1.82 of that. Blue Heron's 20.9 cents sits a little below the industry average, mostly because it offers a modest health plan.
Tips: not your cost, but the tax on them is
Tips your servers receive from guests aren't a labor cost; the guest paid them. But the IRS says employers must pay the employer share of Social Security and Medicare taxes on reported tip income, as well as on wages. At Blue Heron, servers reported $4,100 of tips for the week, so the diner owed $313.65 of employer tax on money it never paid out. That line belongs in labor cost.
The same IRS page describes a credit for some of that tax, the FICA tip credit under section 45B, claimed on Form 8846. It's an income tax credit, not a payroll refund, so keep the tax in your weekly labor cost and ask your accountant whether you qualify for the credit at year end.
Tipped wages are also why front-of-house labor looks cheap. Under federal law an employer can pay a tipped worker as little as $2.13 an hour in cash wages if tips bring them up to the $7.25 minimum wage. Many states set their own, higher rules. In this example, Blue Heron's state lets it pay servers $8.00 an hour plus tips. Check your own state's rules with your payroll provider before you plan around a tipped wage.
Front of house vs back of house
One labor percentage hides two different jobs. Kitchen hours follow the volume and complexity of the food. Dining room hours follow the number of tables open. Split them and each manager owns a number.
| Group | Hours | Wages | % of $27,600 sales |
|---|---|---|---|
| Line cooks | 196 | $3,724 | 13.5% |
| Dishwashers | 66 | $1,023 | 3.7% |
| Back of house | 262 | $4,747 | 17.2% |
| Servers (tipped, $8.00/hr) | 168 | $1,344 | 4.9% |
| Hosts and bussers | 80 | $1,200 | 4.3% |
| Front of house | 248 | $2,544 | 9.2% |
| Manager (salaried) | – | $1,150 | 4.2% |
| All wages and salaries | 510 | $8,441 | 30.6% |
The kitchen takes almost twice the dining room's share, even though the two groups work about the same hours. That's normal for a diner with tipped servers, and it means the kitchen schedule is where most of the money is. Payroll taxes and benefits come on top of these wages, which takes the total to 37.0%.
Restaurant labor cost percentage: what the surveys say
Search for a benchmark and you'll find tidy ranges, such as 20–25% for quick service and 30–35% for fine dining. We couldn't find a published survey with a stated sample behind any of them, and they're lower than the best data we did find.
The National Restaurant Association's 2025 Restaurant Operations Data Abstract, built from data supplied by more than 900 operators, found that salaries and wages, including benefits, were a median of 36.5% of sales at full-service restaurants in 2024 and 31.7% at limited-service restaurants. In the 2010, 2013 and 2016 editions, the figures were about 33% and 28%. Labor has taken a bigger share of sales over the decade, and the Association reported in 2026 that average hourly earnings of restaurant employees were 41% above pre-pandemic levels.
Blue Heron, a full-service diner with a restaurant labor cost percentage of 37.0%, is close to that median. Two cautions before you compare yourself:
- The Association describes its measure as salaries and wages including benefits. It doesn't spell out how payroll taxes are treated, so a number built the way this guide recommends may run slightly higher than the survey's.
- A median describes the middle restaurant, not a healthy one. The same survey put median income before taxes at 2.8% of sales for full-service restaurants. Matching the middle on labor leaves very little room.
Labor only makes sense next to food. A diner with cheap ingredients can carry more labor than a steakhouse. Track the two together as prime cost, and see our food cost percentage guide for the other half.
Sales per labor hour: the number you can schedule with
A labor percentage tells you how last week went. You can't schedule with it, because you don't know sales in advance. Sales per labor hour (SPLH) turns the target into hours:
SPLH = sales ÷ hours worked by hourly staff.
Blue Heron did $27,600 of sales with 510 hourly staff hours: $54.12 per labor hour. Salaried hours are left out because they don't change with the schedule.
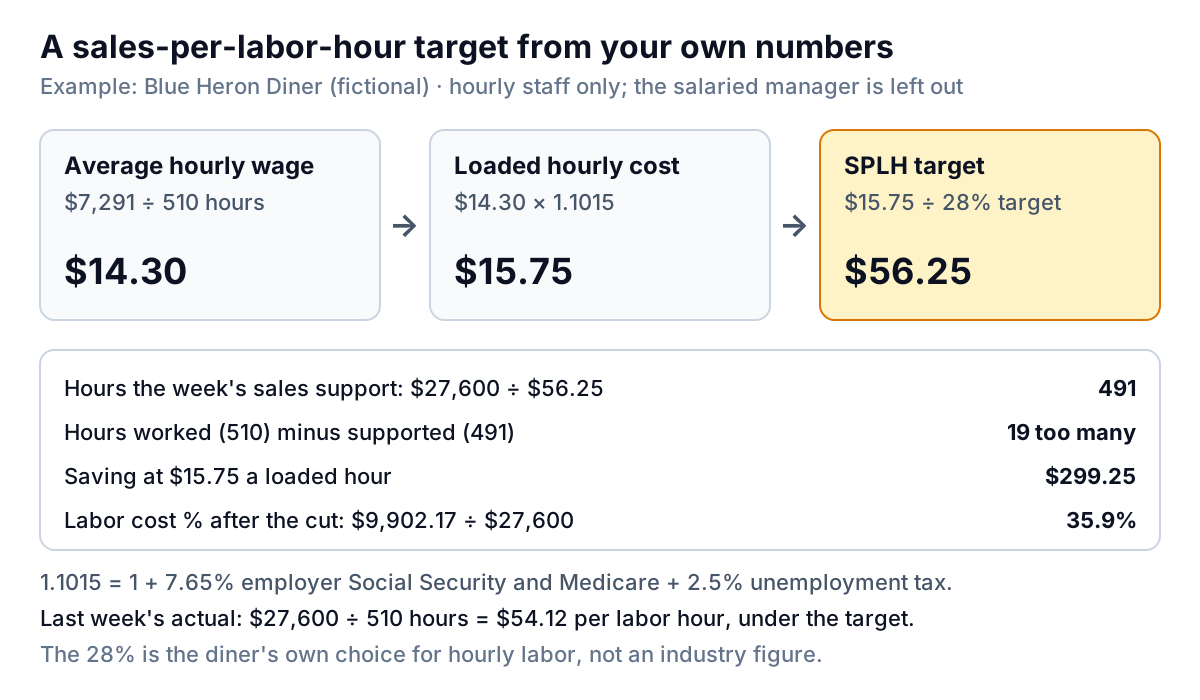
To set a target, start from what an hour costs you and what share of sales you want hourly labor to take:
- Average hourly wage: $7,291 ÷ 510 hours = $14.30.
- Loaded with the employer's 7.65% Social Security and Medicare and, in this example, 2.5% unemployment tax: $15.75.
- Divide by the share of sales you want hourly labor to take. Blue Heron chose 28%: $15.75 ÷ 0.28 = $56.25 SPLH.
At $56.25, last week's $27,600 supported 491 hours. The diner worked 510. Nineteen fewer hours at $15.75 would have saved $299.25 and brought labor cost from 37.0% to 35.9%.
Scheduling to a sales forecast
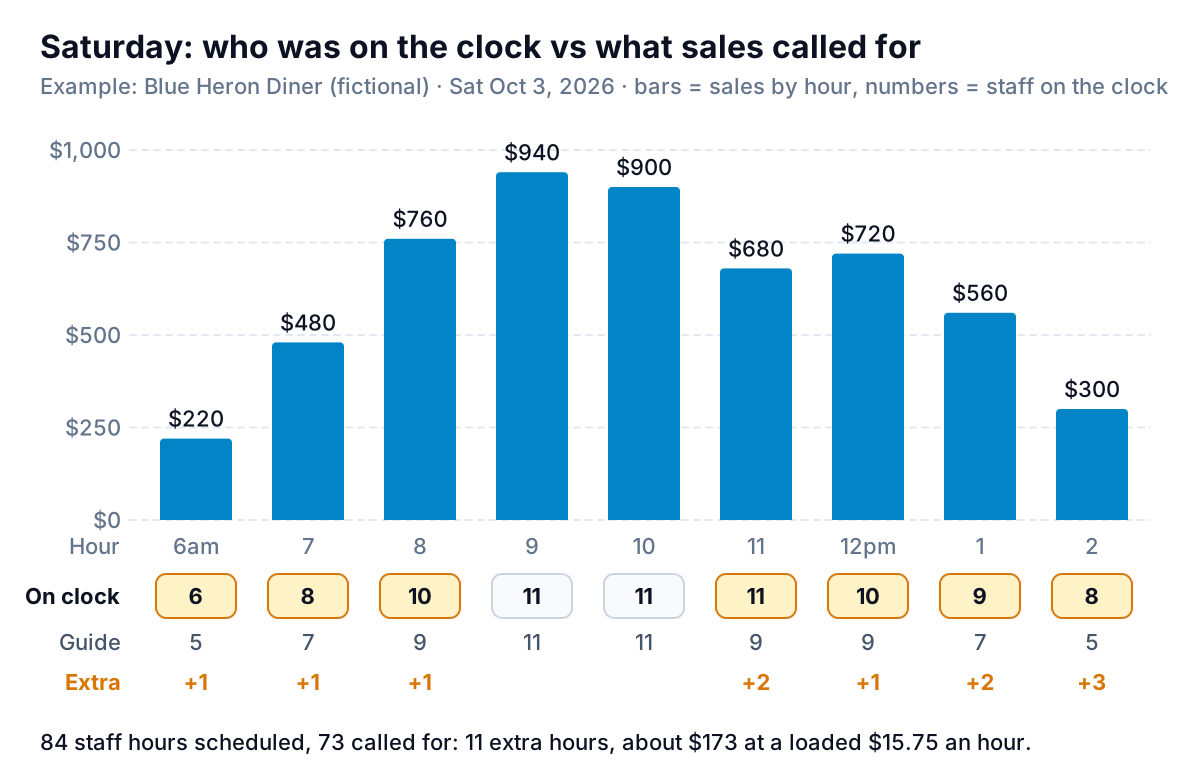
Finding those 19 hours means looking hour by hour, because labor is wasted in the slow edges of a shift, not at the peak.
Blue Heron's fix is a short routine any small restaurant can copy:
- Forecast sales by hour. Average the same day and hour over the last four weeks from your POS hourly sales report, then adjust for anything you know: a holiday, a local event, rain.
- Write a staffing guide. Blue Heron's own guide, built from its busiest smooth-running shifts: up to $300 an hour needs 5 people (two cooks, a dishwasher, a server and a host or busser, the minimum crew), $301–600 needs 7, $601–800 needs 9, above $800 needs 11.
- Schedule to the guide, with cut times. Put the time each shift is expected to end on the schedule, so the manager can send people home when the rush ends without a discussion.
- Check hours on Thursday. Look at hours worked so far against the schedule, and catch anyone heading for overtime before the weekend.
- Compare on Monday. SPLH by day and labor cost % for the week, against the target.
On Saturday, the diner had 84 staff hours on the clock against 73 in its guide: 11 extra hours, or about $173 at the loaded rate. Eight of the 11 were after 11am, when people who came in for the rush stayed on after it ended.
Mistakes that make the labor number lie
- Wages only. The most common one, and the reason Blue Heron's owner had been quoting 30.6%.
- Payroll dates instead of work dates. A biweekly paycheck lands in one week and covers two. Use timeclock hours for the week you're measuring, and accrue salaries weekly.
- Gross sales as the denominator. Sales tax and tips in the sales figure make labor look smaller than it is.
- Ignoring the owner's labor. If you work a station and pay yourself nothing, your labor cost looks better than a buyer or a lender will see it.
- Cutting the minimum crew. SPLH targets don't apply to the first hour of the day. You need a cook and a server whether one table comes in or ten. Cut the edges, not the base.
- Chasing the percentage in a slow week. When sales fall, labor % rises even if the schedule was right. Look at SPLH and hours first.
The weekly routine needs three exports: POS sales by hour, the timeclock report and payroll totals. Parity builds a labor dashboard from them: connect Square directly for sales, or upload the exports as Excel or CSV files, and you get headline numbers with their trends, charts, what explains them and a table of what needs attention, such as the days where SPLH fell furthest below target. Every number is checked against queries on the full dataset before you see it. Ask by chat to split labor by front and back of house, then update the dashboard with next week's files. Our budget vs actual guide shows how to compare the week against plan, and the restaurant inventory template covers the food half of the same Monday routine.
Upload your POS and timeclock exports and get a checked dashboard of labor cost %, sales per labor hour and the shifts that ran over. Build a report from your data free
Restaurant labor cost percentage is the score. Sales per labor hour and the hourly schedule are the play. Get the full labor cost right once, set an SPLH target from your own wages, and the Monday number stops being a surprise.