It's 11pm on a Sunday at Olive & Ember Trattoria, an example restaurant we'll follow through this guide, and two people are standing in the walk-in with a clipboard. An hour later they have a list: 12 lb of mozzarella, 15 lb of Parmigiano, 26 lb of chicken thighs. On its own, that list is worth almost nothing. It only earns the hour when it turns into dollars, and the dollars turn into one number: how much food the kitchen used last week against what it sold.
This restaurant inventory template does that. You count by storage area in shelf order, the sheet prices every line from your invoices, and a summary tab works out usage, food cost % and days of stock on hand. Download the restaurant inventory template (.xlsx). It opens in Excel, Google Sheets and Numbers, with no macros and no links to other files.
What's in the restaurant inventory template
The workbook has five tabs:
- How to use: the steps below, in short, plus what each formula does.
- Example count: 38 items for the fictional Olive & Ember, counted on Sunday, October 4, 2026, across five storage areas: walk-in cooler, freezer, dry storage, line reach-ins and bar.
- Example food cost: the summary for that week, with food and bar worked out separately.
- Your count and Your food cost: the same two sheets, empty, with every formula in place for 150 items.
Shaded cells are the ones you type. Everything else is a formula. Copy the formulas down if you add rows, and don't type over them.
Set up the count sheet once
Most of the work happens the first time. After that, each count is just typing quantities.
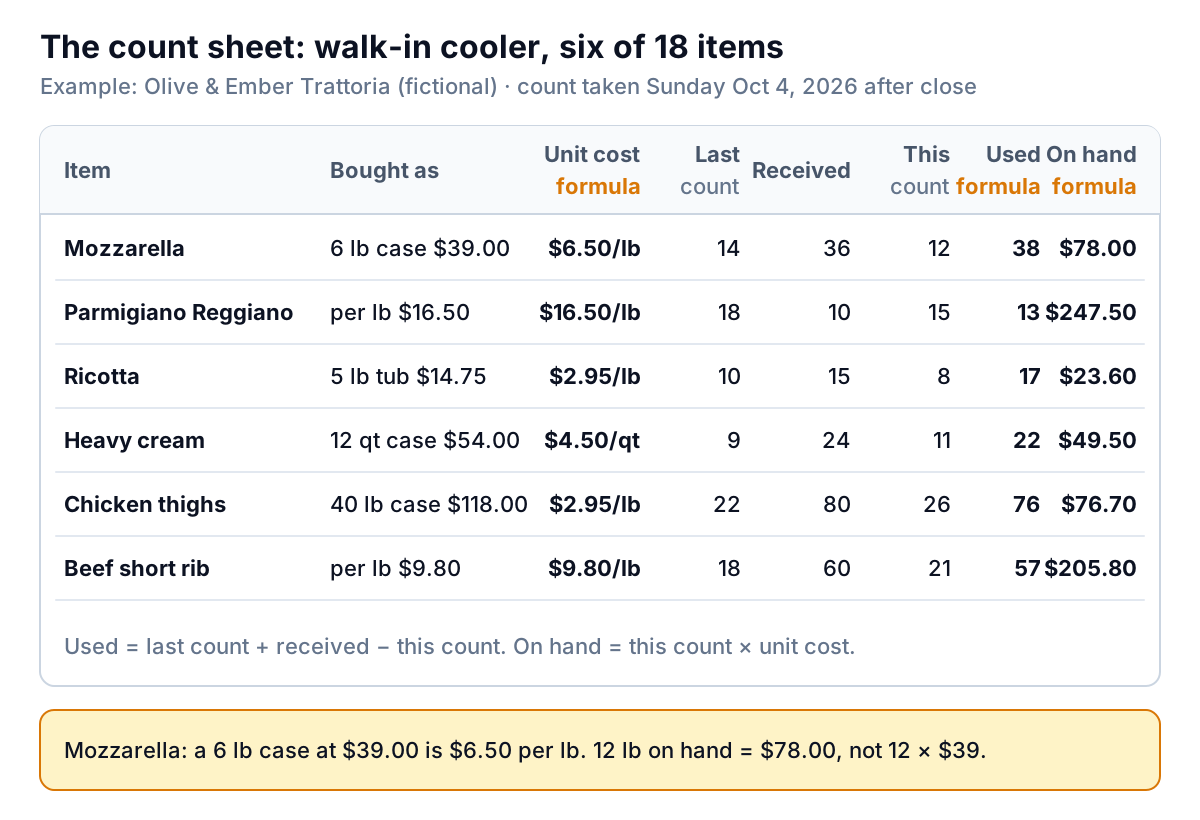
The input columns, left to right:
- Storage area: where the item lives. List items in the order they sit on the shelves, walking the room left to right, top to bottom. A count in shelf order is faster and misses less, because nobody has to hunt for the next line.
- Item and Category: categories are yours to choose (Protein, Produce, Dairy & eggs, Dry goods, Wine, Beer, Spirits). Keep the list short. The summary adds up usage by category, so ten categories is useful and forty isn't.
- Cost group: Food or Bar. The sheet works out a separate cost % for each. Put coffee, tea and soft drinks in Food if you want your number to match how the National Restaurant Association measures it; more on that below.
- Count unit and Purchase unit: you buy mozzarella by the 6 lb case and count it by the pound. You buy wine by the 12-bottle case and count bottles, including partial ones in tenths.
- Count units per purchase unit: the bridge between the two. Six for the mozzarella, 12 for the wine, 180 for a case of eggs counted singly.
- Price per purchase unit: the latest invoice price. Update it when a delivery comes in at a new price.
- Last count, Received this period, This count: the three quantities, all in count units.
- Par: how much you want on hand after a delivery. Leave it blank for items you don't order to par.
The formula columns, one by one
Columns L to S calculate. Here's what each does, using the mozzarella row.
| Column | Formula (row 5) | Mozzarella |
|---|---|---|
| Unit cost | =H5/G5 | $39.00 ÷ 6 = $6.50 per lb |
| Value on hand | =K5*L5 | 12 × $6.50 = $78.00 |
| Used | =SUM(I5:J5)-K5 | 14 + 36 − 12 = 38 lb |
| Used value | =N5*L5 | 38 × $6.50 = $247.00 |
| Order to par (count units) | =MAX(0,P5-K5) | 30 − 12 = 18 lb |
| Order to par (purchase units) | =ROUNDUP(Q5/G5,0) | 18 ÷ 6 = 3 cases |
| Flag | see below | blank: nothing to check |
The real formulas are wrapped in IF tests so empty rows stay blank instead of showing zeros or errors. The flag column shows one of three messages:
- Add price and units: the item has no price or no count units per purchase unit, so it can't be valued.
- Not counted: the item is on the list but "This count" is empty. A missed line understates closing inventory, which overstates food cost.
- Check count or delivery: "Used" came out negative, so there's more on hand than last count plus deliveries. Either the count is wrong or a delivery wasn't written down.
From the count to food cost %
The summary tab turns the count into the number you actually manage. The formula is the standard cost of goods sold calculation, the same one IRS Publication 334 walks through in its "How To Figure Cost of Goods Sold" section, only run weekly instead of yearly:
Usage = opening inventory + purchases − closing inventory. Food cost % = usage ÷ food sales for the same dates.
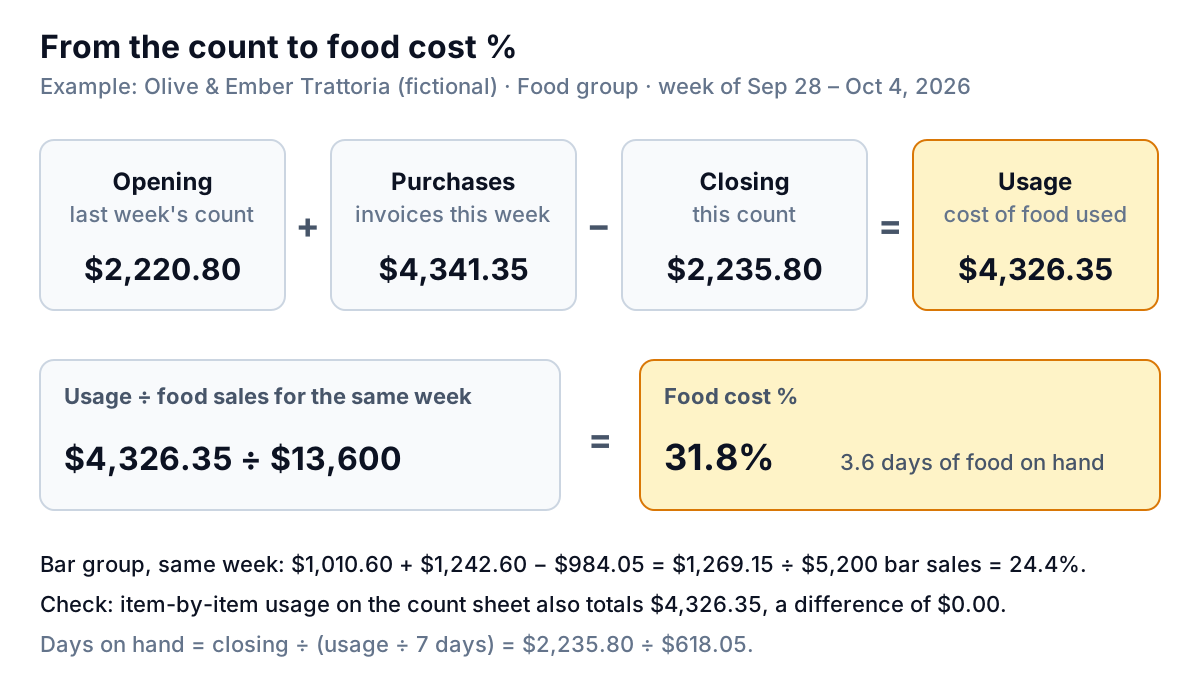
You type four things into the summary: the opening inventory (last week's closing value), purchases from the week's invoices net of credits, food sales from your POS for the same dates, and the period's start and end dates. The closing inventory adds itself up from the count sheet with SUMIF on the cost group column.
For the example week: $2,220.80 + $4,341.35 − $2,235.80 = $4,326.35 of food used, against $13,600 of food sales. Food cost was 31.8%. The bar did the same sum on its own lines: $1,269.15 used against $5,200 of bar sales, or 24.4%.
How does 31.8% compare? The National Restaurant Association's 2025 Restaurant Operations Data Abstract, based on data from more than 900 operators, found that food and non-alcohol beverage costs were a median of 32.0% of sales at full-service restaurants in 2024, and 32.4% at limited-service ones. That's why the template puts soft drinks and coffee in the Food group: it keeps your number close to the measure behind the benchmark. A median isn't a target, though. Your menu, prices and concept decide what your number should be, and our guide to food cost percentage covers how to set one from your own plate costs.
Two checks before you trust the number
Rows 15 and 16 of the summary add up usage a second way: item by item, from the "Used value" column. If every delivery was written in "Received" and every item you buy is on the sheet, the two totals match. In the example they agree to the cent. When they don't, the difference points at the problem: a missing invoice, a delivery nobody recorded, an item that's on invoices but not on the sheet, or a price that changed mid-week.
Row 13 gives days of stock on hand: closing inventory ÷ (usage ÷ days in the period). Olive & Ember had $2,235.80 of food on hand against $618.05 used per day, or 3.6 days. For a kitchen that takes deliveries most days, that's lean. If it creeps up to 8 or 10 days, cash is sitting on shelves and the oldest stock is closer to the bin.
Reading Olive & Ember's week
The category table on the summary shows where the money went.
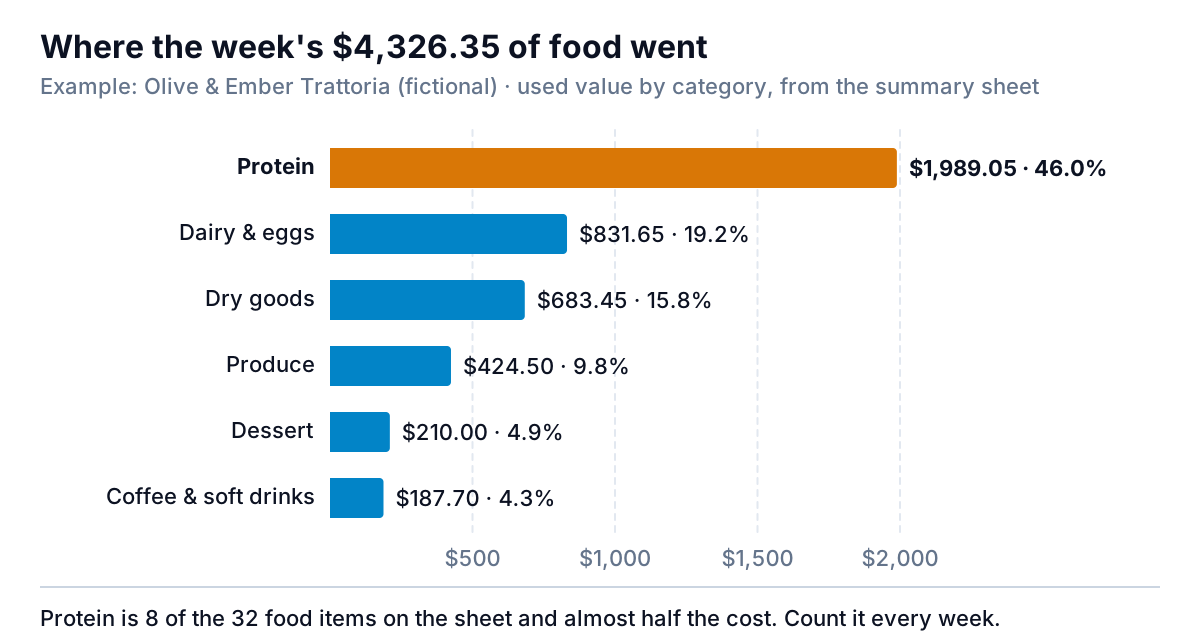
Three things stand out, and each suggests what to do next week:
- Protein is the count that matters. Eight lines out of 32 made up $1,989.05 of the $4,326.35. If you can't do a full count every week, count proteins and bar weekly and everything else monthly. You'll catch most of the movement for a fraction of the time.
- Short rib is the line to watch. The kitchen used 57 lb, at $9.80 a pound that's $558.60, more than any other single food item. If the trattoria sells a braised short rib, comparing 57 lb against the number of portions sold times the recipe weight shows whether portions are drifting. That comparison is plate costing, and the template doesn't do it for you.
- The bar runs leaner on stock. $984.05 on hand against $1,269.15 used in a week is 5.4 days. Wine by the case tends to sit longer than produce, and that's fine as long as it isn't growing.
Order to par turns the same sheet into Monday's order. Mozzarella needs 18 lb to get back to its par of 30, which rounds up to three 6 lb cases.
Counting so the numbers hold
A template can't fix a bad count. These habits matter more than any formula:
- Count at the same point every period. After close on the same day, before any delivery. Count on Sunday one week and Tuesday the next and you've shifted two days of usage between periods.
- Match the purchase cutoff to the count. Only invoices for goods received after the last count and before this one go into purchases. A Monday delivery entered in last week's purchases inflates last week's food cost and flatters this week's.
- Count in pairs. One person counts and calls out, the other writes. It's faster, and a second set of eyes catches the case of chicken behind the door.
- Count open containers honestly. Half a tub of ricotta is 2.5 lb, not a tub. Partial bottles go in tenths.
- Decide what to do with prepped food. A batch of marinara contains tomatoes you already paid for. Either leave prepped items off the sheet and accept a small swing, or add them as items with a recipe cost per quart. Pick one and stick to it.
- Keep the same count unit for an item forever. If one person counts eggs by the dozen and another by the case, the "Used" column turns into nonsense.
Every period, roll the sheet forward: copy "This count" into "Last count" (paste values only), clear "This count" and "Received", then type last period's closing value into the opening inventory cell on the summary.
What this template can't do
It's a counting and costing sheet, not an inventory system. Know its limits:
- Prices are the latest invoice price. It doesn't track FIFO or average cost, so in a week when prices jump, closing stock is valued at the new price.
- No recipes or plate costs. It tells you how much food you used, not how much you should have used. For that, cost each dish and compare, as the food cost percentage guide shows.
- No waste log or transfers. Comps, staff meals and spoilage all show up inside usage. If you want to see them separately, log them in a separate tab.
- No history. Each workbook is one period. To see a trend, keep each week's cost % in a running list, or save one file per week.
- Food only, not labor. Food cost is half of your prime cost. Our guides to prime cost and restaurant labor cost percentage cover the other half.
The no-history limit is the one that bites first. One week's 31.8% doesn't tell you much. Twelve weeks of it, next to your sales and purchases, tells you whether the kitchen is getting tighter or looser. That's where a dashboard earns its keep. Parity takes an Excel or CSV upload, such as a stack of these weekly count files or your POS sales export, and builds a dashboard with the headline numbers and their trends, charts, what explains them and a table of what needs attention. Square connects directly, so sales can come straight from your POS. Every number is checked against queries on the full dataset before you see it, and when next week's file arrives you update the dashboard with it instead of rebuilding. If you already track stock in a system, our inventory dashboard guide covers what else belongs on the page.
Upload your count sheets and sales export and get a checked dashboard of food cost, usage by category and stock on hand. Build a report from your data free
Whichever restaurant inventory template you use, the test is the same each Monday: can you say what food cost was last week, which category moved it, and what you're ordering because of it? If the count can't answer that, change the sheet until it can.