When the owner of Saffron Table, an example restaurant, costed her menu in the spring, almost every dish came out around 29%. Then the September P&L arrived with food cost at 34.6%. Food cost percentage is the share of food sales spent on the food itself: (opening inventory + purchases − closing inventory) ÷ food sales, which for September was $38,150 ÷ $110,300.
Both numbers are right. They just answer different questions. The menu figure is what food should cost if every plate goes out exactly to recipe. The P&L figure is what it did cost. The gap between them, 4.1 points of sales or $4,473 in one month, is the most useful number in a restaurant kitchen, and most owners never calculate it. This guide shows how to work out both, what a good food cost percentage looks like according to real survey data, and what to do when the gap opens up.
The food cost percentage formula, step by step
For a period (a week or a month):
Food cost % = (opening inventory + purchases − closing inventory) ÷ food sales × 100
The top half of the formula is the cost of the food you actually used, the same cost of goods sold calculation any business with stock uses. Our cost of goods sold formula guide covers the general version. In a restaurant, each input has a specific home:
- Opening inventory: the value of last period's closing count. Not an estimate; the actual counted, priced figure.
- Purchases: food invoices for goods received during the period, net of credits and returns. Pull them from your accounts payable or accounting software by received date, not paid date.
- Closing inventory: a count on the last day of the period, after close, priced at invoice cost. Our restaurant inventory template does the pricing and adding for you.
- Food sales: from your POS sales summary for the same dates, after discounts and before sales tax and tips.
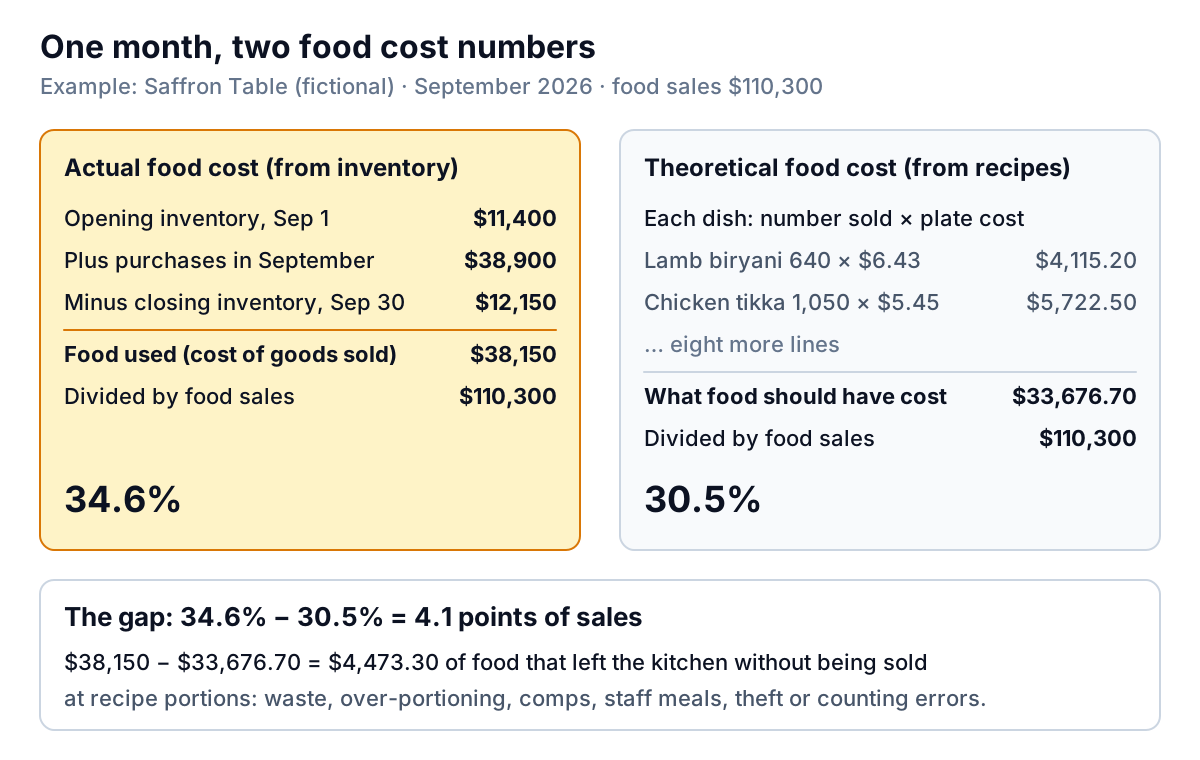
Saffron Table's September: $11,400 + $38,900 − $12,150 = $38,150 of food used. Divided by $110,300 of food sales, that's 34.6%.
Decide once what "food" means and never change it. Saffron Table puts lassi and chai in food and tracks beer and wine separately as beverage cost, so both the costs and the sales for drinks with alcohol stay out of this number. Paper goods, cleaning supplies and staff meals bought separately don't belong in food purchases at all; they're operating supplies or labor costs.
Plate cost: the food cost of one dish
The second number starts with a single plate. List every ingredient in the recipe, the portion, and its cost at today's invoice price, then add them up. Divide by the menu price and you have that dish's plate cost percentage.
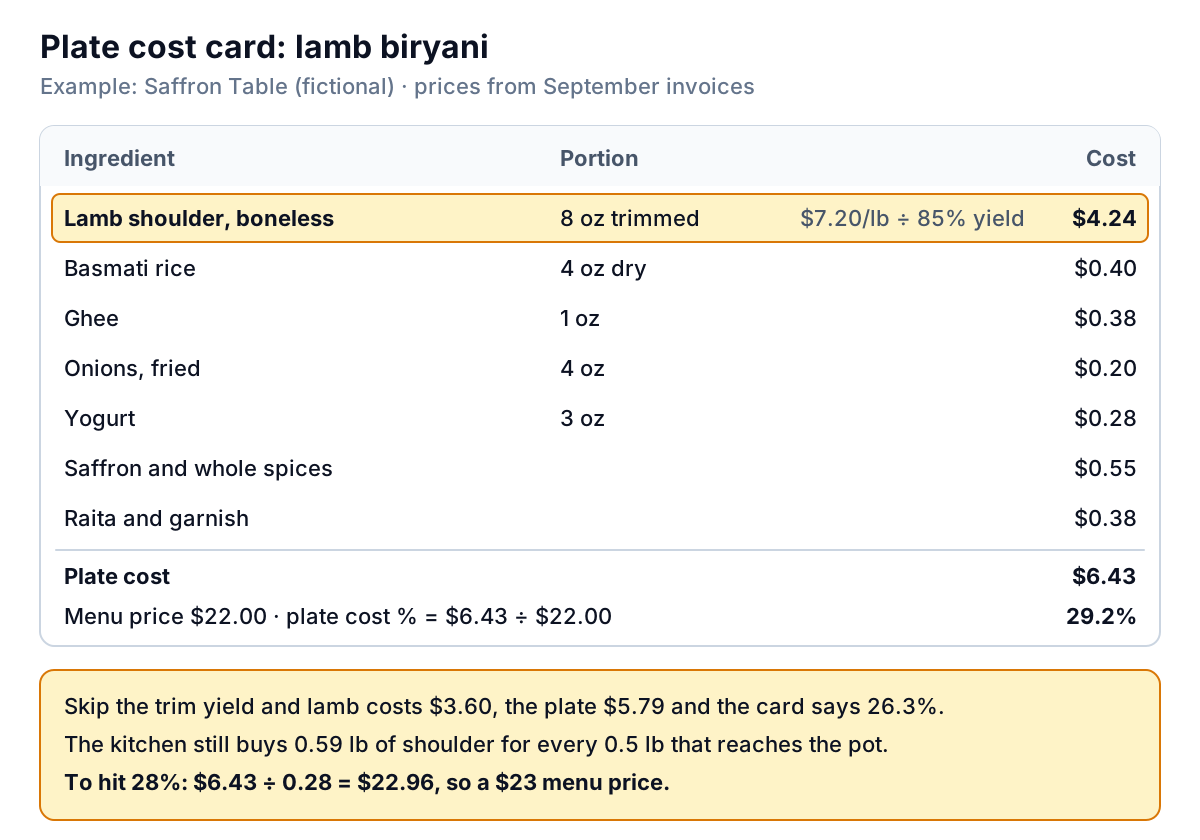
The step most cards skip is yield. Saffron Table buys boneless lamb shoulder at $7.20 a pound and trims it before it goes in the pot. In this example, 85% of what's bought makes it into the dish, so a half-pound portion needs 0.59 lb of purchased lamb, and costs $4.24, not $3.60. Measure yield yourself: weigh a case before and after trimming, a few times, and use the average. Do the same for anything you peel, trim, bone or cook down.
Plate cost also gives you a price. To hit a target plate cost percentage, divide plate cost by the target: $6.43 ÷ 0.28 = $22.96, so a $23 menu price would bring the biryani to 28%.
Don't price everything to the same percentage, though. Saffron Table's tandoori mixed grill runs at 35.9% plate cost ($10.40 on a $29 plate) and leaves $18.60 to cover labor, rent and profit. The dal makhani runs at 25.7% and leaves $10.40. The "worse" percentage earns $8.20 more per plate. A low percentage on a cheap dish doesn't pay the rent; dollars do. Our guides to contribution margin and margin vs markup go into this trade-off.
Theoretical vs actual: where the gap hides
Multiply each dish's plate cost by the number sold (from your POS product mix report) and add them up. That's theoretical food cost: what the month's food should have cost if every plate went out to recipe and nothing was wasted.
Saffron Table sold 640 lamb biryanis at $6.43, 1,050 chicken tikka masalas at $5.45, and so on across ten menu lines. The total came to $33,676.70, or 30.5% of food sales. Actual was 34.6%. The kitchen used $4,473.30 more food than its sales account for.
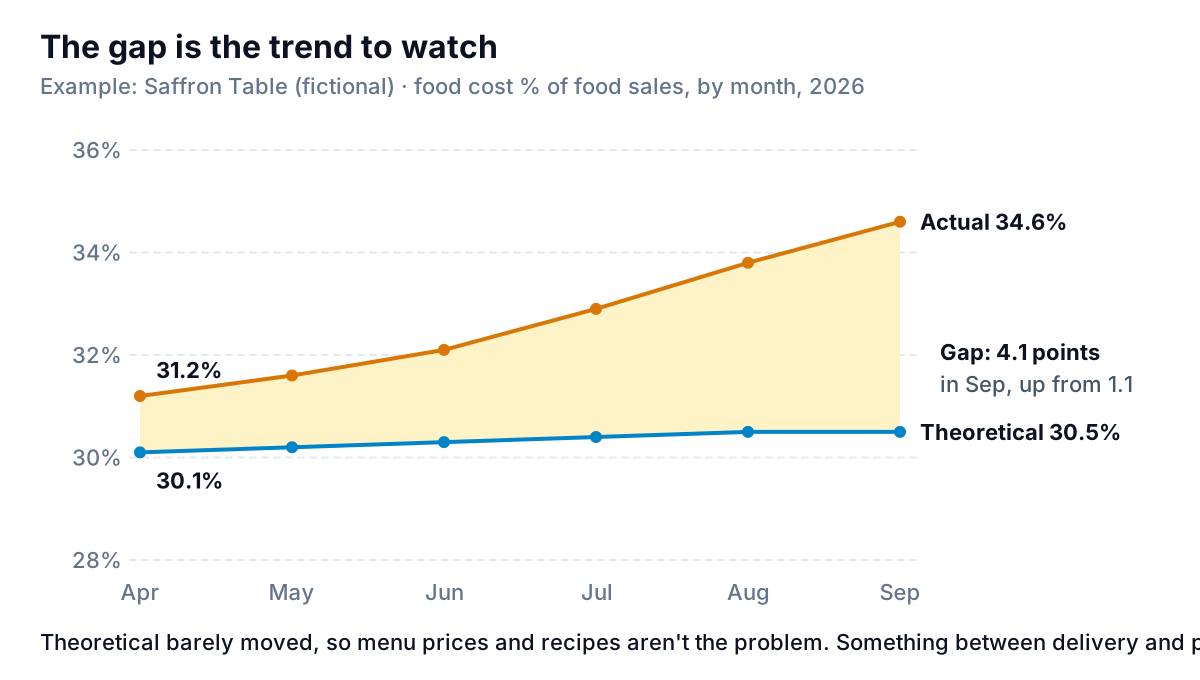
Because plate costs are updated from invoices every month, rising supplier prices show up in both lines. That's what makes the gap useful: it strips out price changes and leaves only what happened in the kitchen. A gap of 1 point in April was normal handling loss. Four points in September is $4,473 a month.
To find it, compare usage item by item for the expensive lines. "Should have used" is portions sold × raw weight per portion; "did use" comes from the counts (last count + received − this count).
| Item | Should have used | Did use | Over | Cost of the overage |
|---|---|---|---|---|
| Lamb shoulder ($7.20/lb) | 634.5 lb | 742.0 lb | 107.5 lb | $774.00 |
| Chicken thighs ($3.10/lb) | 580.5 lb | 712.0 lb | 131.5 lb | $407.65 |
| Paneer ($6.40/lb) | 168.0 lb | 205.0 lb | 37.0 lb | $236.80 |
| Comps and staff meals ($1,120 at menu price, at 30.5%) | – | – | – | $341.60 |
| Explained so far | $1,760.05 |
Three proteins and the comps explain $1,760.05 of the $4,473.30. Lamb alone is 107.5 lb over, about 17% more than the recipes call for. That points to portioning at the station, a yield that's worse than the card assumes, or meat leaving through the back door. A scale on the line and a re-test of the trim yield will tell you which. The other $2,713.25 is spread across smaller items and unlogged waste, and a simple waste sheet by the bin for a month usually shows where.
What is a good food cost percentage?
The most useful published benchmark comes from the National Restaurant Association. Its 2025 Restaurant Operations Data Abstract, built from data supplied by more than 900 operators, found that food and non-alcohol beverage costs were a median of 32.0% of sales at full-service restaurants in 2024, and 32.4% at limited-service restaurants. In the 2010, 2013 and 2016 editions, the averages were about 34% for full-service and about 33% for limited-service.
Three things to know before you compare:
- It's a median, not a goal. The Association itself says the figures are not intended to represent standards or goals for individual restaurants. Half the respondents were above it.
- Match the definition. The measure covers food and non-alcohol beverages. If you put soft drinks in beverage cost, or divide by food sales alone when your bar sells a lot, your number isn't comparable.
- Beware the round ranges. You'll see "28–35%" and similar ranges repeated across restaurant software blogs. We couldn't trace them to a published survey with a stated sample, so treat them as rules of thumb, not data.
A better target comes from your own menu. Take your theoretical food cost and add an allowance for unavoidable loss, say 1 to 1.5 points. For Saffron Table that's 30.5% + 1.5 = 32%. Anything above it is money to go and find. Then check the target against the rest of the P&L: food cost plus labor (your prime cost) has to leave room for rent, utilities, card fees and profit. If your food target is fine but your labor cost percentage is high, the menu may need to change anyway.
And keep an eye on prices. The USDA's Economic Research Service forecasts wholesale beef prices rising 8.5% in 2026, while prices for food away from home, which includes restaurant meals, are forecast to rise 3.5%. A beef-heavy menu costed in January may be several points out by autumn.
Mistakes that make the number lie
- Mismatched dates. A monthly count against invoices pulled by paid date, or POS sales for a different week. Every input has to cover the same days.
- Counting by case price. Valuing a half-used case of mozzarella at the full case price inflates closing inventory and makes food cost look better than it is.
- Skipping the count. Using last month's closing figure again because nobody counted. The error lands in next month's number.
- Stale plate costs. A menu costed once at opening tells you nothing two years later. Re-cost the top 15 sellers whenever a big invoice price moves.
- Gross sales in the denominator. If sales include tax or tips, or exclude discounts and comps inconsistently, the percentage shifts with things that have nothing to do with food.
- Reacting to one week. Weekly food cost bounces with deliveries and counting noise. Act on two or three periods, not one.
Decision rules
| What you see | Likely cause | What to do |
|---|---|---|
| Actual above theoretical by 2+ points for two periods | Waste, portioning, comps, theft or counting | Item-level usage on the top 10 cost lines; scale on the line; waste sheet for a month |
| Theoretical itself rising | Supplier prices up, menu prices flat | Re-cost, then re-price or re-spec the dishes with the biggest dollar change |
| Actual below theoretical | Counting or cutoff error, or recipes written too generously | Re-check the closing count and invoice dates before celebrating |
| Food cost fine, profit still thin | Labor or occupancy | Look at prime cost and the rest of the P&L |
Once you work out both numbers each month, the next job is seeing them side by side over time. Parity builds a dashboard from your own exports: upload your monthly counts, invoice list and POS product mix as Excel or CSV files, or connect Square or QuickBooks Online directly, and it builds the headline numbers with their trends, charts, what explains them and a table of what needs attention. You can ask it by chat to add theoretical vs actual food cost by month, and every number is checked against queries on the full dataset before you see it. Ask and it writes the monthly report for a business partner from the same data.
Upload your counts, invoices and product mix and get a checked dashboard of food cost by month, with the lines that moved it. Build a report from your data free
A food cost percentage on its own is a grade. Next to theoretical, it's a to-do list: how many dollars left the kitchen last month without being sold, and which three items to weigh first.