Thirty-one dollars. That's what one wrong order costs Railside Fulfillment, an example warehouse that packs online orders for three brands, once it reaches the customer. Caught at the pack station, the same mistake costs $1.10. A warehouse KPI shows you where mistakes like that start: each one measures one stage of the trip every unit makes, from the receiving dock to the customer's door. Five cover a small operation: dock-to-stock time, inventory accuracy (locations that match the system ÷ locations counted), pick rate (lines picked ÷ picker hours), order accuracy (orders shipped without error ÷ orders shipped) and cost per order (warehouse costs ÷ orders shipped).
In September Railside shipped 18,400 orders, and 99.60% of them reached customers correct. The owner was pleased with that number until she worked out what the other 0.40% cost, and found that one of her three clients was losing her money on every order despite a healthy-looking average.
This guide walks an order through the building, one KPI per stage, then adds the two numbers that turn the operation into money: the cost of an error and cost per order by client.
Five warehouse KPIs, one for each stage
Every order passes through the same four stages: stock is received, stored, picked, then packed and shipped. Put one number on each stage and one on the whole trip, and you can tell where a problem started instead of discovering it at the end.
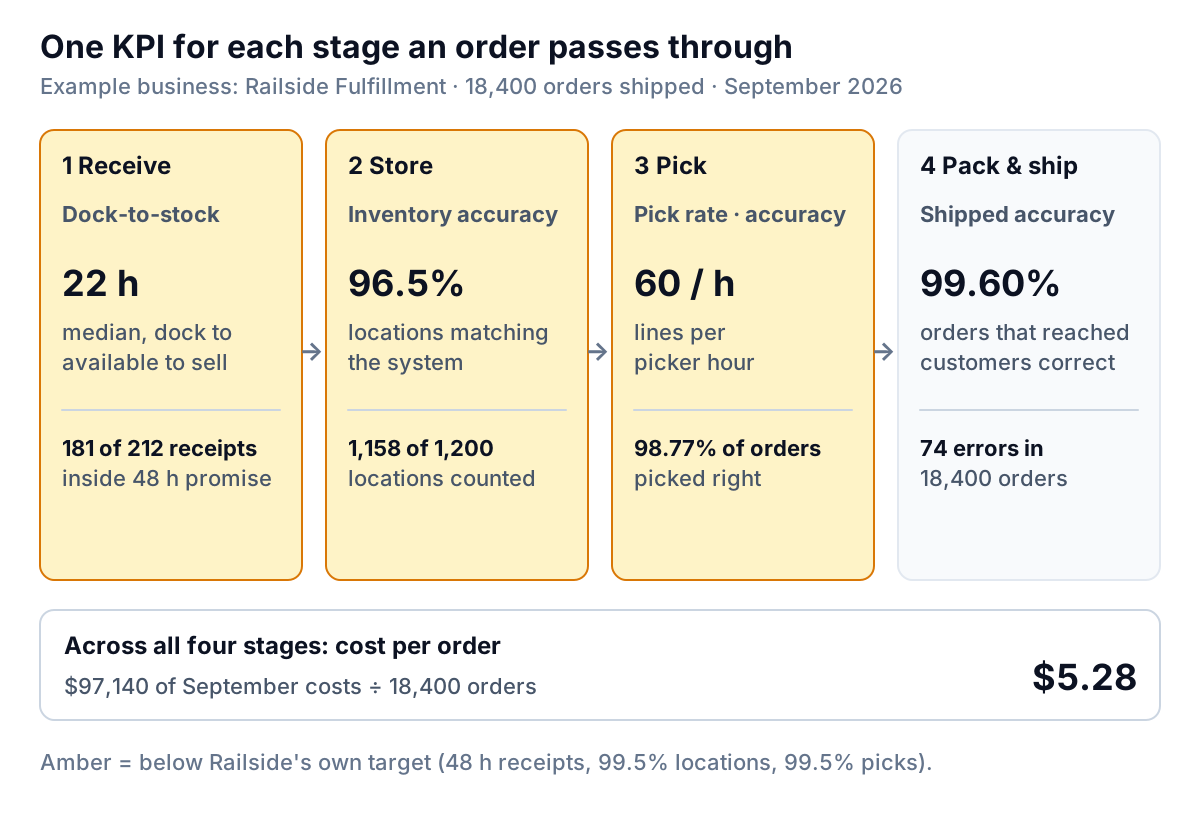
Each KPI below has a formula, Railside's figure, and what to do when it moves. One more number belongs on the page even though it isn't a stage: on-time shipping, the share of orders that left by the cutoff you promised. Railside promises same-day dispatch for orders in by 2 p.m. and hit it on 17,940 of 18,400 orders, or 97.5%.
Receive: dock-to-stock time
Dock-to-stock time = time from a delivery arriving at the dock to its stock being put away and available to sell in the system. Until that moment, the stock is in the building but can't be ordered, so the client's store shows it as sold out.
Railside handled 212 receipts in September. The median took 22 hours, but one in ten took more than 61. Its contracts promise stock available within 48 hours, and 181 of 212 receipts (85.4%) made it. Report the median and the share inside your promise, not the average. One pallet stuck for a week behind a missing purchase order drags the average up while telling you nothing about a typical delivery.
When dock-to-stock slips, the cause is usually one of three things. Deliveries arrive without paperwork, so receivers stop to chase it. Receiving staff get pulled onto picking at busy times, so receipts wait. Or putaway locations aren't decided until the pallet is on the floor. Record which one held up each late receipt, and the fix usually picks itself: ask clients for an advance shipping notice before trucks arrive, or ring-fence receiving hours on peak days.
Store: inventory accuracy
Inventory accuracy (by location) = locations where the counted quantity matches the system ÷ locations counted. Count by location rather than by total units. A warehouse can hold exactly the right number of a product overall while half of it sits in the wrong bin, and a picker sent to the wrong bin will either short the order or grab something else.
Railside cycle counts a slice of its locations every week instead of shutting down for a full count. In September it counted 1,200 locations and 1,158 matched: 96.5%, against its own target of 99.5%. Two habits make the figure trustworthy:
- Decide the tolerance before you count. Railside counts a location as wrong if it's off by a single unit. A looser rule gives a nicer number and hides the problem.
- Record the cause of every miss. Unrecorded putaways, picks from the wrong bin, damaged stock removed without an adjustment, and client returns put back without a scan are the usual four.
Inventory accuracy comes before pick accuracy for a reason: if the system is wrong about what's in a bin, even a perfect picker will ship the wrong thing. If you also manage the stock levels themselves, our inventory dashboard guide covers reorder points and slow movers.
Pick: pick rate and picking accuracy
Pick rate = order lines picked ÷ picker hours. Use lines (one product on one order) rather than units or orders. A line of 40 identical items takes about as long as a line of one, and orders vary too much in size to compare.
Railside picked 33,120 lines in September in 552 picker hours: 60 lines an hour. Its pickers, packers and shippers together worked 1,172 hours, so the broader figure, lines picked and shipped per person-hour, was 28.3. Know which one you mean when you compare: the first measures pickers, the second the whole outbound team.
Picking accuracy = orders picked without error ÷ orders picked. This counts errors wherever they're found. Railside's packers caught 166 mis-picks at the pack station, and customers reported 60 more, so 226 of 18,400 orders were picked wrong: 98.77% right.
Watch the two numbers together. A pick rate that rises while picking accuracy falls usually means people are being pushed for speed. Pick rate also drops for reasons that aren't the pickers' fault: fast sellers stored at the back of the building or on the top shelf, or single orders picked one at a time when they could be batched. Before you push for speed, look at the walk.
Pack and ship: order accuracy and the cost of an error
Order accuracy (shipped) = orders that reached the customer with no error ÷ orders shipped. This is the customer's view. Railside's clients reported 74 problem orders out of 18,400, so 99.60% arrived correct.
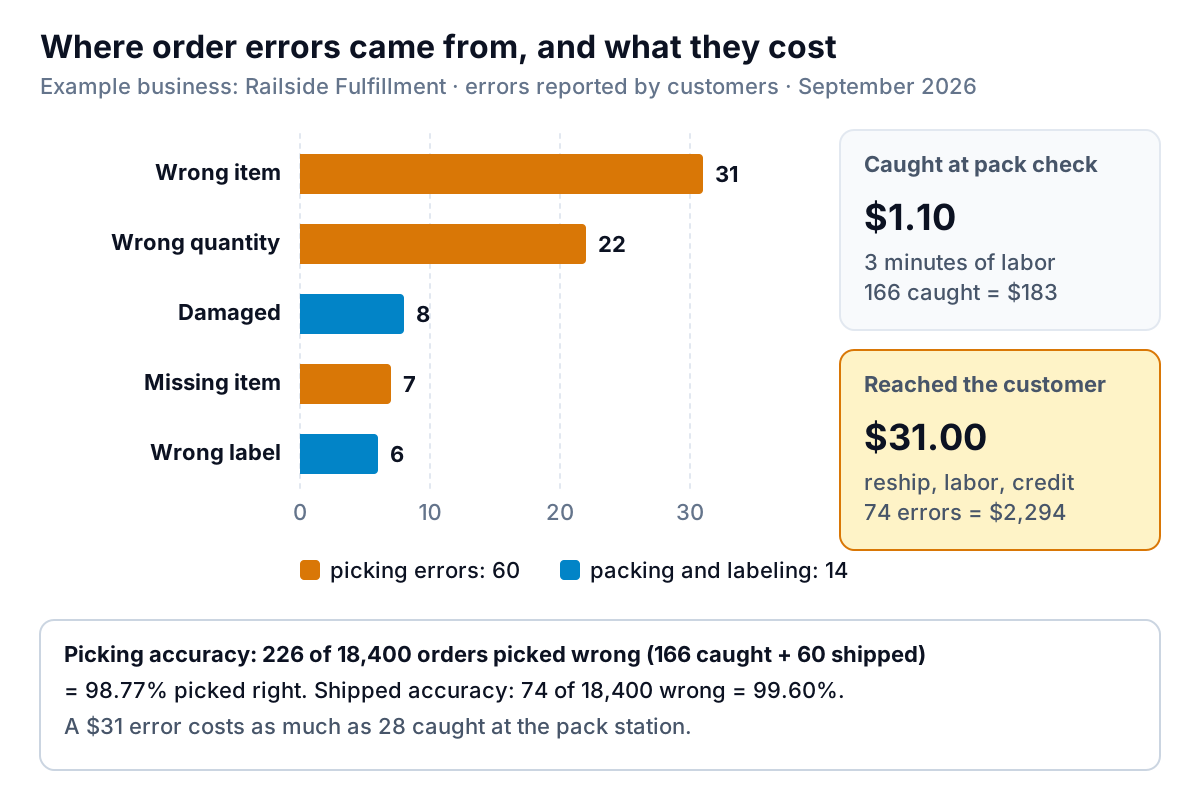
The percentage hides the cost, so put a price on each kind of error. At Railside, an error caught at the pack station takes about three minutes to fix, or $1.10 of labor at its loaded rate of $22 an hour. An error that reaches the customer costs about $31.00: $9.80 to post a replacement, $4.40 of labor to process it, and a $16.80 product credit to the client. So September's 74 shipped errors cost about $2,294, while the 166 caught at packing cost about $183.
That arithmetic tells you where to spend. A pack-station scan check, which confirms each item's barcode against the order before the box is sealed, catches errors at $1.10 instead of $31. Sorting the causes biggest first, as in a Pareto analysis, shows the next target: wrong items and wrong quantities make up 53 of the 74 errors. Look at which products they involve. Lookalike items stored next to each other are a frequent culprit, and the fix is to move one of them.
Cost per order, client by client
Cost per order = total warehouse operating costs for the period ÷ orders shipped. Include labor with payroll taxes and benefits, rent, packaging materials, equipment, software and utilities. Railside's September costs were $97,140: $62,040 of labor (2,820 hours at $22), $18,500 of rent, $9,400 of packaging and $7,200 of equipment, software and utilities. Over 18,400 orders, that's $5.28 an order. Its clients paid an average of $6.01 in fees per order, so the warehouse kept about $0.73 an order before overheads like the owner's salary.
The average is the dangerous part. Split it by client, and a different picture appears.
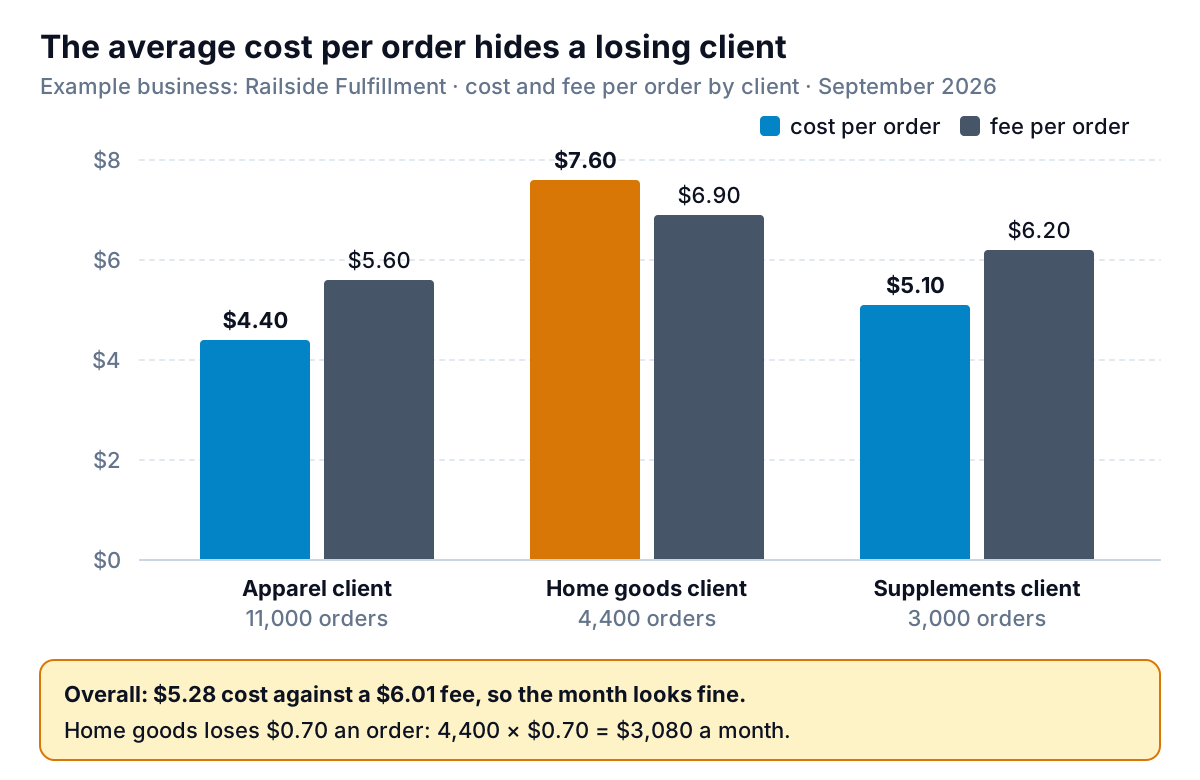
To split costs by client, assign each cost by what drives it: labor by the hours your warehouse management system or timesheets record against each client's orders, rent by the pallet positions each client's stock occupies, and packaging by what each client's orders actually used. It doesn't have to be exact to the cent. Railside's split showed that the home goods client's orders cost $7.60 each against a $6.90 fee, a loss of $0.70 an order or $3,080 a month, hidden inside a healthy average. The fix is a pricing conversation, backed by the numbers: a per-cubic-foot storage fee, a per-item pick charge, or a surcharge for oversized orders. The same logic applies to an in-house warehouse; split by product line or sales channel instead of client. Our contribution margin guide explains why this per-unit view matters more than the overall average.
How Railside compares, and why it barely matters
The best-known benchmarks come from the Warehousing Education and Research Council (WERC), which surveys warehouse and distribution managers with DC Velocity each year. Forklift maker Yale's summary of the 2025 DC Measures report lists the best-in-class levels, defined as the top 20% of respondents:
| Measure (WERC 2025) | Best-in-class | Railside, Sept |
|---|---|---|
| Order-picking accuracy (by order) | ≥ 99.68% | 98.77% |
| Dock-to-stock cycle time | < 3.5 hours | 22 hours (median) |
| Inventory count accuracy by location | ≥ 99.5% | 96.5% |
| Lines picked and shipped per person-hour | ≥ 70 | 28.3 |
| On-time shipments | ≥ 99.5% | 97.5% |
Railside is short on every line, and that's less alarming than it looks. These are the top fifth of a self-selected group of respondents, many running large distribution centers with scanning, automation and full-pallet flows that a small pick-and-pack operation doesn't have. A dock-to-stock time measured on full pallets of one product isn't the same job as receiving 40 mixed cartons from a small brand. DC Velocity covered the 2026 edition in July; its full benchmark data is available from WERC rather than in the press coverage. Use the table as a sense of what's possible, and judge yourself against your own last six months.
Running the warehouse KPI review each week
Most of these numbers come from your warehouse management system (WMS) or, in a smaller operation, from your order platform, a shipping tool and a spreadsheet. You need four exports: receipts with arrival and putaway times; cycle counts by location; orders with pick and ship timestamps and an error flag; and hours worked by task. Costs come from your accounting software.
A weekly 20-minute review works well:
- Customer view first. Shipped order accuracy and on-time shipping. Any errors this week? What were they?
- Causes. Picking accuracy and inventory accuracy, with the top reason for each.
- Flow. Dock-to-stock: any receipts outside your promise, and why?
- Money, monthly. Cost per order overall and by client or channel, against what you charge.
Mistakes that make warehouse KPIs flatter you
- Counting only customer-reported errors. Customers don't report everything. Count errors caught at packing too, or picking accuracy will look better than it is.
- Averages on time measures. Use the median and the share inside the promise.
- Counting accuracy by total units. Overs and unders cancel out. Count by location.
- Measuring pick rate in orders. A week of big orders looks slow and a week of small ones looks fast. Use lines.
- One cost per order for everyone. Split it by client, channel or product type, or a losing account hides in the average.
If you're tracking a broader set of operating numbers alongside these, the operations dashboard guide covers capacity and queues in the same plain style.
Parity can build this page from your exports. Upload CSV or Excel files from your WMS, shipping tool and timesheets, or connect a Google Sheet, connect QuickBooks Online for costs, and describe the warehouse KPIs you want. Parity builds a dashboard with the headline numbers and their trends, charts, what explains them and a table of what needs attention, and checks every number against queries on the full dataset before you see it. You can ask for cost per order by client, update it each week with a newer file, and share a read-only link with a client or partner.
Upload your WMS or order exports and get a checked warehouse dashboard, split by client. Build a report from your data free
Railside's September came down to two actions: add a scan check at packing, so more errors are caught at $1.10 instead of $31, and reprice the home goods account. Neither was visible in the headline 99.60%. That's the case for measuring every stage rather than just the last one.