In October, the owner of Sorrel Kitchen Supply, an example shop we'll use throughout this post, wrote two numbers on a sticky note for next year: 22,800 till receipts and 46 restaurant accounts. Everything else in her 2027 plan grew out of them. By the end of the afternoon she knew the plan would earn about $46,000, that the first quarter would lose money, and that the sales rep she wanted to hire would need 19 new accounts to pay for the hire.
That's what a budgeted income statement is for. It's next year's profit and loss statement written in advance: budgeted sales at the top, the costs those sales bring, the costs of staying open, and the profit the plan produces. It's built from a sales budget and a handful of rules, so when one assumption changes, the whole statement changes with it. This post builds Sorrel's step by step, then uses it to make two decisions.
Start with the sales budget, not last year's total
The quickest budget is last year plus 5%. It's also the least useful, because it gives you nothing to check during the year and nothing to change when a decision comes up. Build sales from the things that produce them instead. For most small businesses that's two numbers per revenue stream: how many, and how much each.
Sorrel sells to two kinds of customer, and they behave differently:
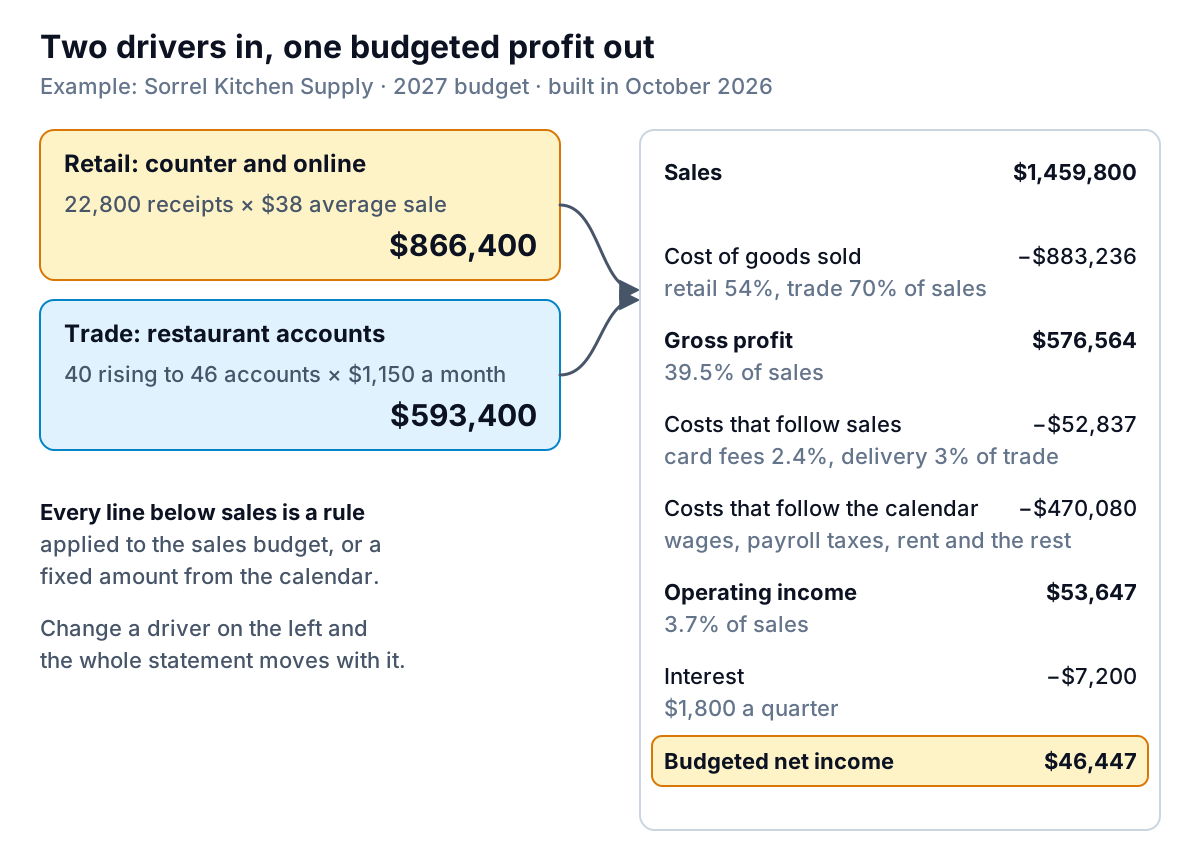
- Retail (the shop counter and the website): receipts × average sale. The owner took 2026's receipts by quarter from her point-of-sale reports, added a little for a new street-front sign, and kept the average sale at $38. That gives 4,800, 5,400, 5,000 and 7,600 receipts across the four quarters, with the holiday quarter the biggest.
- Trade (restaurants on monthly accounts): accounts × average monthly spend × 3 months. Forty accounts today, rising by two a quarter to 46, at $1,150 a month each.
| Sorrel Kitchen Supply sales budget, 2027 (example) | Q1 | Q2 | Q3 | Q4 | Year |
|---|---|---|---|---|---|
| Retail receipts | 4,800 | 5,400 | 5,000 | 7,600 | 22,800 |
| × average sale | $38 | $38 | $38 | $38 | $38 |
| Retail sales | $182,400 | $205,200 | $190,000 | $288,800 | $866,400 |
| Trade accounts | 40 | 42 | 44 | 46 | |
| × $1,150 a month × 3 | $3,450 | $3,450 | $3,450 | $3,450 | |
| Trade sales | $138,000 | $144,900 | $151,800 | $158,700 | $593,400 |
| Total sales | $320,400 | $350,100 | $341,800 | $447,500 | $1,459,800 |
Two rules keep a sales budget honest. Every driver should be something you can count during the year (receipts and accounts are both in Sorrel's systems), and the seasonal shape should come from your own history, not an even split. Our small business budget template shows how to spread a year by last year's shape if you don't have drivers yet.
Turn sales into cost of goods sold, one margin per stream
Don't apply one blended margin to the whole sales budget. Retail and trade customers buy different things at different prices, so Sorrel budgets cost of goods sold separately: 54% of retail sales (a 46% gross margin) and 70% of trade sales (30%), both taken from 2026's actual results by stream.
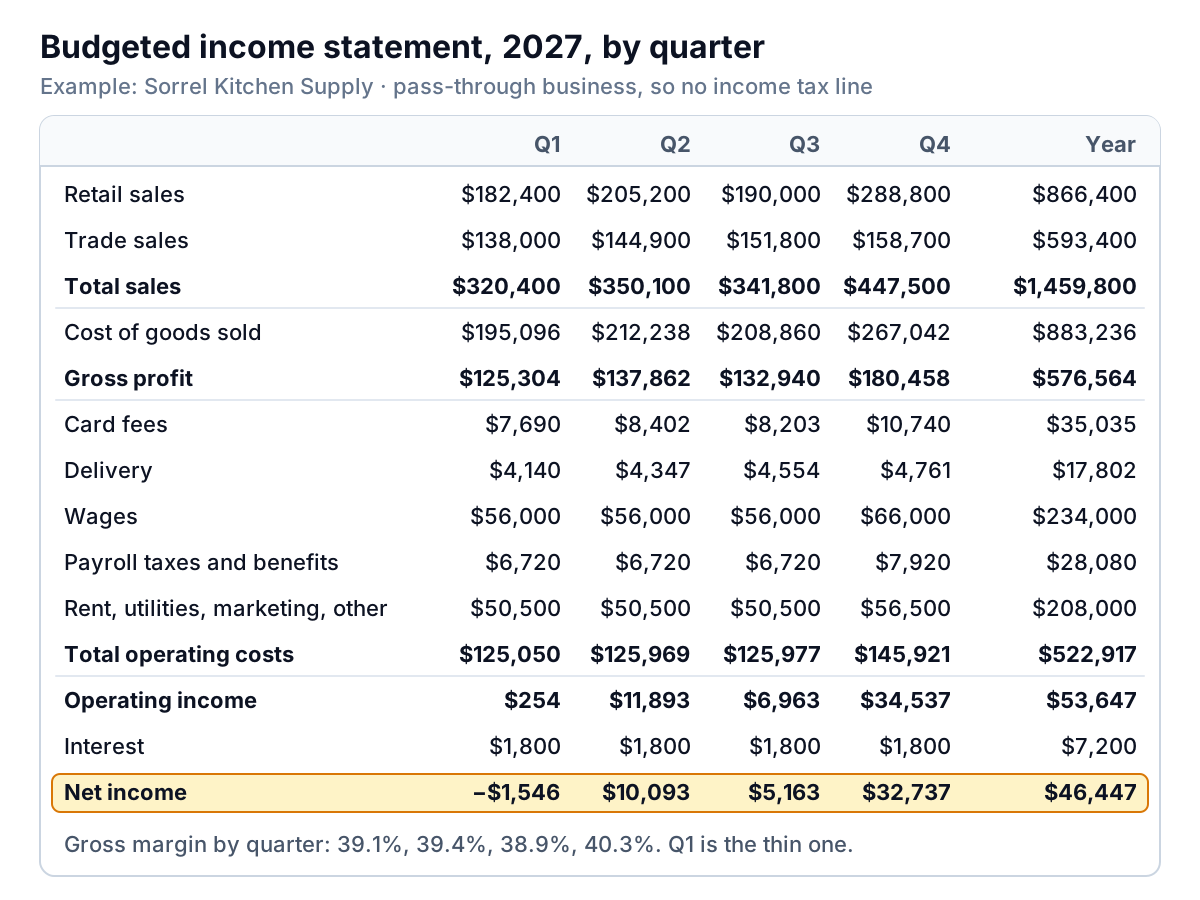
Splitting the margin is what makes the budgeted income statement react correctly. If trade grows faster than retail, the blended gross margin falls, even though neither stream's margin has changed. Sorrel's quarterly gross margin runs from 38.9% in Q3 to 40.3% in Q4 purely because the mix shifts toward retail at the holidays. A single blended rate would hide that, and the budget would overstate profit in any quarter where trade is the bigger share.
If you buy in bulk ahead of a season, remember that a budgeted income statement on the accrual basis counts the cost of goods when they're sold, not when you pay for them. The cash goes out earlier. That timing belongs in a cash flow forecast, which is a separate plan built from this one.
Split the rest: costs that follow sales and costs that follow the calendar
Every operating cost goes into one of two groups, and the group decides how you budget it.
Costs that follow sales: a rate
Card and payment fees are about 2.4% of Sorrel's sales, and delivery to restaurants is about 3% of trade sales. Budget them as percentages of the sales lines they belong to, so they move when sales move. Together they come to $52,837 for 2027. If you're not sure what a rate should be, divide last year's cost by last year's sales on that stream; our guide to contribution margin explains why separating these costs is worth the effort.
Costs that follow the calendar: an amount per month
Wages, rent, insurance, software, depreciation and most marketing don't change with one more sale. Budget each one as an amount, month by month, using what you already know:
- Wages: $56,000 a quarter, plus $10,000 in Q4 for holiday staff. Budget the cost, not the hourly rate: Sorrel adds 12% for payroll taxes and benefits, an assumption her bookkeeper checked against 2026. Before you set pay rises, the Bureau of Labor Statistics' Employment Cost Index, which measures the change in employers' hourly labour cost, is a sensible reference point.
- Rent: $27,000 a quarter, from the lease. If a rent review falls mid-year, put the increase in the right month.
- Marketing: $6,000 a quarter, doubled in Q4 for holiday campaigns.
- Everything else: utilities, insurance and software, depreciation on the shop fit-out, and other costs, each from last year's actual with any known change.
The calendar costs total $470,080 for the year. Interest on the shop's equipment loan adds $1,800 a quarter. Sorrel is a pass-through business for tax, so like most small businesses its budget ends at net income with no income tax line; the owner budgets her own tax separately with her accountant.
Sorrel's budgeted income statement, quarter by quarter
Read it the way you'd read an actual income statement (our income statement examples walk through three), with three questions:
- Is the bottom line enough? $46,447 is a 3.2% net margin on $1.46 million of sales. The owner draws a salary that's already in wages, so this is what's left for the business: to repay debt, replace fixtures and build a cushion. If it's not enough, the budget is the cheapest place to find out.
- Which quarter is the problem? Q1 loses $1,546. Sales are lowest, and calendar costs don't shrink. That's not a reason to panic, but it is a reason to plan Q1 stock purchases carefully and keep the line of credit open.
- Which line is carrying the year? Q4 earns $32,737, more than two-thirds of the year's profit. A weak holiday season would take most of the year with it. That's the scenario to test next.
Test the budget before you sign it off
A budgeted income statement built from drivers can answer "what if" in seconds. Change one assumption, hold everything else, and read the new bottom line. AccountingTools makes the same point in its definition of a budgeted income statement: the result is only as accurate as the inputs, so the inputs are what you test.
Decision 1: what to protect
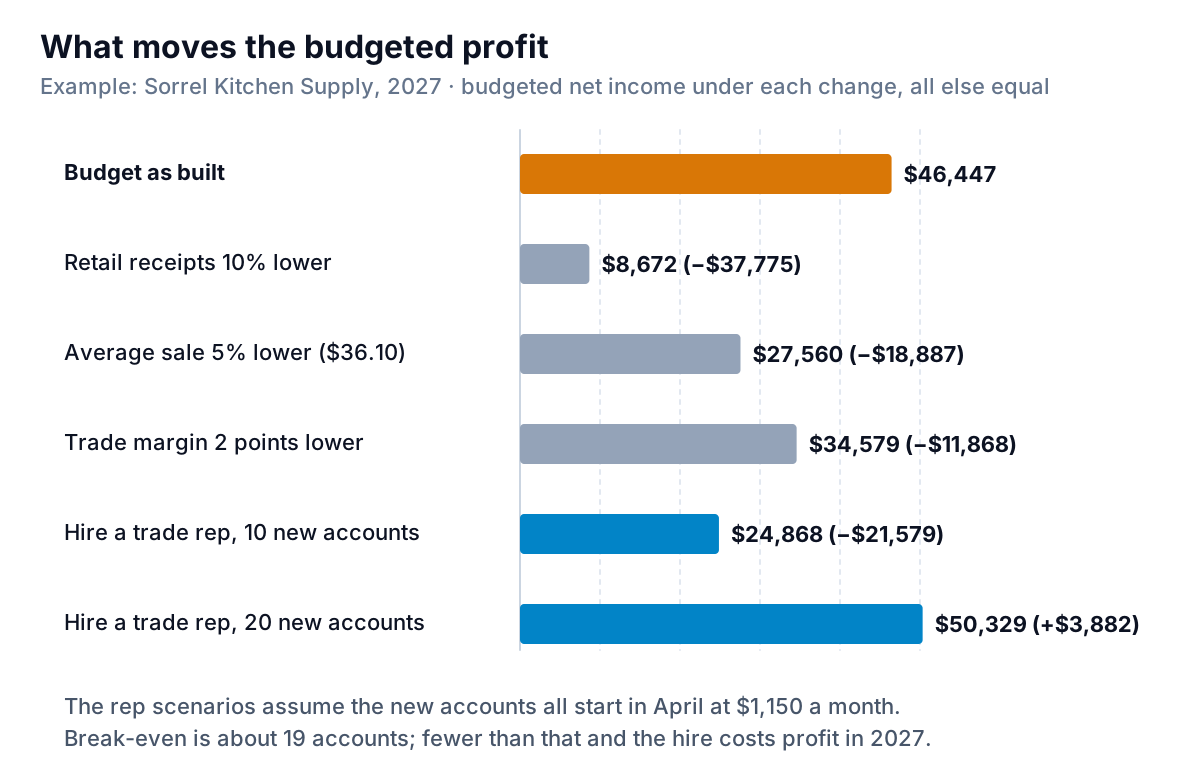
Every dollar of retail sales that doesn't happen costs Sorrel 43.6 cents of profit (the dollar minus the 54% product cost and the 2.4% card fee). Ten percent fewer receipts removes $37,775 of profit. A 5% lower average sale costs $18,887. A trade margin two points thinner costs $11,868. So the owner's 2027 priority isn't squeezing restaurant suppliers; it's footfall. She set a monthly receipts target to check against, and kept the holiday marketing budget where it was, because Q4 carries the year.
Decision 2: whether to hire the trade rep
A rep at $14,000 a quarter costs $15,680 with payroll taxes, or $47,040 for April to December. Each new restaurant account brings $3,450 of sales a quarter and keeps 24.6% of it after product cost, delivery and card fees: $849 a quarter, or about $2,546 over three quarters. Divide one by the other and the hire pays for itself in 2027 at about 19 new accounts.
Ten new accounts would cost $21,579 of this year's profit. Twenty would add $3,882. Both assume every new account starts in April, which flatters the result; in practice accounts arrive one at a time. The owner's rule: hire only if she can name 12 likely accounts before the rep starts, and treat 2027 as an investment year that pays back in 2028, when the accounts are worth a full year each.
From budget to monthly check
A budgeted income statement earns its keep in the months after you write it. Three steps make that happen:
- Use the same lines as your books. Budget against your accounting system's own accounts, or a grouping you can map them to every month. AccountingTools notes that budgeted line items should ideally match the actual income statement, because they're loaded into the accounting software for budget-versus-actual reports.
- Load it into your accounting system or keep it beside your exports. QuickBooks Online has a budgets feature: Intuit's guide to creating and managing budgets describes setting one up from the Reports area under financial planning, and the Budgets vs. Actuals report that compares it with what happened. Availability depends on your subscription, so check your plan.
- Compare monthly and investigate only what matters. Our guide to budget vs actual sets out which variances to chase and which to leave.
Check the drivers, not just the totals. If Q1 sales come in 6% short, the budget tells you whether receipts or the average sale is to blame, and that tells you whether to spend on marketing or rethink pricing.
Mistakes that make a budgeted income statement useless
- A plug at the bottom. Deciding the profit first and backing into sales to match. The budget then says what you hoped, not what the drivers support.
- One margin for everything. Fine for a business with one product line; wrong for anyone whose mix changes during the year.
- Fixed costs spread evenly when they aren't. Annual insurance, a December bonus or a mid-year rent review in the wrong month makes every monthly comparison look off.
- Treating it as a cash plan. The budget shows profit. Stock bought in advance, loan principal and owner draws don't appear on it, so a profitable quarter can still be short of cash.
- Never revisiting the assumptions. Keep the approved budget fixed, but write a short reforecast at mid-year if a driver has moved for good.
Once the year is running, Parity can do the monthly comparison for you. Connect QuickBooks Online, or upload your actuals and your budget as a spreadsheet, and it builds a dashboard of the headline numbers with their trends, charts, what explains the gaps, and a table of the lines that need attention. Ask for it and it writes the month-end report from the same data, with every figure checked against queries on the full dataset first.
Upload your budget and your books, or connect QuickBooks Online, and get the variances that matter explained. Build a report from your data free