Meridian Dog Grooming took in $395,000 in 2025 and kept $41,400 of it. Meridian is an example salon we made up, but its income statement looks like a real one: the revenue lines, the commissions, the card fees and the small interest charge at the bottom. This post reads that income statement example line by line, then two shorter ones: a soap maker laid out single-step, and a bike shop laid out multi-step, with income tax.
Each example answers a different question. The salon shows where labour sits and what the bottom line means when the owner takes no salary. The soap maker shows what a single-step layout hides. The bike shop shows why a multi-step statement has four subtotals instead of one. If you want a refresher on what each line of an income statement means first, our guide to the profit and loss statement covers it. Here we stay with examples.
Example 1: a service business income statement
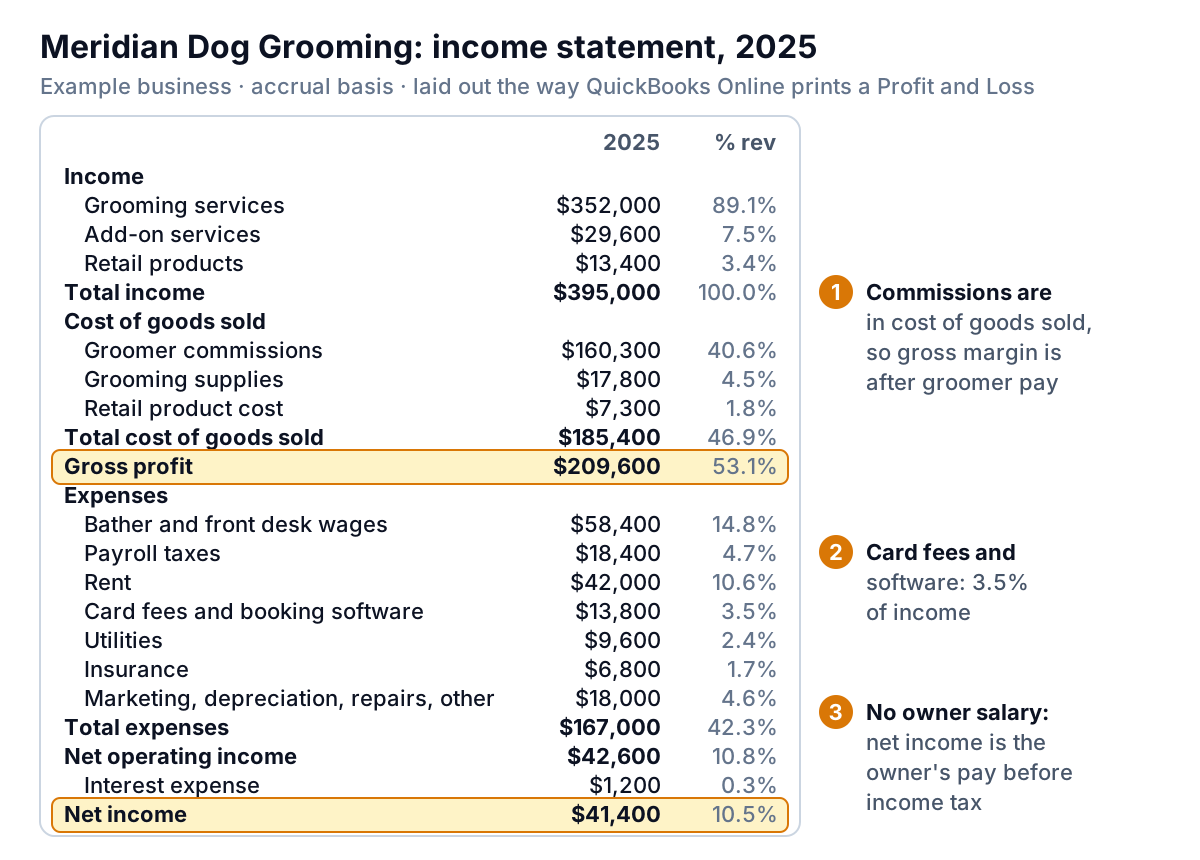
Meridian has four groomers paid on commission, two bathers and a front desk on hourly wages, and a small shelf of shampoos and treats. Its owner runs the salon full-time and is the only member of an LLC. The statement below is on the accrual basis and follows the layout QuickBooks Online uses for its Profit and Loss report: Income, Cost of goods sold, Gross profit, Expenses, Net operating income, then other items.
Read the income lines for mix, not just size
Grooming is 89.1% of income. Add-ons (nail grinding, teeth brushing, de-shedding) are 7.5%, and they matter more than their size suggests, because they use the same table time and the same groomer as the main appointment. Retail is 3.4% and earns a 45.5% margin: $13,400 of sales against $7,300 of product cost. It's a convenience, not a business line, and that's fine as long as the stock doesn't sit on the shelf.
Commissions in cost of goods sold change every ratio below them
Meridian's bookkeeper puts groomer commissions in cost of goods sold, because they rise and fall with every appointment. That makes gross profit $209,600, or 53.1%. Move the same $160,300 down into expenses and gross margin would read 93.6%, with the bottom line unchanged. Neither is wrong. But it means you can't compare your gross margin with another salon's, or with a published figure, until you know where both put their groomers' pay. Our guide on how to calculate gross margin goes into that choice.
Commissions come to 42% of service income ($160,300 of $381,600). That's the line to watch when you change the commission plan or prices.
The expense lines that are really percentages
Rent is $42,000, or 10.6% of income, and it stays $42,000 whether the salon books 20 dogs a day or 30. Card fees and booking software are different: $13,800 is 3.5% of income, and most of it moves with every payment. When income grows, rent's share shrinks; card fees' share doesn't. Reading the % column with that in mind tells you which lines will improve on their own as you grow and which won't.
Payroll taxes ($18,400) are the employer's share on both the commissioned groomers and the hourly staff. If your groomers are contractors rather than employees, this line is smaller and the classification question belongs with your accountant; the IRS sets out the factors in its guide to independent contractor or employee.
Net income here is the owner's pay
Meridian's owner takes no salary. As a single-member LLC taxed as a sole proprietorship, she reports the business's profit on Schedule C, so the $41,400 is what she earned for a year of running the salon, before her own income and self-employment tax. Compare it with what it would cost to hire a manager, and the 10.5% net margin looks thinner than it first did. A salon that employs its manager would show that salary in expenses and a smaller net income.
Example 2: a product business, single-step
Ostara Soap Works, a second example, makes soap in a rented studio and sells it online and wholesale to gift shops. Its books list every cost in one block under the revenue, which is called a single-step income statement: revenue minus all expenses equals net income, with no gross profit line in between.
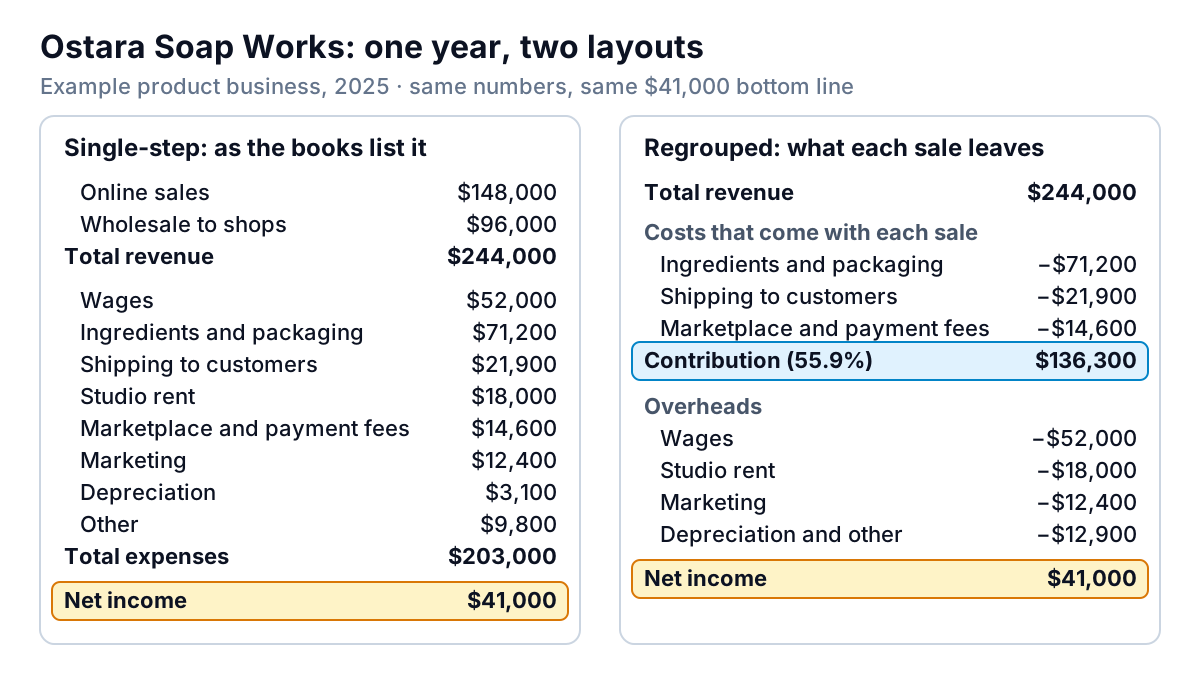
Read the single-step version and you learn two things: the business made $41,000, a 16.8% net margin, and wages are its biggest single cost after ingredients. What you can't see is how much each bar of soap contributes. Regroup the costs that come with every order (ingredients and packaging, shipping, marketplace and card fees) and $136,300 is left, 55.9% of revenue, to pay the wages, the studio and everything else.
That number is what you need for pricing and for deciding between channels. Wholesale orders usually carry lower prices but no per-order shipping or marketplace fees, so the two channels can leave very different amounts per dollar of sales. Splitting the costs that come with a sale by channel is the next step, and our guide to contribution margin shows how.
Example 3: a multi-step income statement with tax
Bosun Bicycle Co., the third example, sells bikes and runs a service workshop. It's a C corporation, so it pays income tax itself, and its accountant presents a multi-step income statement: one that stops at several subtotals on the way to net income.
| Bosun Bicycle Co. (example), year to 31 Dec 2025 | Amount |
|---|---|
| Bike sales | $438,000 |
| Service and repairs | $174,000 |
| Net sales | $612,000 |
| Cost of bikes and parts sold | ($351,000) |
| Gross profit | $261,000 |
| Selling expenses (sales staff, marketing) | ($110,000) |
| General and administrative expenses (rent, workshop and office wages including the owner's salary, depreciation, other) | ($119,000) |
| Operating income | $32,000 |
| Gain on sale of old delivery van | $2,400 |
| Interest expense | ($3,400) |
| Income before income tax | $31,000 |
| Income tax (federal at 21%) | ($6,510) |
| Net income | $24,490 |
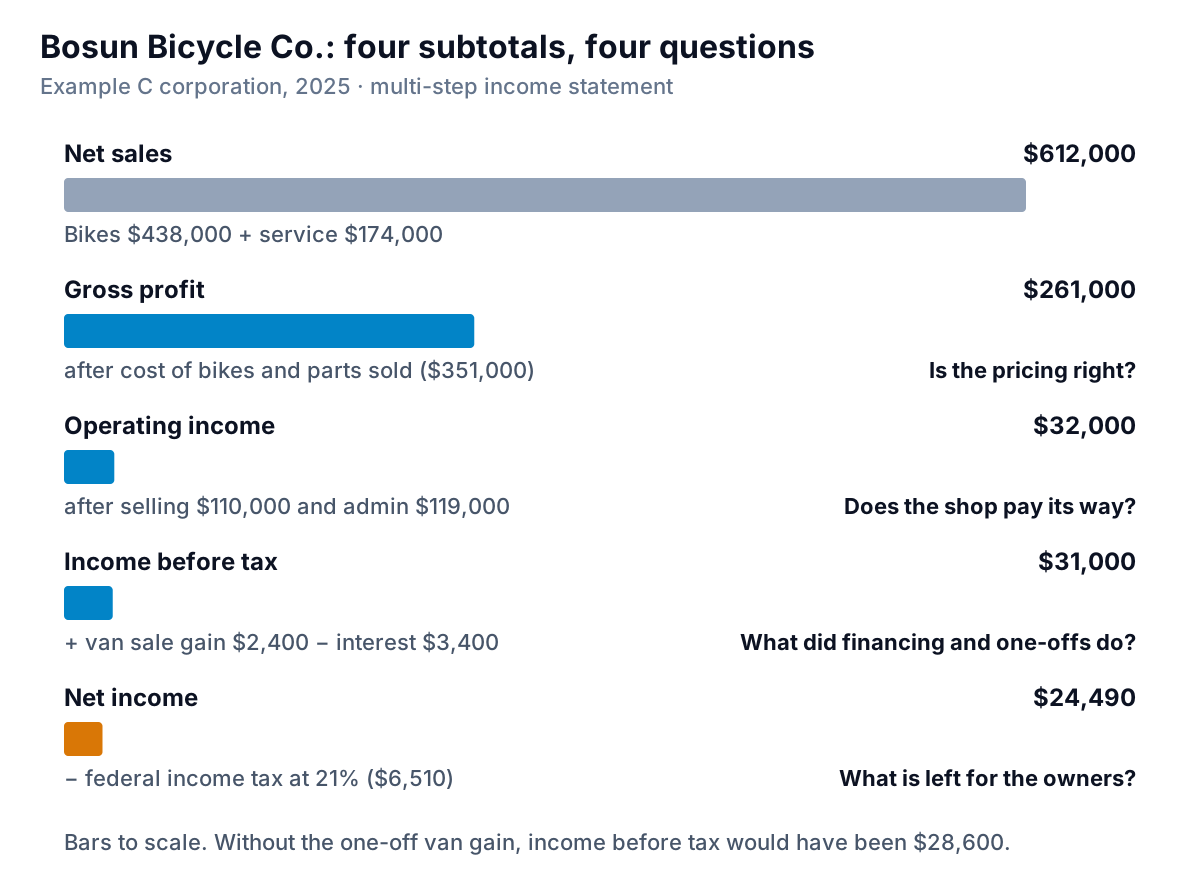
Read the subtotals in order:
- Gross profit, $261,000 (42.6%). Is the pricing right? Bikes and service are blended here, and the mechanics' wages sit below this line in general and administrative costs, so service looks more profitable at this level than it is. Split the two in your own books.
- Operating income, $32,000 (5.2%). Does the shop pay its way from trading? Selling and admin costs are shown separately, which makes it easier to ask whether the sales floor or the back office is growing faster.
- Income before tax, $31,000. What did financing and one-offs do? The van sale gain of $2,400 is real income, but it won't happen next year. Without it, income before tax would have been $28,600.
- Net income, $24,490. What's left for the owners after tax. The federal corporate rate is 21%, as the IRS sets out in Publication 542. State income tax, where it applies, would add to the tax line; the example leaves it out to keep the arithmetic visible.
Most small businesses never see an income tax line on their own statement, because LLCs, sole proprietorships, partnerships and S corporations usually pass profit through to the owners' personal returns. If yours does show one, check with your accountant whether it's this year's estimate or last year's payments.
The three examples side by side
| Meridian (service) | Ostara (product) | Bosun (retail and service) | |
|---|---|---|---|
| Layout | QuickBooks-style, one gross profit line | Single-step | Multi-step, four subtotals |
| Revenue | $395,000 | $244,000 | $612,000 |
| Where direct labour sits | Commissions in cost of goods sold | Wages in the expense list | Mechanics' wages in general and administrative |
| Gross margin as shown | 53.1% | Not shown (55.9% contribution if regrouped) | 42.6% |
| Net margin | 10.5% | 16.8% | 4.0% |
| Owner's pay | Is the net income | Is the net income | Salary inside expenses; net income is after tax |
| Income tax on the statement | No (pass-through) | No (pass-through) | Yes (C corporation) |
The net margins look like a ranking, and they aren't. Ostara's 16.8% includes no pay for its owner. Bosun's 4.0% is after a salary for its owner and after tax. To compare them you'd have to put the owner's pay on the same footing first. The same goes for any income statement example you find online, including the ones in this post: check the layout, the accounting basis and where the owner's pay sits before you hold your numbers up against them.
Laying out your own like these
You don't need a new system to make your statement read like the examples. Run your profit and loss report for a full year (in QuickBooks Online it's Reports, then Profit and Loss, as Intuit's guide to running reports shows), export it to Excel, then make three changes:
- Group the accounts into the lines you'll actually read. Twelve to fifteen expense lines is plenty. Keep the grouping the same every year.
- Decide where direct labour goes and write the rule down: in cost of goods sold if it rises and falls with each job, in expenses if it's paid regardless.
- Add a % of revenue column and last year's figures beside this year's. A line that moves more than a point or two as a share of revenue is worth a question.
Our free profit and loss statement template already has the grouping, the % column and twelve monthly columns. If the statement has a different name in your software, or your lender asks for a "statement of operations", our explainer on income statement vs profit and loss sorts out the names.
What these examples can't tell you
- Whether the cash is there. Meridian's $41,400 doesn't say how much is in the bank. Loan principal, equipment purchases and owner draws don't appear on an income statement at all.
- Why a line moved. An income statement shows that card fees rose; only the transactions behind it show whether volume rose or the processor raised its rate.
- Whether a number is good for your trade. Benchmarks exist, but only use ones that state their layout and source, and adjust for owner pay first.
The last two are where a dashboard earns its place. Parity connects to QuickBooks Online, or takes the Excel export of your profit and loss from any other system, and builds a dashboard: headline numbers with their trends, charts, what explains the movements, and a table of what needs attention. Ask it, and it writes a report from the same data for a partner or lender. Every figure is checked against queries on the full dataset before you see it.
Upload your profit and loss export or connect QuickBooks Online, and get the lines that changed explained. Build a report from your data free