Corbel Interiors, a residential design studio we invented for this guide, grew revenue by $150,000 in 2025, from $600,000 to $750,000. Operating profit fell from $72,000 to $38,100. Every dollar line on the profit and loss statement went up, so the owner couldn't see which one had done the damage. A common size income statement found it in about ten minutes. It's the same income statement with every line shown as a percentage of revenue, so a year of $600,000 and a year of $750,000 can be read on the same scale.
This guide builds one step by step from Corbel's books, then shows the two places where the percentages mislead (changes in mix and differences in how revenue is recorded), how to compare yourself with other businesses, and the shorter version of the same idea for the balance sheet. If you need the basics of the statement itself first, start with our guide to the profit and loss statement.
Build a common size income statement in four steps
Analysts call this vertical analysis, because you read down a single column and compare each line with the total at the top. You need one income statement per period and a spreadsheet.
- Pick the base: net revenue. Use revenue after returns, refunds and discounts, not gross sales. If your P&L shows "Sales" and "Less: discounts" as separate lines, the base is the line underneath them. Every other line is divided by this one number, so it has to be right.
- Divide every line by the base. With amounts in column B and net revenue in B4, put
=B5/B$4in C5 and fill down. The dollar sign before the 4 keeps the base fixed as you copy. Format column C as a percentage with one decimal. - Repeat for the other period in the next pair of columns. Each year is divided by its own revenue, never by the other year's.
- Add a change column in percentage points. If 2024 percentages are in C and 2025 percentages in E, then
=(E5-C5)*100gives the change in points. A cost that went from 28.0% to 35.5% of revenue rose 7.5 points. Keep this column separate from a percent change in dollars, which answers a different question.
Two quick checks before you read anything: revenue shows 100.0% in both years, and the expense lines plus operating profit add back to 100.0%. If they don't, a line was left out or a formula slipped.
What Corbel's percentages showed
Here is Corbel's statement for both years, in dollars and as a share of revenue.
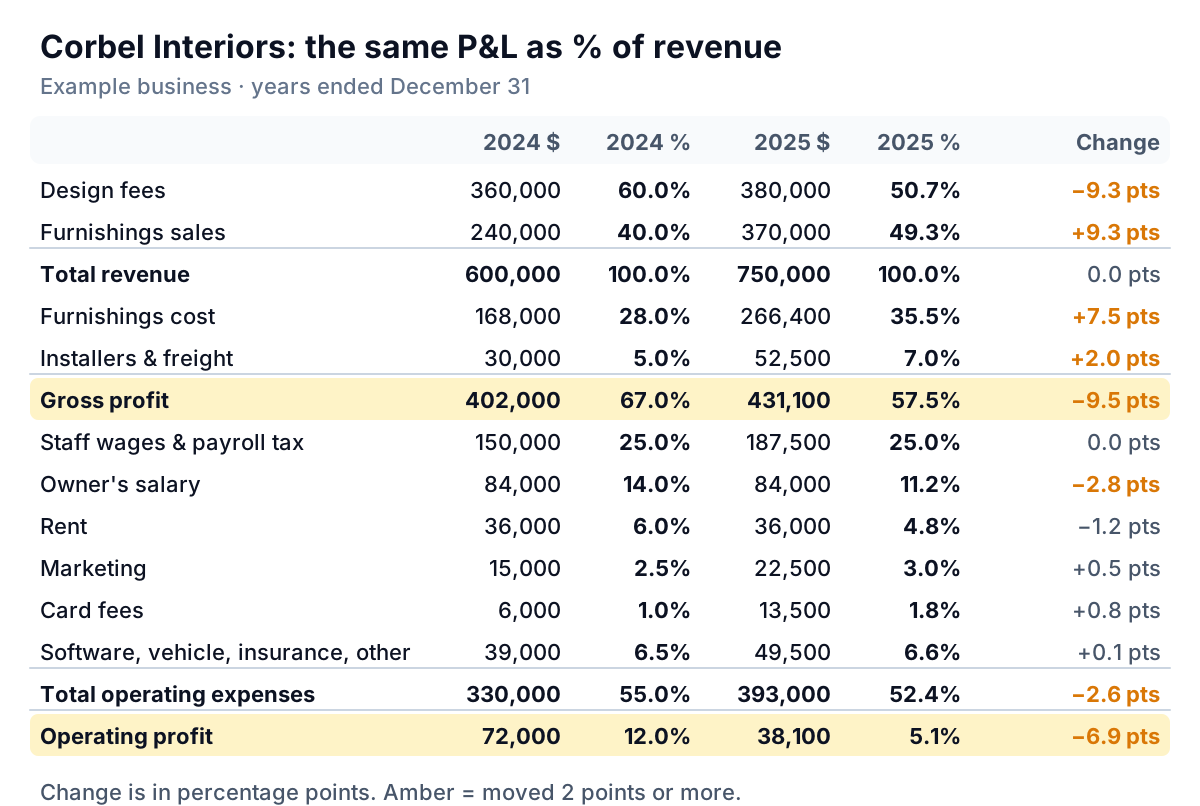
Read the change column from the top and three things stand out.
- Gross profit fell 9.5 points, from 67.0% of revenue to 57.5%. On $750,000 of revenue, each point is $7,500, so this is roughly $71,000 of gross profit Corbel would have kept at 2024's margin. That's the whole story of the year.
- Operating expenses fell 2.6 points as a share of revenue, even though they rose $63,000 in dollars. Rent and the owner's salary stayed flat while revenue grew, so they take a smaller slice. This is what fixed costs do in a growing year, and it's good news that partly hides the bad news above.
- Operating profit fell 6.9 points, from 12.0% to 5.1%: the 9.5-point gross margin loss, softened by the 2.6-point gain on overheads.
Lines that held steady matter too. Staff wages stayed at exactly 25.0% of revenue, which tells the owner that hiring kept pace with the work and didn't run ahead of it. Card fees rose from 1.0% to 1.8%, small in points but a near doubling of the share, because clients increasingly paid for furniture by card.
A common size income statement doesn't tell you whether a change is good or bad. It tells you where to look. Corbel's next question is why gross margin fell, and the answer isn't in this table.
When the percentages lie: a shift in mix
Corbel earns money two ways. Design fees have no cost of sales at all. Furnishings, the furniture and lighting it buys at trade prices and resells to clients, carry a large one: the furniture itself, plus installers and freight. Split by stream, the two years look like this.
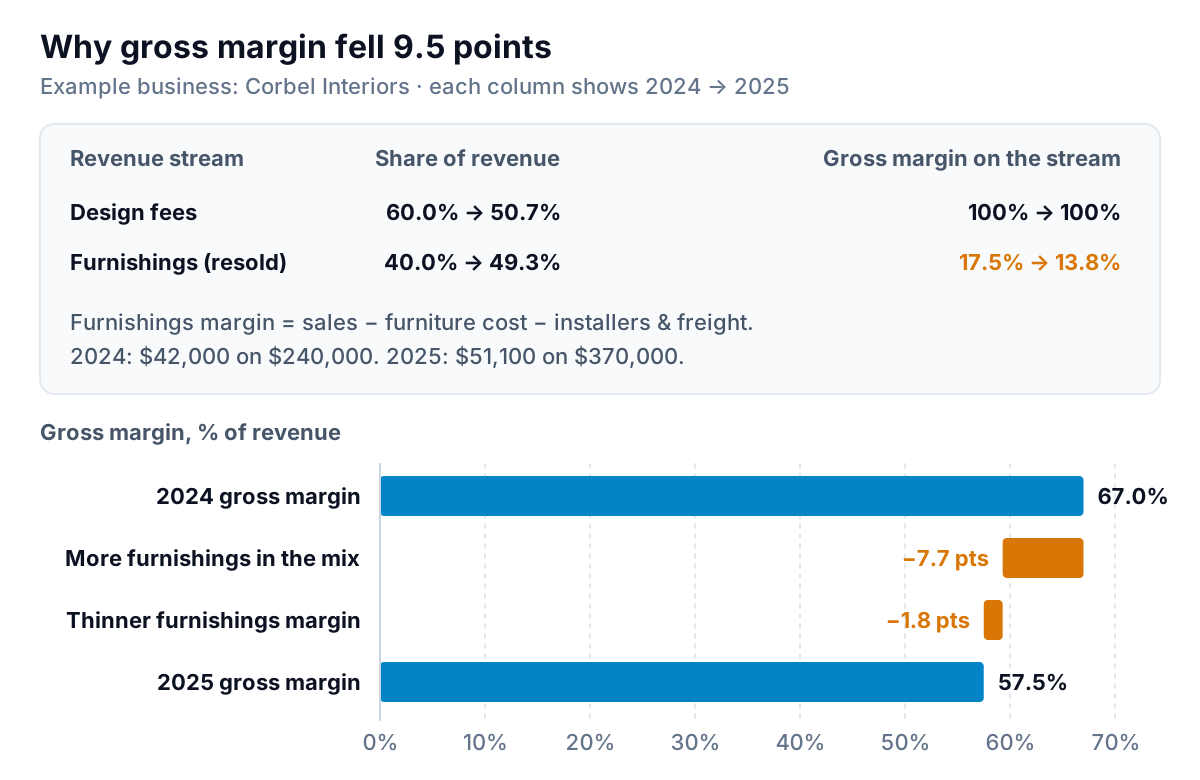
Furnishings sales grew 54%, from $240,000 to $370,000, while design fees grew about 6%. Because furnishings earn a thin margin, a bigger share of them drags the blended gross margin down even if nothing else changes. You can measure that by recalculating 2025 at 2024's stream margins:
- Design fees: 50.7% of revenue × 100% margin = 50.7 points.
- Furnishings: 49.3% of revenue × 17.5% margin = 8.6 points.
- Total: 59.3%. That's what 2025's gross margin would have been with no change in pricing or costs, just the new mix. The mix alone cost 7.7 points (67.0 − 59.3).
- The remaining 1.8 points (59.3 − 57.5) came from the furnishings margin itself slipping from 17.5% to 13.8%: a few vendors raised trade prices, and freight and installation grew from 12.5% to 14.2% of furnishings sales.
The two causes need different fixes. A mix problem is a pricing and strategy question: is reselling furniture at a 14% margin worth the staff time it takes? A margin problem is a purchasing question: renegotiate with vendors, or bill freight to the client. A common size statement on one blended revenue line can't tell them apart, so if you earn money in more than one way, run the common size income statement by stream too. In QuickBooks that usually means tracking streams with classes or separate income accounts; in a spreadsheet, a column for the stream on each line of the export.
The same business, recorded differently
Mix has a cousin that causes even bigger swings when you compare businesses. Some design firms record furniture they resell at the full price the client pays, with the furniture's cost in cost of sales. Others record only their markup or commission as revenue. Which is correct depends on whether the firm controls the goods before the client gets them, a judgment the revenue standard leaves to the facts of each arrangement; Deloitte's guide to principal-versus-agent considerations walks through it. Your accountant should make that call, not this article. The point for vertical analysis: if Corbel recorded furnishings net, its 2025 revenue would be $431,100 (fees of $380,000 plus $51,100 of furnishings margin), and rent would jump from 4.8% of revenue to 8.4%. Same business, same profit, very different percentages. Before you compare yourself with anyone, find out how they book pass-through sales.
Comparing with other businesses
The other common use of a common size income statement is peer comparison. A firm half Corbel's size can't be compared in dollars, but 25% of revenue on wages means the same thing at any size.
The best-known source of small and mid-sized peer data in the US is ProSight's (formerly RMA's) Annual Statement Studies. Its introduction explains that balance sheet and income statement figures are shown in common size format, built from financial statements that banks collect from their borrowers, grouped by NAICS industry code and by company size. Three details from that introduction matter when you use it:
- ProSight computes a common size statement for each company and then averages the percentages, so the composite is a typical business, not the industry's combined totals.
- An industry is published only if at least 30 valid statements were submitted, and a size column with fewer than 10 statements isn't shown. Pick the size band closest to yours, not the "all sizes" column.
- The data comes from borrowers, so it describes businesses that banks lend to. It's a reasonable yardstick, not a target.
It's a paid product, and many public and university business libraries subscribe to it, so ask yours before you buy.
Before you line your percentages up against anyone's, adjust for the differences that have nothing to do with performance:
- Owner's pay. Corbel pays its owner an $84,000 salary through payroll, 11.2% of revenue. A sole proprietor's P&L has no owner's salary line at all, because the owner takes draws instead, and draws aren't an expense. That one difference can move operating profit by ten points or more. Our operating margin guide covers adjusting for it.
- Owning vs renting. A firm that owns its building shows depreciation and interest instead of rent.
- Where costs sit. One firm puts installers in cost of sales, another in operating expenses. Gross margin then differs while operating profit doesn't. Our guide to calculating gross margin covers what usually belongs in cost of sales.
- Basis of accounting. A cash-basis year and an accrual-basis year can differ sharply when receivables or deposits move.
Compare yourself with your own past years first. That comparison is free of all four problems, and it's usually where the useful answer is.
The common size balance sheet, briefly
The balance sheet works the same way with a different base: every line is divided by total assets. Liabilities and equity are divided by the same total, because they add up to it.
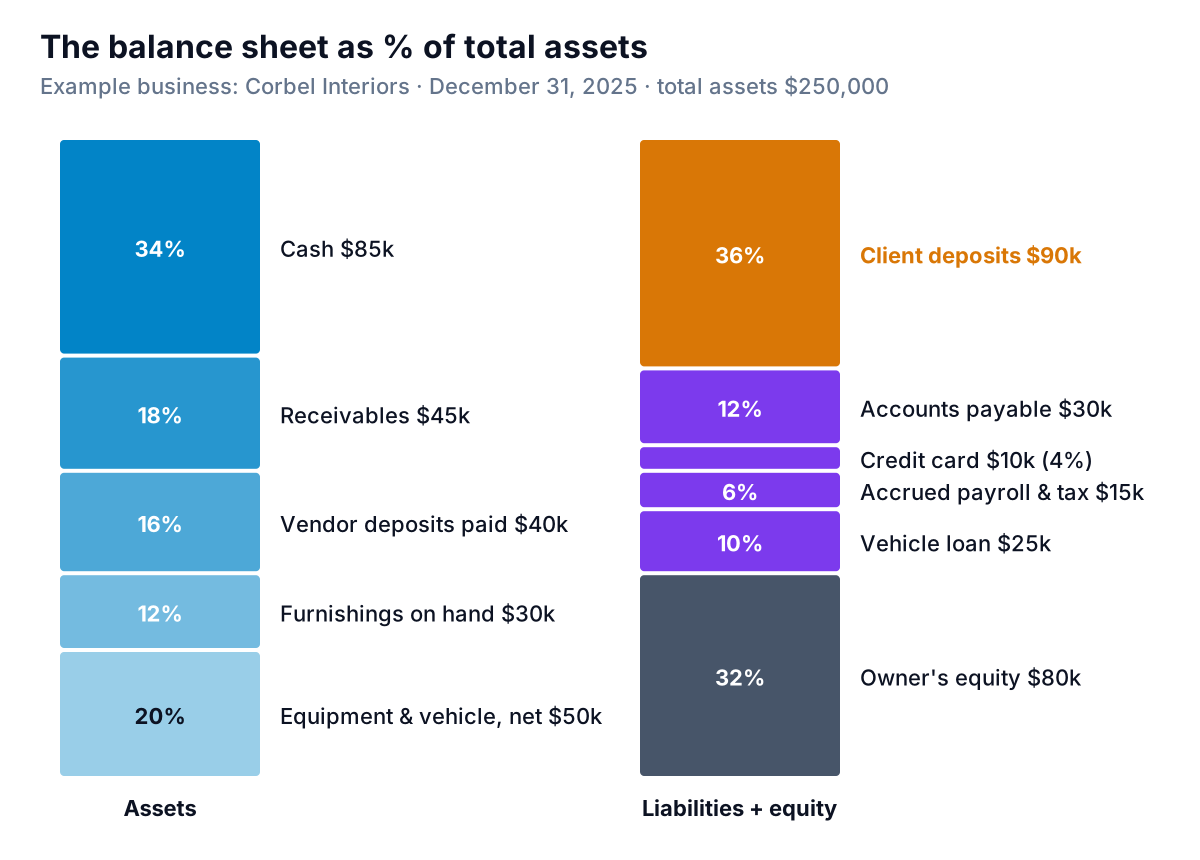
For Corbel, the picture answers a question the owner hadn't asked. Cash is 34% of total assets, which looks comfortable. But client deposits, money paid in advance for furniture not yet delivered, are 36%. Most of that cash is already spoken for, and 16% of assets is the studio's own deposits sitting with vendors for the same orders. Equity is 32%: the owner's stake funds about a third of the business, the rest is clients, suppliers, the card and the vehicle loan.
A common size balance sheet is most useful next to the same thing a year earlier, or next to a peer composite. To see what changed in dollars and why, put two dates side by side as described in our guide to the comparative balance sheet.
Getting the percentages out of your books
QuickBooks Online. Intuit's list of reports included in each subscription shows a Profit and Loss by % of Total Income report in Simple Start, Essentials and Plus, along with the Profit and Loss Comparison report for two periods side by side. Run the percentage report once per year, or export the comparison report to Excel and add the percentage columns yourself with the formulas above. Use the same accounting method (accrual or cash) for both years.
Xero or any other software. Export the profit and loss report for each period to Excel and add the columns. It takes five minutes, and you control exactly which line is the base.
A spreadsheet. Keep one tab per year with the same line items in the same order, then a summary tab that pulls each year's amounts and divides by that year's revenue. Lock the row order, because a line added in one year and not the other will shift every formula below it.
Whichever route you take, decide your line groupings once and keep them. If "software" was its own line last year and is folded into "office" this year, both lines will show a change that isn't real.
Mistakes, and what to do when a line moves
- Mixing up points and percent. Card fees went from 1.0% to 1.8% of revenue: up 0.8 points, or up 80% as a share. Say "points" when you mean the difference between two percentages.
- Using gross sales as the base when you give large discounts or refunds. Every percentage then looks smaller than it is.
- Reading one month. A single month's percentages swing with timing: a big furniture order lands in one month and its cost in the next. Use a quarter, a year or a trailing twelve months.
- Treating a falling percentage as a falling cost. Corbel's owner's salary fell 2.8 points without falling a dollar. Read the percentage and the dollars together.
When a line moves more than a point or two, work through it in order. First check the books: was something reclassified, or posted in the wrong year? Then check mix: did one stream grow faster than another? Then check price and cost per unit. For Corbel, the answer led to two decisions: a minimum 25% markup on furnishings with freight billed separately, and a quarterly look at design fees as a share of revenue so the studio notices when furniture resale starts crowding out the higher-margin work. If you sell anything with a large variable cost, the contribution margin income statement is the next view worth building, because it separates the costs that move with each sale from those that don't.
Keeping these percentages current is the hard part. Parity connects to QuickBooks Online directly, or takes an Excel or CSV export from Xero or any other tool, and builds a dashboard with your headline numbers and their trends, charts, what explains them and a table of what needs attention. Every number is checked against queries on the full dataset before you see it. Ask it to show each expense line as a percentage of revenue by month, or gross margin by revenue stream, and refine it by chat. You can save it as a template and update it with next month's file.
Connect QuickBooks or upload your P&L export and get a checked dashboard of where each revenue dollar goes. Build a report from your data free
One last check from Corbel's year: the studio grew 25% and kept half as much of each dollar. Growth that shows up only in the dollar columns is the kind a common size statement exists to catch.