The bank's renewal form for Aster Print Co.'s line of credit had one line the owner hadn't seen before: "Comparative balance sheets, two most recent fiscal year-ends." Aster, a commercial print shop we made up for this guide, had a good 2025. Sales rose 11.5% to $680,000 and it made $52,000 of profit. Yet when the owner put December 2024 and December 2025 side by side, cash had halved, from $64,000 to $31,000, and total liabilities were up $70,000. A comparative balance sheet is exactly that side-by-side view: the balance sheet at two or more dates in adjacent columns, usually with the dollar and percentage change between them. Read properly, it tells the story of the year that the profit figure leaves out.
This guide builds one from Aster's books, shows which changes deserve a question and which don't, and turns the columns into a plain account of where the money went. If you need a ready-made balance sheet layout with check cells, our balance sheet template has one, including the carry-forward check that ties the two dates together. Here we focus on reading the changes.
Building a comparative balance sheet
Pick the dates first
The dates decide what the comparison can tell you.
- Two year-ends are the standard for lenders, buyers and tax preparers, and they're what Aster's bank asked for. Public companies file the same thing: SEC rules require audited balance sheets as of the end of each of the two most recent fiscal years. Year-ends also follow closed, adjusted books, so they're the most reliable pair you have.
- This month-end vs the same month last year is the best choice in a seasonal business. A print shop's receivables at the end of November, after the holiday card rush, aren't comparable with September's.
- This month-end vs last month-end is good for catching problems early, but expect noise: one large invoice paid on the 1st instead of the 31st can swing receivables and cash by thousands.
Whatever you choose, use the same accounting method (accrual or cash) for both dates and run both after the books for each period are closed.
Add the change columns
With the earlier date in column B and the later one in column C:
- Dollar change in D:
=C5-B5. - Percent change in E:
=IF(B5=0,"n/m",(C5-B5)/ABS(B5)). TheABSkeeps the sign meaningful for lines that are normally negative, such as accumulated depreciation or a deficit in retained earnings. TheIFstops a divide-by-zero error for a line that didn't exist at the earlier date, such as a new loan. Write "n/m" (not meaningful) there; any percentage would be.
Analysts call this horizontal analysis, because you read across a row. Its partner, vertical analysis, divides every line by total assets and is covered in our guide to the common size income statement, which includes a short section on the balance sheet version. The two work well side by side: horizontal analysis shows what changed; vertical analysis shows whether the shape of the business changed.
Aster's two year-ends, side by side
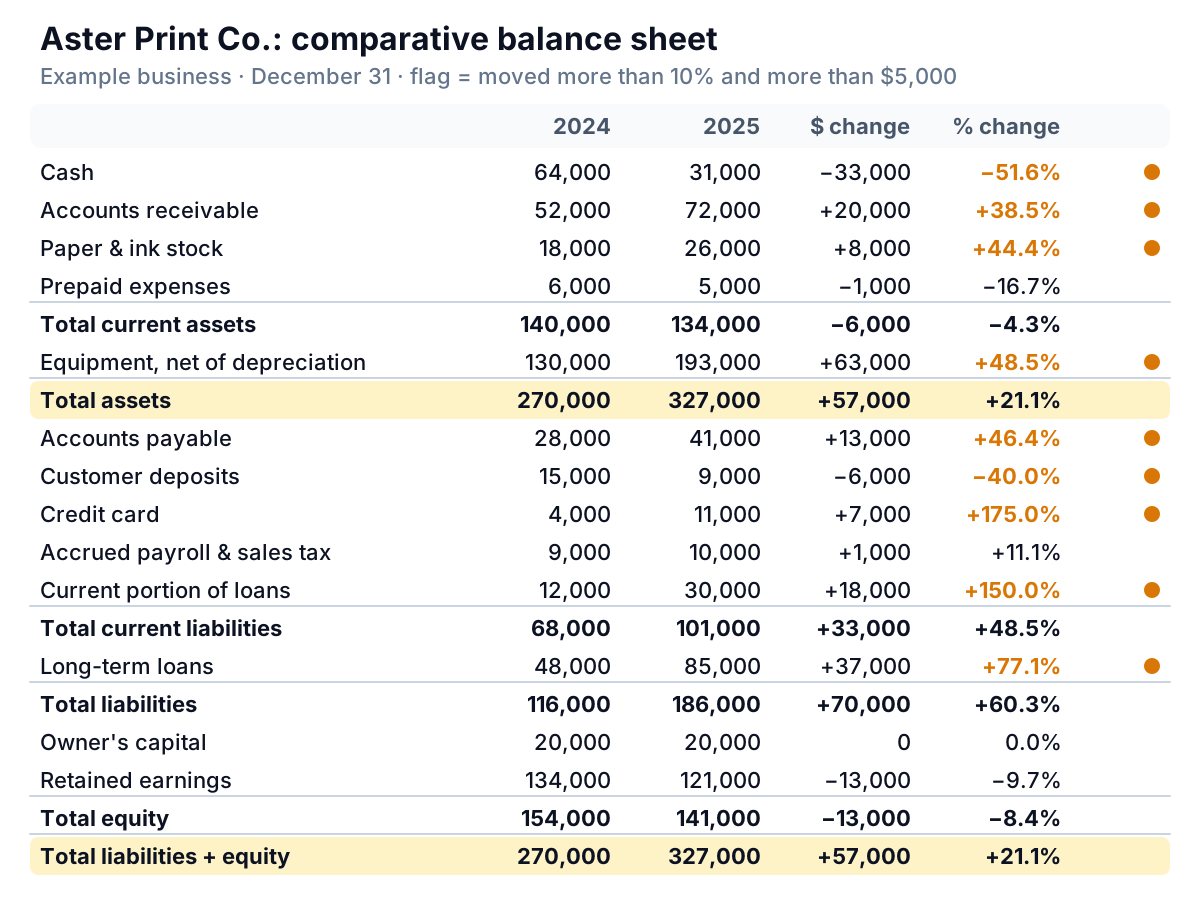
Nineteen lines is too many to read with equal care, so use a rule to pick the ones that need a reason. Aster's is: flag any line that moved more than 10% and more than $5,000. Both conditions matter. The 10% catches changes that are large for that line; the $5,000 stops tiny balances from crowding the list. Set the dollar threshold at about 1% to 2% of total assets; for a business with $3 million of assets, $5,000 is noise.
The rule flagged nine lines. It also missed one worth reading: retained earnings fell $13,000, or 9.7%, just under the threshold. Equity should normally grow in a profitable year, so a fall is worth a look whatever its size. No rule replaces reading the totals and the equity section yourself.
Percent change is a pointer, not a verdict
Sort the flagged lines by percent change and Aster's credit card is the most alarming thing on the page: up 175%. Sort them by dollars and it's eighth of nine.
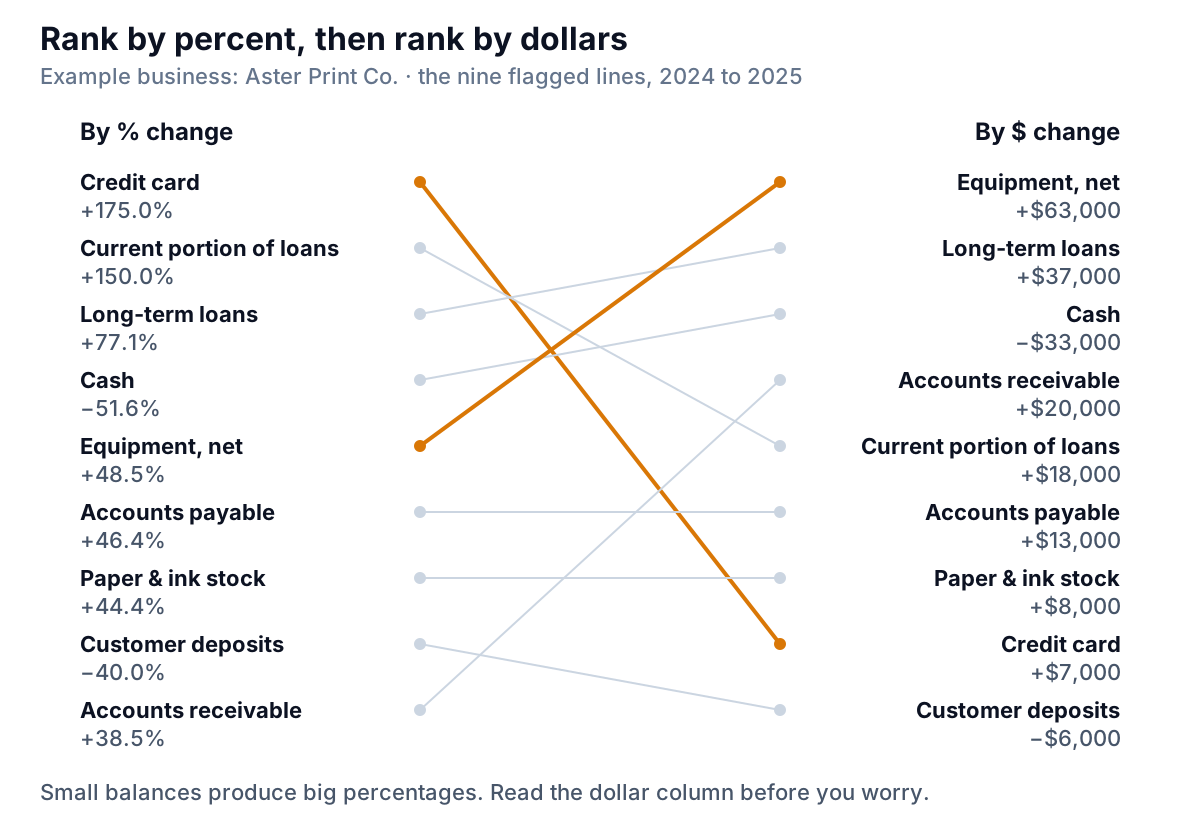
A percentage measures change relative to where a line started, so small starting balances produce big percentages. The card went from $4,000 to $11,000. That's worth one question (why is the shop carrying more on the card?), but the $63,000 jump in equipment and the $55,000 of new debt behind it are what changed the business. Rank by dollars to decide what matters; use percentages to see which lines changed character.
Three more traps:
- Sign changes. A line that goes from −$2,000 to +$3,000 has no sensible percentage. Use n/m and explain it in words.
- Reclassifications. If your bookkeeper moved a vehicle from "Equipment" to its own "Vehicles" account, both lines show large changes that aren't real. Ask before you analyse.
- The current portion of debt. Aster's jumped 150%, from $12,000 to $30,000. That isn't new borrowing on its own; it's the part of all its loans due within twelve months. The new press loan added $18,000 of principal due in 2026. That number will matter more to the bank than the card.
Reading the changes as a story
Every change on a balance sheet either brought money into the business or used it. Increases in assets use money; increases in liabilities and equity provide it, and decreases do the reverse. Sorted that way, Aster's year fits on one page.
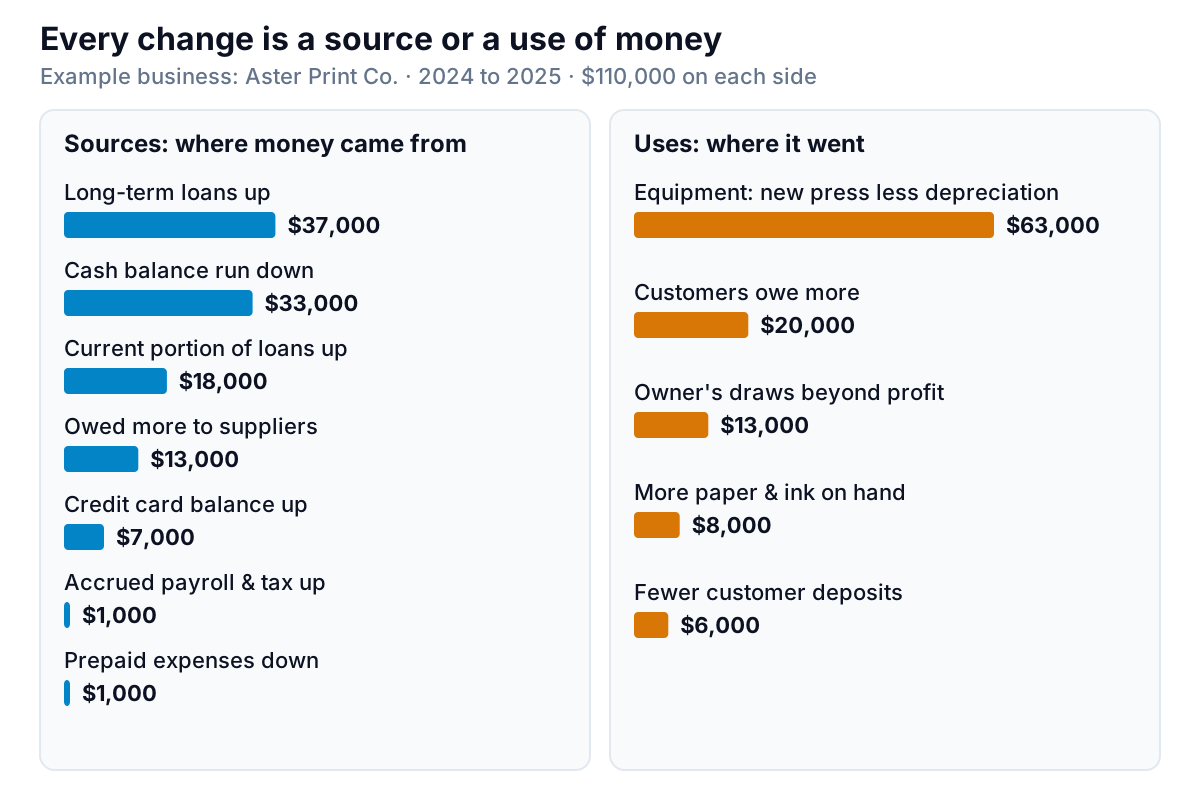
Read from the largest use down:
- A new press: $63,000. Aster bought a $95,000 digital press in the spring, with an $80,000 loan and $15,000 of cash. Equipment rose by the $95,000 less $32,000 of depreciation on all its equipment for the year. That one decision explains most of the debt lines too.
- Customers owing more: $20,000. Receivables rose 38.5% while sales rose 11.5%. Converted to days of sales, customers took about 31 days to pay at the end of 2024 ($52,000 ÷ $610,000 × 365) and about 39 days at the end of 2025 ($72,000 ÷ $680,000 × 365). Some of that is two large agency clients on 45-day terms. Some of it is slow payers nobody chased.
- The owner took $13,000 more than the business earned. Profit was $52,000 and draws were $65,000, so retained earnings went from $134,000 to $121,000. Distributions aren't an expense, so this never shows on the income statement.
- More paper and ink: $8,000, partly the stock the new press needs.
- Fewer customer deposits: $6,000. Aster used to take 50% up front on large jobs and quietly stopped in 2025. Deposits are money in hand before the work is done; losing them costs cash.
And the sources: new loans net of repayments ($55,000 across the long-term and current lines), running down the bank balance ($33,000), and paying suppliers and the card more slowly ($20,000). The last one is the warning sign. Using suppliers' money is fine when it's on their normal terms. Accounts payable up 46% on sales up 11.5% suggests Aster was paying late to cover the gap.
Two ratios sum up the effect. Working capital, current assets minus current liabilities, fell from $72,000 to $33,000. The current ratio fell from 2.06 to 1.33. Our guides to working capital and the current ratio cover what those mean for a lender. For Aster, they mean the next twelve months must fund $30,000 of loan principal from a smaller cushion.
Pair it with the income statement
A comparative balance sheet is strongest next to the profit and loss for the period between the two dates. Three cross-checks take five minutes:
- Does retained earnings roll forward? Opening retained earnings + net income − distributions should equal closing retained earnings. For Aster: $134,000 + $52,000 − $65,000 = $121,000. If yours doesn't tie, something was posted to a closed year, and your bookkeeper should look.
- Are receivables and stock growing faster than sales? Compare their percent change with the percent change in sales and cost of sales. Faster growth means cash is getting tied up.
- Does the cash change make sense? Start from net income, add back depreciation, then add or subtract each working capital change, capital purchase, loan movement and draw. Aster's comes to $72,000 from operations, −$95,000 for the press, +$80,000 borrowed, −$25,000 of loan repayments and −$65,000 of draws: −$33,000, exactly the fall in cash. That walk is the statement of cash flows; our guide to cash flow from operating activities works through the first part of it line by line.
Getting it out of QuickBooks, Xero or a spreadsheet
In QuickBooks Online, Intuit's balance sheet help article (updated August 2026) gives the steps for the Balance Sheet Comparison report: go to Reports, then Standard reports, search for Balance Sheet Comparison, choose Custom dates from the Report period dropdown, set the From and To dates, and refresh. Intuit's list of reports by plan includes it in Simple Start, Essentials and Plus. Our QuickBooks balance sheet guide covers the month-by-month view and the six lines to check before you trust the numbers.
In Xero or any other software, run the balance sheet at each date, export both to Excel, and put them side by side with the formulas above. Match accounts by name, not by row number, because an account that exists at one date and not the other will shift the rows. A XLOOKUP or VLOOKUP on the account name from one export into the other avoids that.
Add a column for notes. The most useful comparative balance sheet Aster's owner produced had one sentence next to each flagged line: "new press, $80k loan", "two agencies on 45-day terms", "stopped taking deposits". The bank's loan officer read those first.
What Aster changed
The columns pointed to three fixes, none of them about profit:
- Deposits back on: 50% up front on any job over $2,500. At 2024's level, that's $6,000 back in the bank.
- A weekly receivables review for anything past 30 days, with a goal of getting back to about 31 days of sales: roughly $14,000 of cash at 2025's sales.
- Draws set from the plan, not the bank balance. With $30,000 of principal due in 2026, the owner capped draws at profit less principal until working capital recovers.
Keeping a comparative view current every month is where it usually falls apart. Parity connects to QuickBooks Online directly, or takes an Excel or CSV export of your balance sheets from any other tool, and builds a dashboard with the headline numbers and their trends, charts, what explains them and a table of what needs attention. Every number is checked against queries on the full dataset before you see it. Ask for each balance sheet line's change against last year with the lines over your threshold listed, and if you ask, it writes the report for your lender from the same data.
Connect QuickBooks or upload your balance sheets and get a checked dashboard of every balance sheet change, with the ones that need a reason flagged. Build a report from your data free
The bank renewed the line. The owner now runs the same comparison every quarter, and she reads deposits and receivables first: not the biggest lines on the page, but the two she can change by Friday.