The bank renewing the credit line for Gantry Tool Supply, an example distributor we'll follow through this guide, asked for one inventory number: days inventory outstanding for 2025. The bookkeeper sent 62 days. The owner, checking it over the weekend, got 73. Both used the same balance sheet and the same profit and loss.
Days inventory outstanding (DIO) is the average number of days your stock sits before it's sold: average inventory at cost ÷ cost of goods sold × the days in the period. The formula is simple. The disagreement at Gantry came from the one input people treat as obvious, "average inventory", and it's worth eleven days, or about $92,000 of stock, in this business. This guide shows how to calculate days inventory outstanding so it means something, how to break it down by category, what each day is worth in cash, and what to do when it moves.
The days inventory outstanding formula, and the input that changes it
Written out:
DIO = average inventory at cost ÷ cost of goods sold for the period × days in the period
Inventory is divided by cost of goods sold, not by sales, because both are carried at what you paid. Divide stock at cost by sales at selling price and you understate DIO by your markup. The same form appears in references such as Corporate Finance Institute's cash conversion cycle guide, where DIO is the first of the three parts. Our cash conversion cycle guide covers how DIO combines with the days your customers take to pay and the days you take to pay suppliers. This post stays with the inventory part.
Gantry's cost of goods sold for 2025 was $3,066,000, or $8,400 a day. Here's where the three answers came from:
| "Average inventory" taken as | Value | DIO |
|---|---|---|
| Closing balance only (Dec 31) | $520,000 | $520,000 ÷ $3,066,000 × 365 = 62 days |
| Opening + closing ÷ 2 | $540,000 | 64 days |
| Average of 13 month-end balances | $612,000 | 73 days |
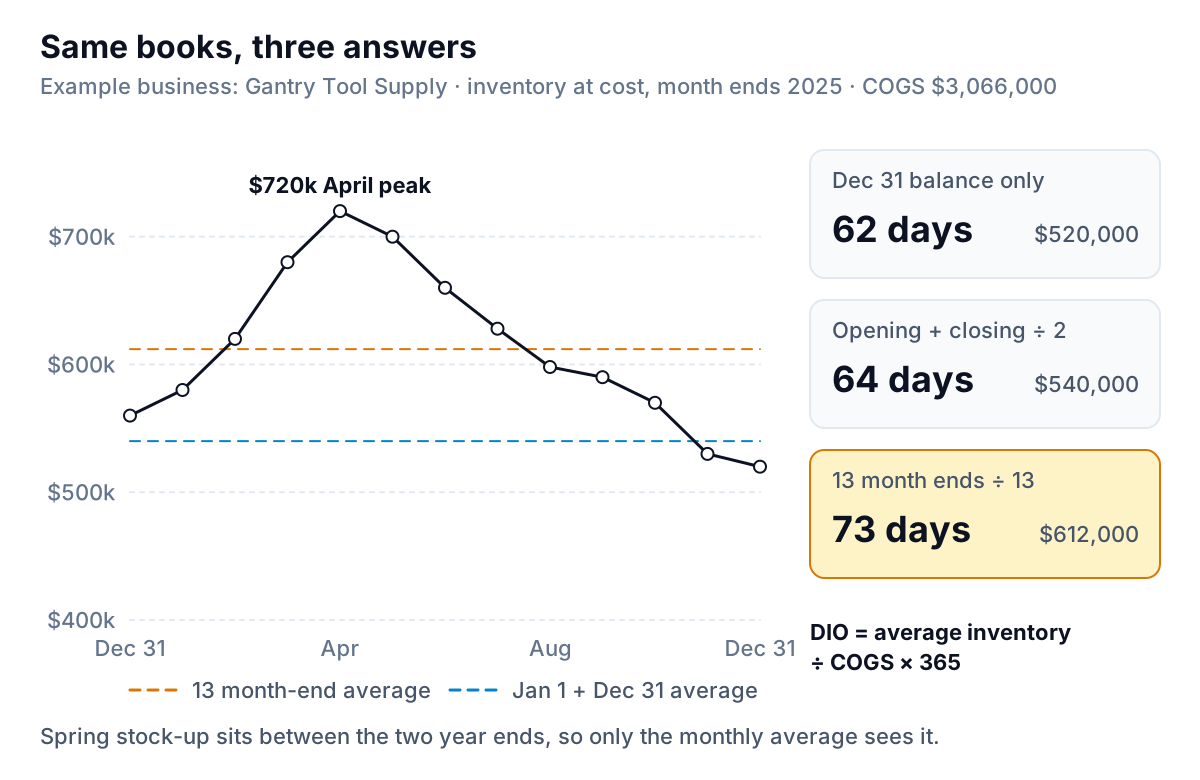
Gantry sells tools and fasteners to contractors, and contractors buy most in spring and summer. Stock climbs from $560,000 at the start of the year to $720,000 in April, then winds down to $520,000 by December. Any calculation that looks only at January 1 and December 31 sees the two quietest points of the year. The 13-point average (the opening balance plus each of the 12 month ends, divided by 13) sees the whole curve.
Decision rule: if your stock at any month end is more than 15% above or below the year-end figure, use the monthly average. For a business with flat stock all year, the two-point average is close enough. Whichever you choose, use the same method every year and say which one it is when you hand the number to a bank or buyer. The bookkeeper's 62 days wasn't wrong; it just answered a different question.
Monthly and quarterly DIO
For a quarter, use that quarter's cost of goods sold and the number of days in it: average inventory over the quarter's four month ends ÷ quarter COGS × 91 (or 90 or 92). Gantry's second quarter will always look slower than its fourth, because April stock is high while summer sales haven't happened yet. Compare each quarter with the same quarter last year, never with the one before it.
A rolling 12 months is the most useful single figure: the last 13 month-end balances and the last 12 months of COGS. It moves a little each month and doesn't jump with the season.
Break it down by category before you act on it
A business-wide DIO of 73 days says Gantry holds about two and a half months of stock. It doesn't say which stock. Run the same calculation for each product category, with each category's own average inventory and cost of goods sold:
| Category | COGS 2025 | Average inventory | DIO |
|---|---|---|---|
| Fasteners & consumables | $1,095,000 | $90,000 | 30 days |
| Hand tools | $547,500 | $90,000 | 60 days |
| Power tools | $912,500 | $150,000 | 60 days |
| Safety & workwear | $292,000 | $72,000 | 90 days |
| Specialty equipment | $219,000 | $210,000 | 350 days |
| Whole business | $3,066,000 | $612,000 | 73 days |
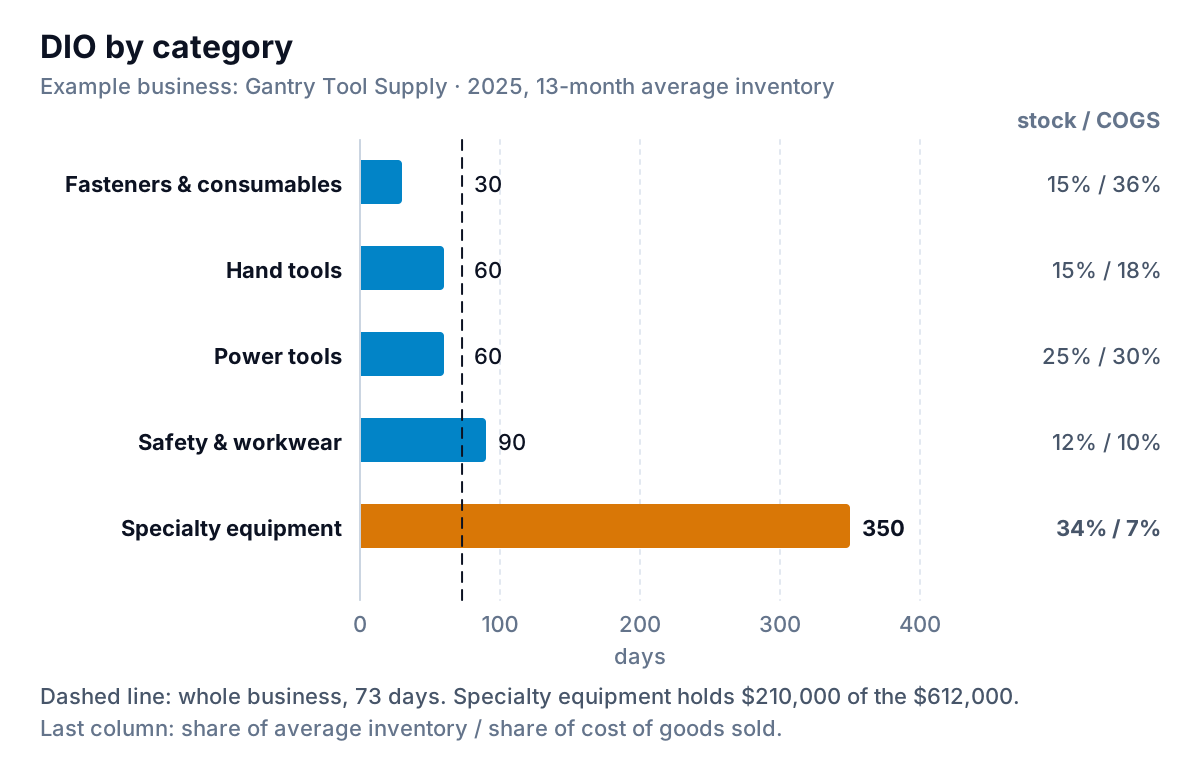
Specialty equipment (laser levels, pipe threaders, core drills) sits for almost a year on average. It holds 34% of Gantry's inventory dollars and accounts for 7% of its cost of goods sold. Everything else turns in 30 to 90 days. The business-wide figure blends a fast distributor and a slow showroom into one number that describes neither.
This is also where the year-on-year change came from. Gantry's 2024 DIO, calculated the same way, was 66 days ($528,000 average inventory on $2,920,000 of COGS). During 2025 the owner added a pipe-threading and core-drilling range, and specialty stock rose from a $140,000 average to $210,000 while its sales barely moved. Take out that extra $70,000 and 2025's DIO would have been 64.5 days, better than 2024. Every other category got faster. One buying decision made the whole business look slower.
Two cautions when you split by category. First, the categories must add up: the category inventories should sum to the balance sheet figure and the category COGS to the profit and loss, or you're working from two different data sets. Second, very small categories give noisy DIOs. A category with $2,000 of COGS a year can swing by hundreds of days because of one order. Group small ones together.
What one day of DIO is worth
Days become decisions when you turn them into dollars. Each day of DIO holds one day's cost of goods sold in stock. At Gantry that's $3,066,000 ÷ 365 = $8,400. So every day you take off DIO, at the same sales, releases about $8,400 of cash once, and it stays released for as long as the new stock level holds.
The owner set two targets. Specialty equipment goes to 180 days: keep one demo unit of each model plus the fastest sellers in stock, and order the rest from the supplier when a contractor asks, which the supplier can deliver in a week. Safety and workwear goes from 90 days to 60 by cutting the range of sizes held in the slowest lines.
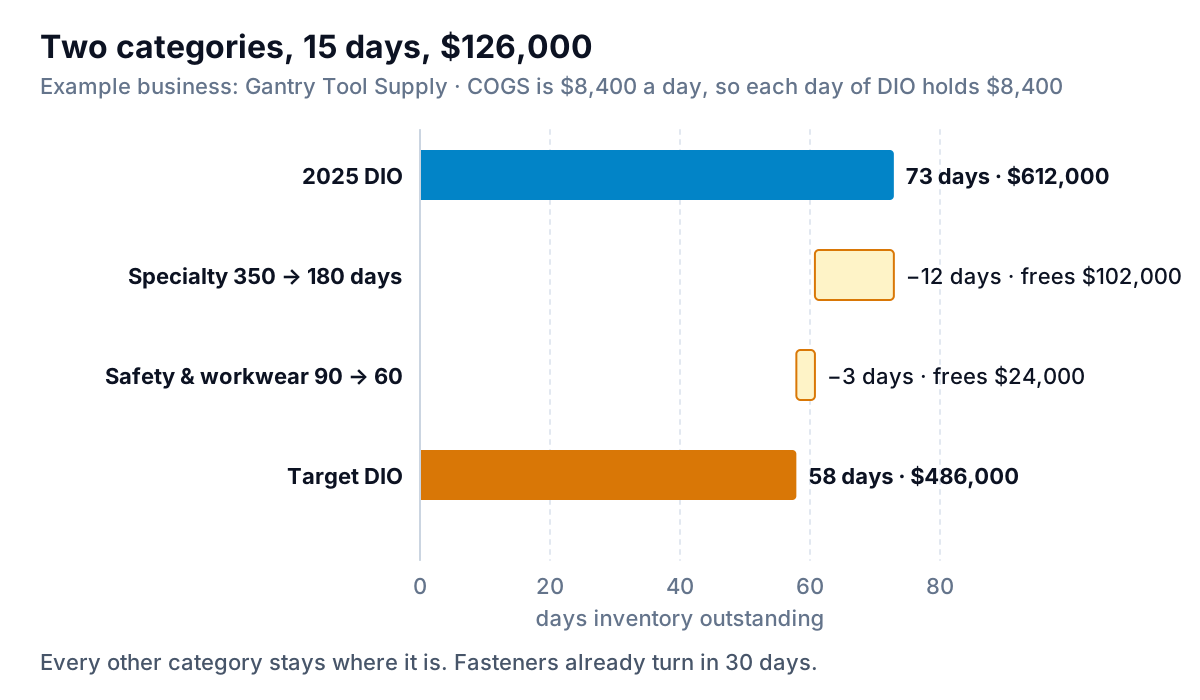
The arithmetic, category by category:
- Specialty: $219,000 ÷ 365 = $600 of COGS a day. At 180 days it needs $600 × 180 = $108,000 of stock, against $210,000 today. That frees $102,000.
- Safety and workwear: $800 a day × 60 days = $48,000, against $72,000. That frees $24,000.
- Whole business: $612,000 − $126,000 = $486,000 of average stock, and $486,000 ÷ $8,400 = 58 days.
Setting the target this way is more honest than "get DIO under 60". It says which shelves change, by how much, and what the business gives up. Here the trade-off is that a contractor wanting a core drill today waits a week. If those sales go to a competitor, the specialty target is too aggressive, and the next year's numbers will show it as lower specialty sales rather than as faster stock.
Getting the inputs from QuickBooks, Xero or a spreadsheet
You need two things: inventory at cost at each month end, and cost of goods sold for the same period, both for the whole business and, ideally, by category.
- QuickBooks Online. Run the Balance Sheet with columns by month to get the inventory asset at each month end; our QuickBooks balance sheet guide shows how to set the columns. The Profit and Loss gives cost of goods sold. For category detail, Intuit's guide to sales and inventory reports describes the Inventory Valuation Summary (quantity on hand, value and average cost for each product), which you can run as of each month end. Quantity tracking requires Plus or Advanced, per Intuit's inventory setup guide.
- Xero. The Balance Sheet and Profit and Loss give the totals; run the balance sheet with monthly comparison periods to get each month end. If you track items in a separate inventory or point-of-sale system, take the category detail from there and check that its total matches Xero's inventory account.
- A spreadsheet. Put the 13 month-end balances in B2:B14 and the year's cost of goods sold in B15. Then
=AVERAGE(B2:B14)/B15*365gives DIO. For categories, put one category per column and copy the formula across. A rolling version uses the last 13 rows and the sum of the last 12 months of COGS, with=SUM()over the matching range.
Is your DIO high? Compare it carefully
Your own trend is the best yardstick: the same calculation, the same averaging method, year after year, by category. Published figures help as a rough outside check only if you compare like with like.
We haven't found a current, published DIO figure for small distributors that uses this exact definition. The closest regular source is the US Census Bureau's Monthly Wholesale Trade report, which publishes an inventories-to-sales ratio for merchant wholesalers by kind of business. It is a different measure: month-end inventory divided by that month's sales (not cost of goods sold), giving months rather than days. For August 2026, the seasonally adjusted ratio was 2.02 for hardware, plumbing and heating equipment wholesalers (2.12 a year earlier), 2.64 for machinery, equipment and supplies wholesalers, and 1.18 for all merchant wholesalers.
To compare, work out Gantry's version of the same ratio: average inventory ÷ average monthly sales. Gantry's 2025 sales were $4,200,000, or $350,000 a month, so $612,000 ÷ $350,000 = 1.75 months. That's below the hardware group's 2.02. Gantry isn't overstocked as a business, which matches what the category breakdown showed: one shelf, not the warehouse.
Don't convert the Census ratio into days and set it beside your DIO. Because it divides by sales rather than cost, it's always lower than a COGS-based figure for the same stock, by roughly your markup.
When DIO moves, find the cause before you react
A change in DIO has a handful of usual causes, and each needs a different response:
| What you see | Likely cause | What to do |
|---|---|---|
| One category's DIO jumps; others flat | A new range or a large one-off buy | Set a sell-through target for the new lines and review at 90 days. Stop reordering anything below it. |
| DIO rises across most categories | Sales slowed and orders didn't | Cut reorder quantities to current sales, not last year's. Check open purchase orders. |
| DIO rises only at one quarter end | Buying ahead of a season or a price rise | Fine if planned. Compare the same quarter last year; it should fall back. |
| DIO falls sharply and stockouts rise | Stock cut too far | Raise safety stock on the best sellers. A low DIO with lost sales is not an improvement. |
| DIO jumps after year end, no change in buying | Count adjustment, cost change or reclassification | Ask your bookkeeper what changed in the inventory account. |
Price increases from suppliers usually don't move DIO much on their own, because they raise both your stock value and your cost of goods sold. They do make your stock worth more dollars at the same DIO, which is a cash question rather than a speed one.
Mistakes that make DIO lie
- Using sales instead of cost of goods sold. Gantry's sales-based figure would be $612,000 ÷ $4,200,000 × 365 = 53 days, 20 days better than reality.
- Mixing periods. A December inventory balance divided by a quarter's COGS times 365 produces nonsense. Match the inventory dates to the COGS period.
- Counting consigned or customer-owned stock. If goods on your shelf belong to a supplier until sold, or to a customer who has paid for them, they shouldn't be in your inventory figure. Check with your accountant how they're recorded.
- Chasing a lower number for its own sake. DIO is a speed measure. Stock that earns a good margin and never runs out can justify more days. Our GMROI guide weighs margin against the stock needed to earn it, and sell-through rate is the early warning for new lines before they show up in DIO.
Keeping it on one page
The work above takes an afternoon in a spreadsheet the first time and a few minutes a month after that, as long as someone exports the month-end balances and category sales on time. The useful version is a single view: DIO for the last 12 months with last year's line behind it, the category table underneath sorted by DIO, and the dollar value of the gap to each category's target. Our inventory dashboard guide lays out a page like that for a shop, with aged stock and a reorder list alongside.
If your inventory and cost of goods sold live in QuickBooks Online, or you can export them to a spreadsheet, Parity can build that dashboard from the data, with the trend, the category breakdown and what explains the change, and every figure is checked against queries on the full dataset before you see it. Ask it to, and it writes the month-end summary for your bank or partner from the same numbers.
Connect QuickBooks Online and get an inventory dashboard with the trend and the slow shelves on one page. Build a report from your data free
Back at Gantry, the owner sent the bank 73 days, said it was a 13-month average, and added one line: the specialty range is being cut back to 180 days, which should bring the business to about 58 by the end of 2026. That's a better answer than either number on its own.