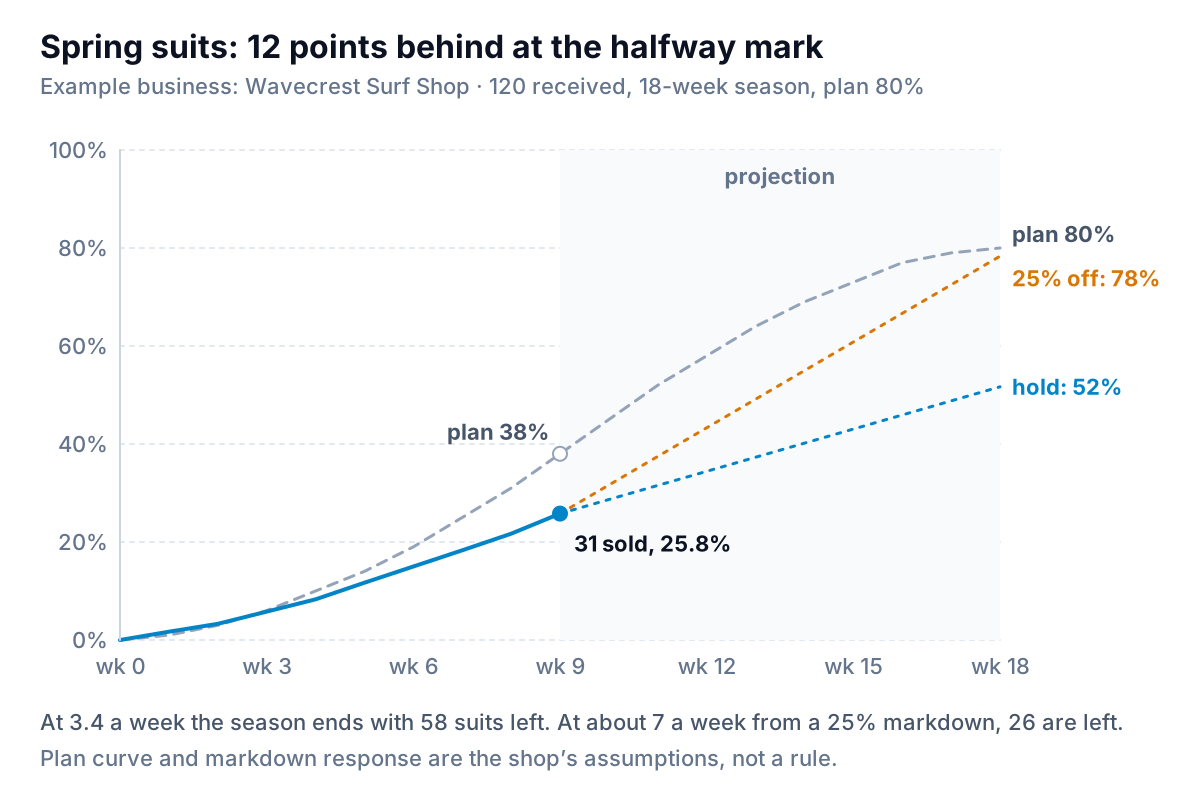
Nine weeks into an 18-week summer, Wavecrest Surf Shop, an example shop we'll follow in this guide, has sold 31 of the 120 women's spring suits it received in May. That's a sell-through rate of 25.8%: units sold ÷ units received, over the time since they arrived. The shop's plan said 38% by now.
Twelve points behind at the halfway mark is the moment a sell through rate earns its keep. Act now and a modest markdown can still move most of the stock at a decent price. Wait until August and the only tool left is a deep clearance. This guide covers which version of the formula to use (there are several, and they give different answers for the same stock), how to set a plan before the stock lands, how to project where a line will finish, and how to turn that into a markdown or reorder decision with real numbers.
The sell through rate formula: pick the denominator for the job
Every version is units sold divided by some measure of units available. The numerator is easy. The denominator is where the versions differ, and the right one depends on the question.
Take Wavecrest's men's boardshorts. The shop received 360 on May 1 and a reorder of 120 on June 1. It sold 60 in May and 150 in June, and had 270 left on June 30. Five reasonable calculations give four different answers:
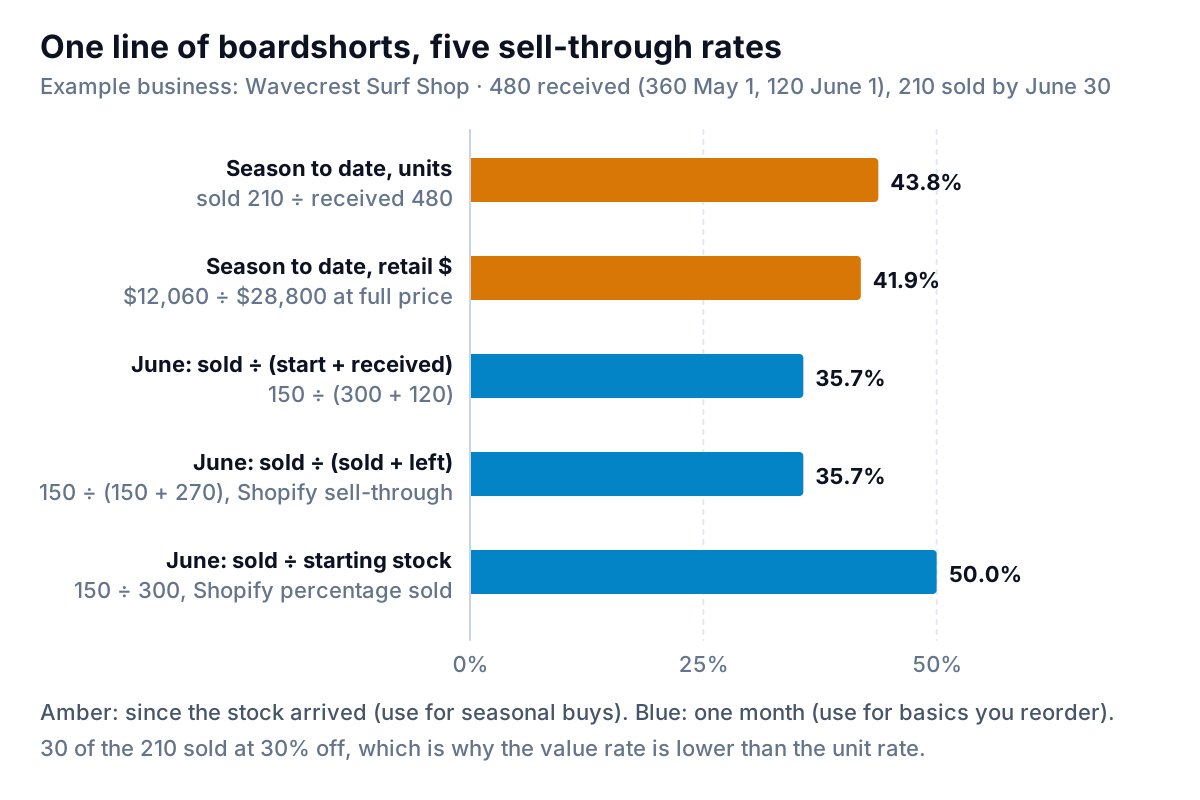
- Since receipt (season to date): units sold since the stock arrived ÷ units received. 210 ÷ 480 = 43.8%. This is the one for anything bought once for a season or an event: swimwear, holiday stock, a new product launch. It answers "how much of what we bought has gone?"
- For a period, against what was available: units sold in the period ÷ (stock at the start + units received in the period). June: 150 ÷ (300 + 120) = 35.7%. Use this for basics you reorder continuously, where there's no single "delivery" to measure against.
- Sold ÷ (sold + still on hand): 150 ÷ (150 + 270) = 35.7%, the same answer as above as long as nothing else changed the stock (returns, damage, transfers). This is how Shopify's Products by sell-through rate report works: total quantity sold ÷ (total quantity sold + total quantity still in inventory) for the period you select.
- Sold ÷ starting stock: 150 ÷ 300 = 50.0%. Shopify's Products by percentage sold report uses this one. It ignores stock received during the period, so it can run past 100% for an item you restock, and it overstates sell-through whenever a delivery lands mid-period.
Square for Retail has its own version: on the Plus and Premium plans, Reports > Inventory Reports > Inventory Sell-through compares what you received with what sold over a date range you choose, according to Square's help article. If you use a POS report, check which denominator it uses before you set targets against it.
Rule: choose one version per kind of stock, write it at the top of your report, and never compare a number from one version with a number from another. Most "our sell-through dropped" alarms in small shops come from someone switching reports.
Units or dollars?
Unit sell-through counts every unit the same, whatever it sold for. Of the 210 boardshorts Wavecrest sold, 30 went at 30% off ($42 instead of $60). Measured in retail dollars, sell-through is (180 × $60 + 30 × $42) ÷ (480 × $60) = $12,060 ÷ $28,800 = 41.9%, against 43.8% in units.
The gap between the two is a quick markdown gauge. If unit sell-through is well ahead of value sell-through, a lot of the line is moving at a discount, and the unit rate is flattering it. Track units for decisions about quantity (reorder, transfer, clear), and check the value rate once a month to make sure you're not buying sell-through with price.
Some shops measure value at cost instead of retail, which ties it to the money spent. That's fine, as long as you don't mix bases. At cost, the markdown doesn't show up at all, because cost doesn't change when you discount.
Set the plan before the stock arrives
A sell-through rate means little on its own. Is 25.8% at week 9 good? For a line meant to last all summer, maybe. For one meant to sell out by July, no. You need a plan, and the plan has two parts: a target for the end of the season, and a curve for getting there.
Wavecrest sets its season targets from margin and risk. Spring suits are bought once, can't be reordered mid-season, and are worth far less next year, so the target is 80% at full price by the end of week 18, with the remaining 20% planned for clearance. Boardshorts can be reordered and carried over, so their target is lower.
The curve comes from last year. Take last season's weekly unit sales for the category, turn each week into its share of the season's total, and add the shares up week by week. Last summer, 47% of Wavecrest's spring suit sales had happened by the end of week 9. With a target of 80% of units received, the plan at week 9 is 47% × 80% = 38%. Do the same for every week and you have a curve, like the dashed line in the chart below. If last year was unusual (a cold June, a late delivery), average two years or adjust by hand.
Whatever method you use, write the weekly plan down before the stock arrives, so you're measuring against a decision you made calmly and not one you make while staring at a full rack.
The weekly check: where will this line finish?
Every week, for each seasonal line, project the end of the season at the current pace:
Projected sell-through = (units sold so far + recent weekly rate × weeks left) ÷ units received
Use a recent rate, the last three or four weeks, if the season has a peak. Wavecrest's three main summer lines at week 9:
| Line | Received | Sold | Sell-through | Plan at week 9 | Projected at week 18 | Action |
|---|---|---|---|---|---|---|
| Rash guards | 200 | 124 | 62.0% | 45% | Sells out around week 14 | Reorder 40 |
| Boardshorts | 480 | 210 | 43.8% | 42% | On plan | Hold |
| Women's spring suits | 120 | 31 | 25.8% | 38% | 52% (62 sold, 58 left) | Mark down |
Rash guards are selling about 14 a week. At that rate the 76 left last five or six weeks, and the season has nine to go. The supplier delivers in three weeks, so Wavecrest orders now. Forty more covers roughly the gap at the current pace while leaving little to carry into autumn.
Spring suits are the problem. At 31 in nine weeks, about 3.4 a week, another nine weeks sells about 31 more, ending at 62 of 120, or 52%, against the 80% plan.
Turning sell-through into a markdown decision
A markdown is a trade: less money per unit for more units sold, sooner. To compare options, you need three assumptions, and it's better to write them down than to pretend you don't have them. Wavecrest's for spring suits, priced at $180:
- At full price, the current 3.4 a week continues.
- At 25% off ($135), the shop expects about 7 a week, based on what happened when it marked down a similar line last year.
- Whatever is left at the end of the season goes to a fall clearance at 60% off ($72), if it sells at all.
| Option | Sold weeks 10–18 | Revenue in season | Left at end | Clearance at $72 | Total |
|---|---|---|---|---|---|
| A. Hold price | 31 at $180 | $5,580 | 58 | $4,176 | $9,756 |
| B. 25% off now | 63 at $135 | $8,505 | 26 | $1,872 | $10,377 |
| C. Wait 4 weeks, then 40% off | 14 at $180, then 45 at $108 | $7,380 | 30 | $2,160 | $9,540 |
Option B brings in $621 more than holding price and leaves 32 fewer suits to clear, and the clearance column is the optimistic case for A, because it assumes all 58 leftovers find a buyer in October. Option C shows the cost of waiting: the shop still has to discount, just deeper, with fewer weeks to sell at the lower price. The cost of the suits is already spent in every option, so the comparison is on what comes back in.
Change the assumptions and the answer can change. If a 25% markdown only lifted sales to 5 a week, B would bring in $6,075 in season (45 suits) plus 44 left at $72 ($3,168): $9,243, worse than holding. That's why the response you assume should come from your own past markdowns, and why the first markdown should be modest: you can always go deeper, but you can't take a discount back.
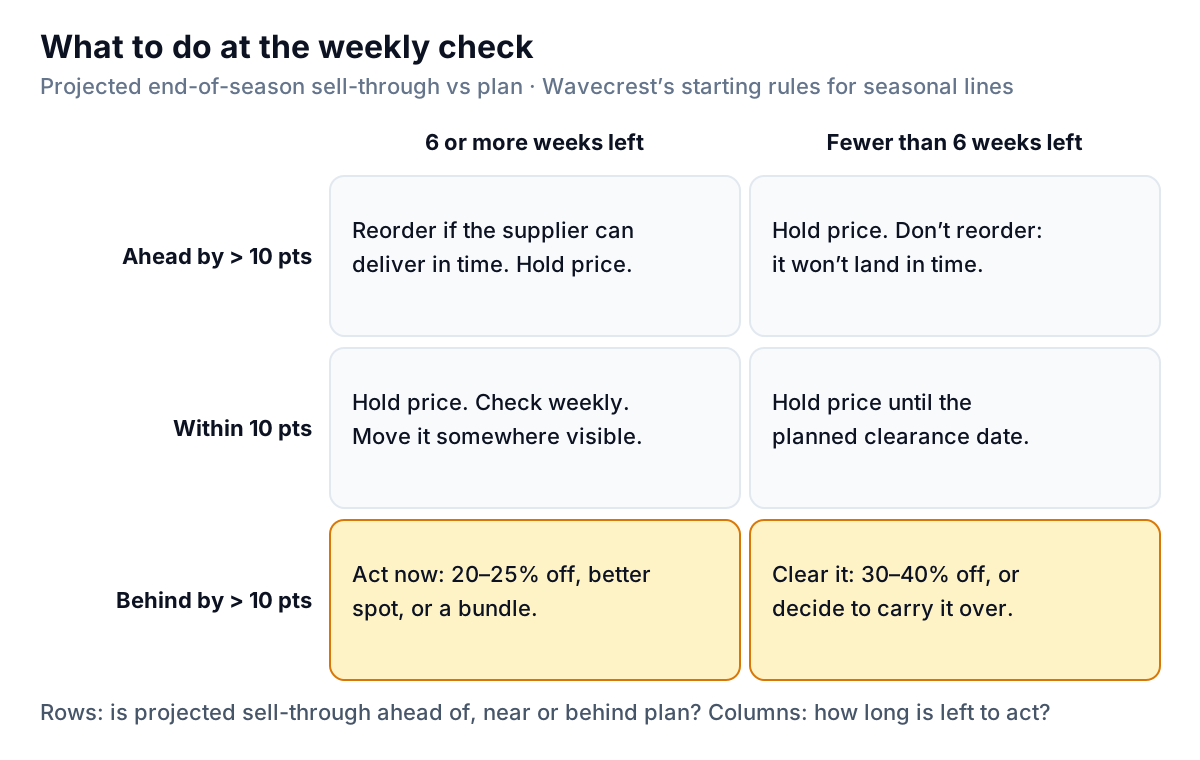
A markdown isn't the only response to being behind. Before cutting price, check the cheaper fixes: is the line on the floor or still in the back room? Are the popular sizes missing, so the rack looks full but has nothing anyone can buy? Is it displayed with the boards and leashes that sell it? A spring suit hanging in the far corner might simply need to be by the door.
Mistakes that make sell-through misleading
- Measuring a size run as one line. 40% sell-through on a jacket can hide 90% in medium and 10% in XXL. Check by size or variant before reordering, or you'll reorder the sizes you already have too many of.
- Ignoring returns. Count net units sold. A line with a high return rate looks better on gross sales than it is.
- Starting the clock at the wrong time. Measure from when stock was on the floor, not when the invoice was dated. A delivery that sat in the back room for two weeks shouldn't count those weeks against itself.
- Only checking at the end of the season. By then sell-through is a score, not a tool. Weekly is right for seasonal lines; monthly is fine for basics. Our retail sales report guide shows where it sits in a 15-minute weekly review.
- Treating a sell-out as success. A line that sold out in week 5 of 18 probably cost you sales in weeks 6 to 18. Very high sell-through early is a signal to buy deeper next year.
Where sell-through fits with the rest of your stock numbers
Sell-through is the early warning. It tells you, while there's still time to act, which lines will end the season with stock you don't want. The slower measures confirm it later: days inventory outstanding shows how long stock sits across the business, and GMROI shows how much gross margin each dollar of stock earns once markdowns are in. And the plan-versus-actual you track here feeds next season's buying: our guide to open to buy shows how to turn sell-through by category into how much you can still order each month. For the wider set of numbers a shop watches, the retail KPI guide puts sell-through alongside traffic, conversion and margin.
If your sales and inventory are in Shopify or Square, or you can export units received and sold by item to a spreadsheet, Parity can build a dashboard of sell-through by line against plan, with the lines that are falling behind listed at the top. Every figure is checked against queries on the full dataset before you see it, and you can update it each week with a newer export.
Connect Shopify or Square and get a dashboard of sell-through by line, with what's behind plan at the top. Build a report from your data free
Wavecrest moved the spring suits to the front, took 25% off, and set a reminder to check again in two weeks. If they're not selling at least six a week by then, the next decision is already on paper.