Fifty-five cents. That's the gross margin Hollyhock Home & Garden, an example garden center we'll use throughout this guide, keeps from each dollar of glazed pottery it sells, the best of any department in the store. Bedding annuals keep 45 cents. Yet every dollar Hollyhock ties up in annuals earns $9.00 of gross margin a year, and every dollar tied up in pottery earns $1.38.
That second pair of numbers is GMROI, gross margin return on inventory investment: annual gross margin dollars ÷ average inventory at cost. It answers the question a margin percentage can't: how hard is the money on the shelves working? This guide calculates GMROI by department for Hollyhock, shows why it ranks products so differently from margin, sets a break-even line from the store's own costs, and works through what to do with the low-GMROI lines, including when to leave them alone.
The GMROI formula, department by department
GMROI = gross margin $ for the year ÷ average inventory at cost
Gross margin dollars are sales minus cost of goods sold. Average inventory is the cost value of stock, averaged over the year. Both sides have to cover the same 12 months, and both are at cost; inventory at retail price would make every department look poorer than it is. The result is usually written as a dollar figure ("$2.55") or a plain ratio ("2.55"), and it means the same thing: dollars of gross margin per dollar of stock per year. A GMROI under 1.0 means a line earns less margin in a year than the stock costs to hold.
Here's Hollyhock's 2025, using the average of 13 month-end stock values for each department:
| Department | Sales | Margin % | Gross margin $ | Avg inventory at cost | GMROI |
|---|---|---|---|---|---|
| Annuals & bedding | $420,000 | 45% | $189,000 | $21,000 | 9.00 |
| Houseplants | $160,000 | 50% | $80,000 | $16,000 | 5.00 |
| Perennials | $380,000 | 44% | $167,200 | $52,000 | 3.22 |
| Christmas & seasonal | $180,000 | 52% | $93,600 | $30,000 | 3.12 |
| Soil, mulch & feed | $300,000 | 33% | $99,000 | $45,000 | 2.20 |
| Trees & shrubs | $340,000 | 42% | $142,800 | $98,000 | 1.46 |
| Pottery & décor | $220,000 | 55% | $121,000 | $88,000 | 1.38 |
| Store | $2,000,000 | 44.6% | $892,600 | $350,000 | 2.55 |
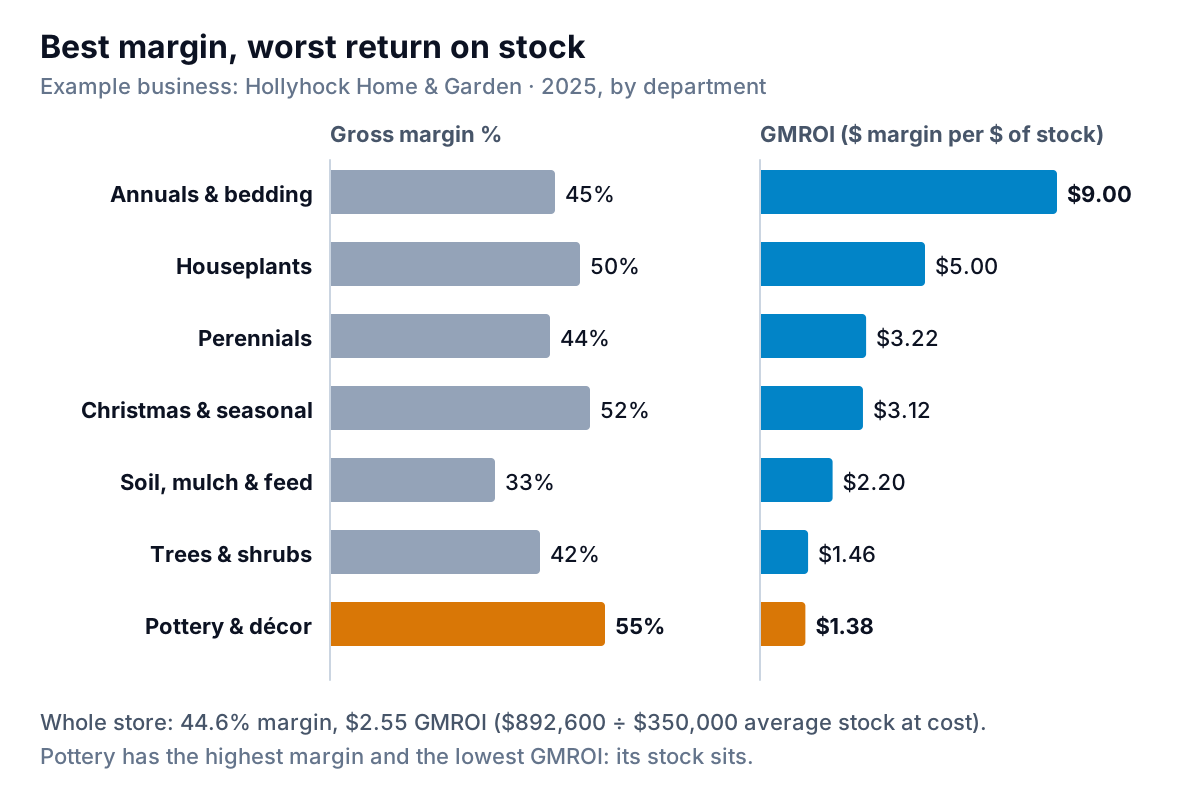
Christmas stock deserves a note. It's only on the floor from October to December, but its average is taken over all 13 month ends, zeros included, because the question is what the stock earns per dollar per year. Averaging only the months it's in stock would make it look several times worse than it is.
Why margin and GMROI disagree
GMROI is two things multiplied together:
GMROI = margin % × (sales ÷ average inventory at cost)
The second part is how many dollars of sales each dollar of stock produces in a year. Annuals: $420,000 ÷ $21,000 = 20 times. Pottery: $220,000 ÷ $88,000 = 2.5 times. So annuals earn 45% × 20 = 9.00 and pottery earns 55% × 2.5 = 1.38. Flats of petunias arrive in April and are gone in a fortnight. A $400 glazed urn can sit in the yard for a year.
You'll also see the formula written with inventory turnover: GMROI = margin % ÷ (1 − margin %) × turns, where turns are cost of goods sold ÷ average inventory. For pottery that's 0.55 ÷ 0.45 × ($99,000 ÷ $88,000) = 1.22 × 1.125 = 1.38. Same answer; use whichever your data makes easier.
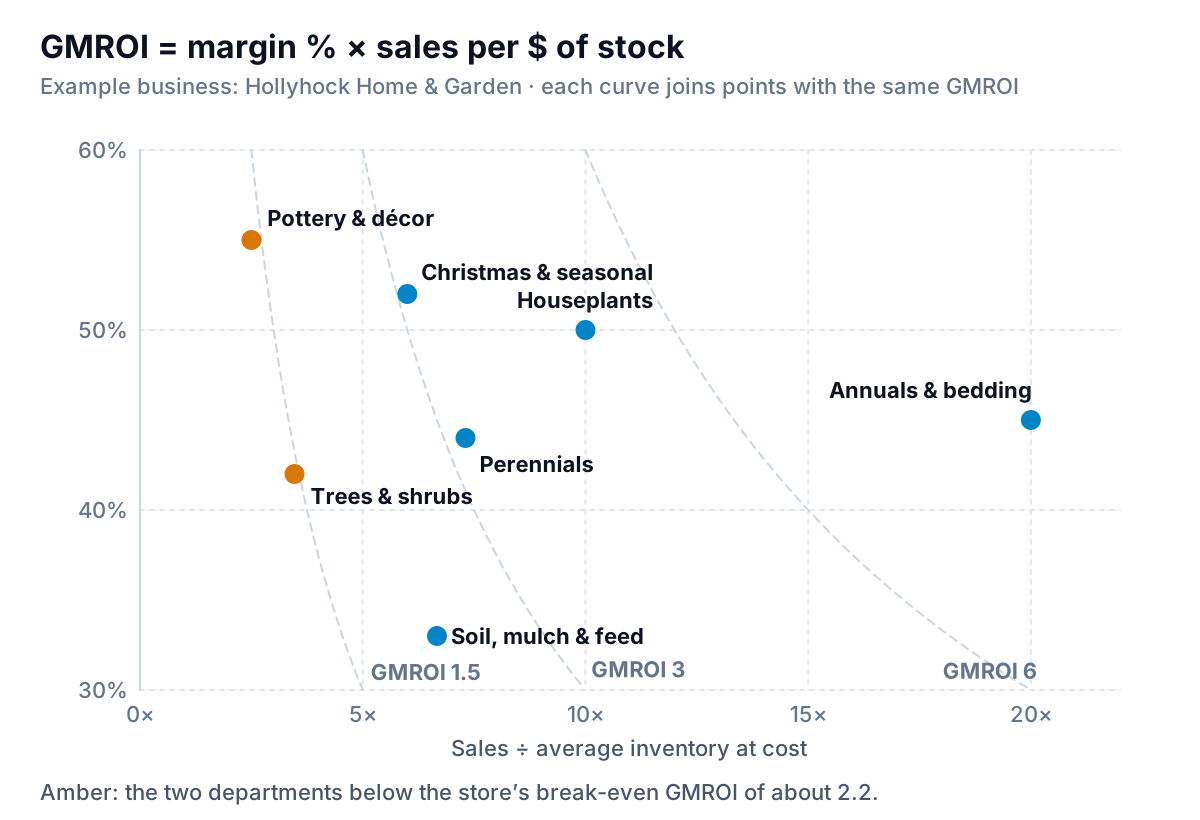
The split tells you which lever to pull. To lift pottery to a GMROI of 2.2 through margin alone, at 2.5 times sales per dollar of stock, Hollyhock would need an 88% margin. Not possible. To get there through stock alone, at the same sales and margin, it needs average pottery inventory of $121,000 ÷ 2.2 = $55,000 instead of $88,000. That is possible. For most low-GMROI lines in a small shop, the problem is how much stock sits behind the sales, not the price.
Average inventory: where most GMROI figures go wrong
Garden centers swing harder than almost any retailer. Hollyhock held $190,000 of stock on January 1, $640,000 at the end of April and $210,000 on December 31. Take the shortcut of averaging the two year ends and average inventory is $200,000, which makes the store's GMROI $892,600 ÷ $200,000 = 4.46. The 13 month-end average, $350,000, gives 2.55. Same year, same margin, and the shortcut flatters it by 75%.
For a seasonal business, use month-end values. For departments, that means a month-end stock report by category, at cost. Most point-of-sale systems produce one; Shopify, for example, has a Month-end inventory value report that multiplies each variant's cost per item by its month-end quantity. If you use QuickBooks Online with inventory tracking, Intuit's Inventory Valuation Summary gives quantity, value and average cost by product as of any date. Our guide to days inventory outstanding shows the same averaging problem from the speed side, with the spreadsheet formula.
What's a good GMROI? Start with your own break-even
The most useful threshold doesn't come from an industry table. It comes from your own costs. Hollyhock's operating expenses (staff, rent, utilities, card fees, marketing) were $780,000 in 2025, leaving $112,600 of pretax profit. Divide operating expenses by average inventory: $780,000 ÷ $350,000 = 2.23. That's the GMROI the store needs, on average, just to cover its running costs from the margin its stock earns.
It's a blunt tool, because it charges every department for overheads in proportion to its stock, and a tree yard and a houseplant bench don't use staff and space in that proportion. But as a first sort it's honest: departments well above 2.23 carry the store, and departments well below it are being carried. At Hollyhock that's trees and shrubs (1.46) and pottery (1.38). Soil and feed sits just under the line at 2.20.
For an outside reference, we haven't found a current published GMROI figure for independent garden centers. We worked one out from the US Census Bureau's Annual Retail Trade Survey, the latest benchmarked edition, which covers 2022. For building material and garden equipment and supplies dealers (NAICS 444), Census estimates 2022 gross margin at $187.8 billion and end-of-year inventories at $85.2 billion (2022) and $73.8 billion (2021). Averaging the two year ends gives $79.5 billion, and $187.8 ÷ $79.5 = about 2.36. Treat it as rough: the group is dominated by home-improvement chains, it's four years old, and it uses the two-year-end average that flatters seasonal businesses. Your own break-even line is the better test.
What to do with a low-GMROI line
Don't start with the department. Start inside it. Hollyhock's pottery department is five lines, all priced to the same 55% margin:
| Pottery line | Sales | Gross margin $ | Avg inventory | GMROI |
|---|---|---|---|---|
| Small glazed pots | $90,000 | $49,500 | $18,000 | 2.75 |
| Garden statuary | $30,000 | $16,500 | $8,000 | 2.06 |
| Medium planters | $60,000 | $33,000 | $22,000 | 1.50 |
| Large urns | $25,000 | $13,750 | $22,000 | 0.63 |
| Fountains | $15,000 | $8,250 | $18,000 | 0.46 |
Small pots are fine. The department's problem is large urns and fountains: $40,000 of average stock, 45% of the department's inventory, earning $22,000 of margin. Customers buy them one at a time, but Hollyhock was ordering them by the pallet to fill the yard.
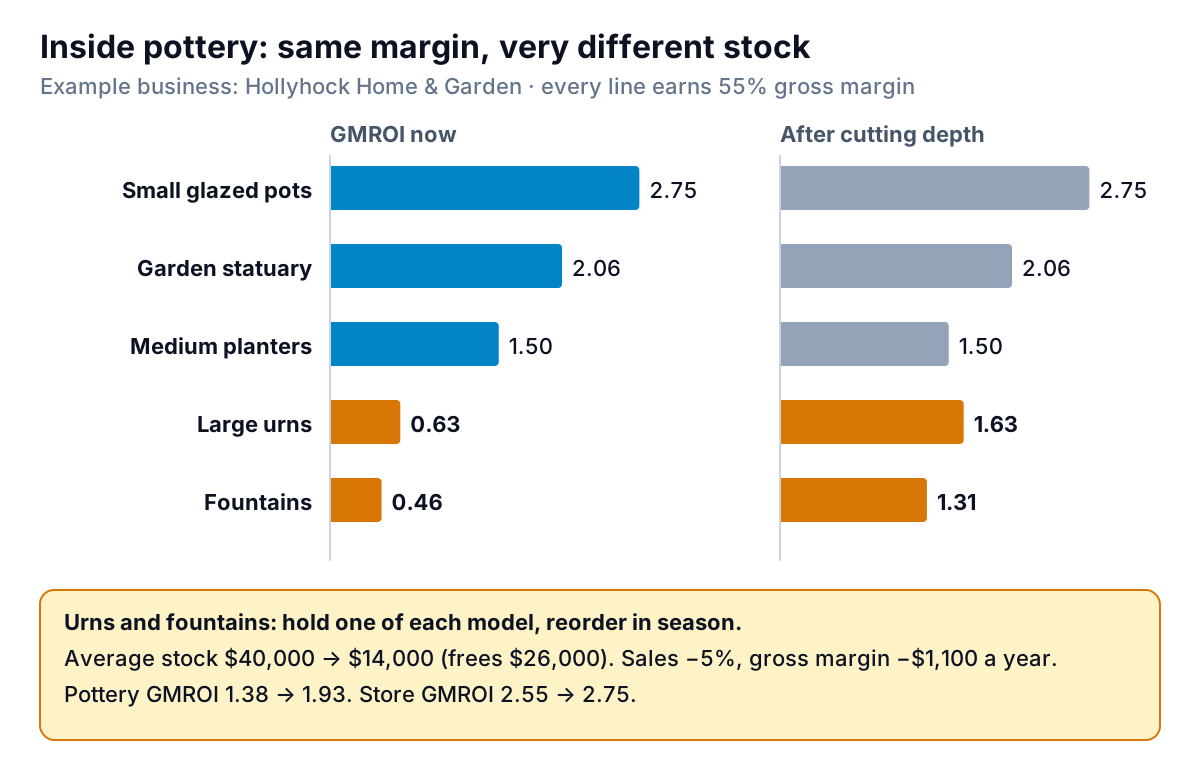
The owner's plan: keep every model on display, hold one of each, and reorder from the supplier during the season, which ships in about ten days. Assume that costs 5% of urn and fountain sales, from customers who won't wait. The numbers:
- Average urn and fountain stock falls from $40,000 to $14,000, freeing $26,000 of cash.
- Sales fall from $40,000 to $38,000 and gross margin from $22,000 to $20,900: $1,100 a year less.
- Pottery GMROI goes from 1.38 to $119,900 ÷ $62,000 = 1.93. The store goes from 2.55 to 2.75.
- At a 9% interest rate on the credit line (an example rate), paying down $26,000 saves $2,340 a year, more than the margin given up, before counting the yard space it frees.
That's the general pattern. In rough order of how often they work for a small shop:
- Cut depth, keep breadth. Fewer units of each item, the same choice on display. Works when the supplier can reorder in season.
- Buy in waves. For trees and shrubs, split the spring order: a first delivery for April and May and a second booked for June once you've seen what sells. If that took Hollyhock's average tree stock from $98,000 to $75,000 at the same sales, the department's GMROI would rise from 1.46 to 1.90.
- Clear before you carry. Stock that will have to be overwintered, stored or re-potted costs labor and losses. A fall sale at a lower margin often beats a full-margin sale next spring. Check the sell-through on seasonal lines weekly so you see it coming; our guide to sell-through rate covers when to mark down.
- Drop the bottom of the line. Within a department, rank items by GMROI and look hard at the bottom fifth. A Pareto analysis of item sales usually shows that they bring a small share of the margin.
- Ask the supplier. Returns of unsold stock, consignment for big-ticket display pieces, or smaller minimum orders all raise GMROI without touching price.
Raising price is the last lever, not the first. It helps only when the line is selling well at the current price and the stock is reasonable, which is rarely the case for a low-GMROI line.
When to leave a low GMROI alone
- It brings people in. Soil, mulch and feed earn a 33% margin and sit just under Hollyhock's break-even, but gardeners come back for them every few weeks and walk past the perennials on the way to the till. Judge a traffic driver by the store, not the shelf.
- It completes a sale. If the urns sell the plants that go in them, part of the plants' margin belongs to the urns.
- It's in its first season. A new line's first year includes the opening stock. Judge it on the second year.
- The cost is mainly space. GMROI measures money, not floor area. A line that earns well per dollar of stock can still waste a prime bench. If space is your constraint, add gross margin per square foot alongside it.
Keeping GMROI current without a spreadsheet afternoon
GMROI is an annual figure, but you don't need to wait a year. Run it as a rolling 12 months each month: the last 12 months of gross margin by department, over the average of the last 13 month-end stock values. Then put it next to margin percentage and sales per dollar of stock, so you can see which part moved. Our retail KPI guide shows where GMROI fits among the other numbers a shop tracks, and the inventory dashboard guide puts stock value, aged stock and reorders on the same page.
If your sales by department and month-end stock values come out of your POS or accounting system as an export, Parity can turn the file into a dashboard with GMROI by department, the trend and what drove it, with every figure checked against queries on the full dataset before you see it. You can refine it by chat, and update it next month with a newer export.
Upload your sales and month-end stock export and get GMROI by department, with the trend behind it. Build a report from your data free
The pottery yard at Hollyhock looks the same from the car park as it did last year: every urn and fountain is still there to look at. There's just one of each instead of six, and $26,000 that used to sit in the yard is back in the bank.