Nori Street Kitchen, a full-service noodle and rice-bowl restaurant we'll use as an example throughout this guide, took in $1.6 million last year. The dining room was full most nights, the delivery tablet never stopped, and the owner still finished the year with $48,000. That's a restaurant profit margin of 3%: pretax profit divided by total sales, or $48,000 ÷ $1,600,000.
Three cents on the dollar sounds like failure. For a full-service restaurant it's close to normal. This guide walks Nori's P&L from the top line to the bottom one, shows where each dollar goes, compares the result with the National Restaurant Association's latest survey data, and gives you rules for deciding which cost to attack first.
The formula, and which "profit" you mean
Every margin is a profit figure divided by sales. The trouble is that restaurant owners, lenders and software vendors use different profit figures and call them all "margin":
- Gross margin = (sales − food and beverage cost) ÷ sales. Nori's is 66.5%. It looks healthy because labor hasn't been taken out yet.
- Prime cost margin = (sales − food, beverage and all labor) ÷ sales. Nori's is 31%. Our guide to prime cost covers how to track it weekly.
- EBITDA margin = profit before interest, taxes, depreciation and amortization ÷ sales. Nori's is 6.4%. Buyers and lenders like this one.
- Pretax (net) margin = profit after every operating cost, depreciation and interest, before income tax ÷ sales. Nori's is 3.0%. This is the figure the industry benchmarks below use, and it's the one that tells you whether the business pays you.
When someone tells you their restaurant "runs a 15% margin", ask which line they stopped at. Usually it's before rent, before the owner's own pay, or both.
Walking a restaurant P&L from top to bottom
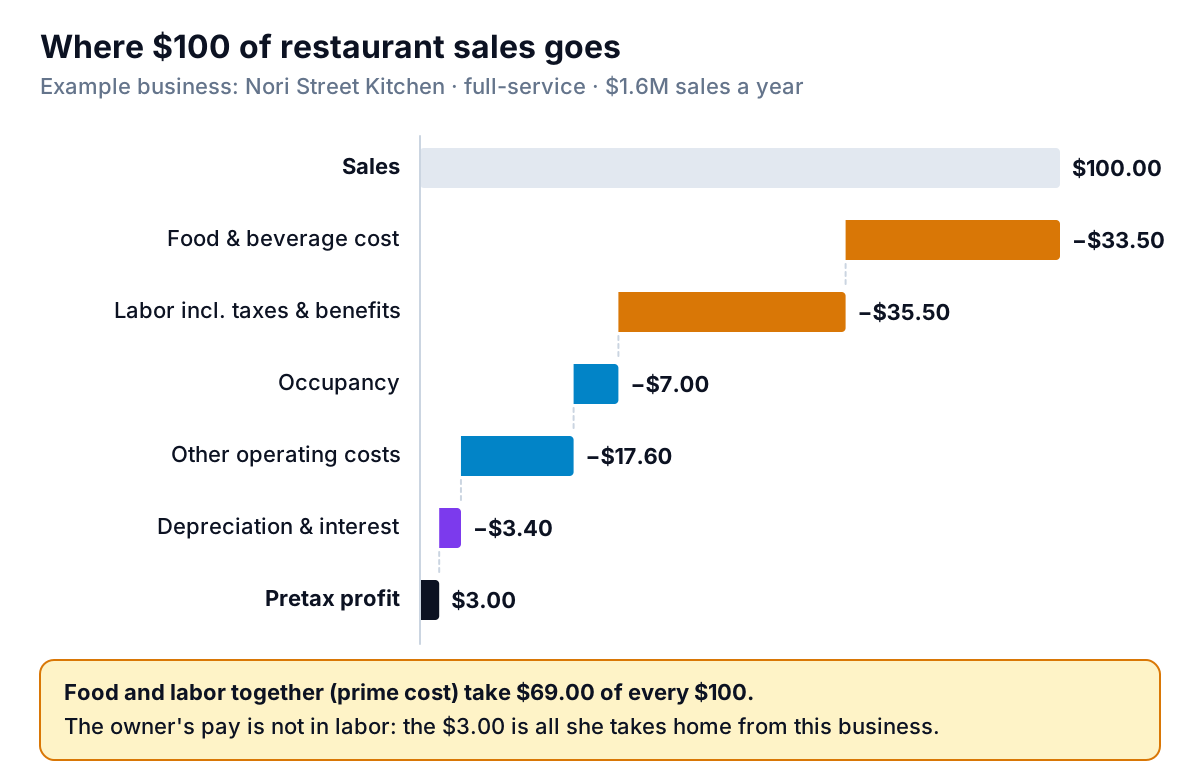
Here's Nori's year, line by line. If you've never read your own profit and loss statement this way, set it out in exactly this order, with each line as a percentage of total sales.
| Line | Annual | % of sales |
|---|---|---|
| Food sales | $1,360,000 | 85.0% |
| Beverage sales (incl. alcohol) | $240,000 | 15.0% |
| Total sales | $1,600,000 | 100.0% |
| Food and beverage cost | $536,000 | 33.5% |
| Labor: wages, payroll taxes, benefits | $568,000 | 35.5% |
| Prime cost | $1,104,000 | 69.0% |
| Occupancy: rent, common area charges, property tax | $112,000 | 7.0% |
| Delivery app commissions | $57,600 | 3.6% |
| Utilities | $48,000 | 3.0% |
| Insurance, accounting, licences, admin | $42,176 | 2.6% |
| Supplies, smallwares, takeout packaging | $41,600 | 2.6% |
| Card processing fees | $39,424 | 2.5% |
| Repairs and maintenance | $24,000 | 1.5% |
| Marketing | $16,000 | 1.0% |
| POS, scheduling and other software | $12,800 | 0.8% |
| EBITDA | $102,400 | 6.4% |
| Depreciation | $40,000 | 2.5% |
| Interest on the build-out loan | $14,400 | 0.9% |
| Pretax profit | $48,000 | 3.0% |
A few lines deserve a closer look, because they're where owners lose track.
Food and beverage cost
This should come from purchases adjusted for the change in inventory, not purchases alone. A month where you stocked up on rice and frozen dumplings will look terrible on purchases and fine on usage. The full method, including the difference between plate cost and period food cost, is in our food cost percentage guide.
Labor
Labor means everything it costs to have people working: wages, overtime, the employer's payroll taxes, workers' comp, health contributions and staff meals if you account for them. Wages alone understate it by several points. Our guide to restaurant labor cost percentage splits it into front and back of house.
The quiet lines
Card fees and delivery commissions are charged as a percentage of sales, so they grow every time you grow. At Nori, 12% of sales ($192,000) arrive through a delivery app on a plan that takes 30% of each order, which is where the $57,600 comes from. Card fees of 2.8% apply to the other $1,408,000. Together these two lines cost more than marketing, software and repairs combined.
What's a normal restaurant profit margin? The sourced numbers
The best public benchmark comes from the National Restaurant Association's 2025 Restaurant Operations Data Abstract, built from 2024 financial data reported by more than 900 restaurants. Its headline result: median income before taxes was 2.8% of sales for full-service restaurants and 4.0% for limited-service restaurants. Those are medians, so half the restaurants in the survey did worse.
The same survey splits the numbers further:
- By sales volume. Among full-service operators with $2 million or more in annual sales, median pretax income was 4.3% of sales; below $2 million it was 1.1%, according to the Association's analysis. Fixed costs spread over more sales, and bigger operators also reported lower food cost ratios.
- Labor. Salaries, wages and benefits were a median of 36.5% of sales at full-service restaurants and 31.7% at limited-service ones in 2024, 3.5 and 3.7 points above the averages in the 2010, 2013 and 2016 editions.
- Occupancy. Medians of 5.7% of sales for full-service and 5.2% for limited-service, highest in city centres.
- Food. Food and non-alcohol beverage costs were a median of 32.0% of sales at full-service and 32.4% at limited-service restaurants. Note the definition: alcohol is excluded, so compare it with your food and soft-drink cost, not a figure that includes the bar.
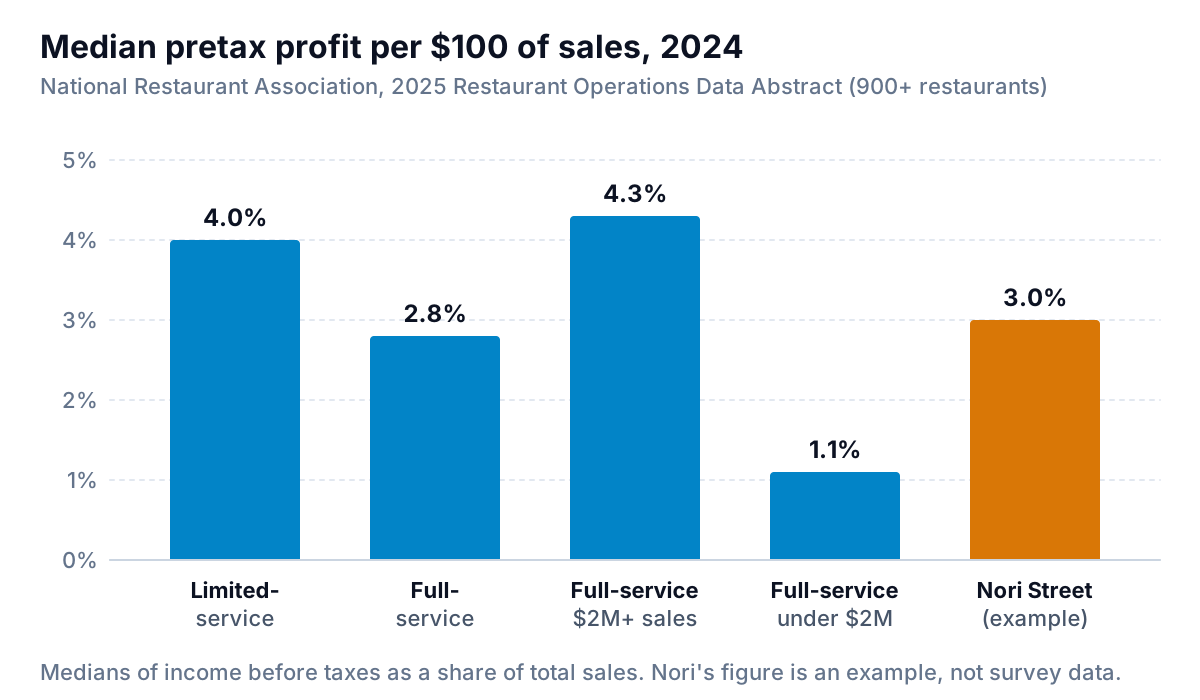
Against those figures, Nori looks better than its peers. At $1.6 million it sits in the under-$2-million band, where the median was 1.1%, and its 3.0% beats that. Its labor at 35.5% is a point under the full-service median. Its occupancy, at 7.0%, is higher than the 5.7% median, which is what a busy street costs.
Where the margin goes: five leaks to check first
When a restaurant profit margin slips, it's rarely one dramatic cost. It's a point here and half a point there. Check these in order:
- Food cost drifting with prices. Suppliers raise prices a few cents at a time. If your menu prices haven't moved in a year, your food cost percentage has. Re-cost your top ten sellers every quarter.
- Labor scheduled to habit, not to forecast. The same rota every Tuesday, whether you expect 80 covers or 140. Sales per labor hour by day part shows where the slack is.
- Delivery growth at full commission. A delivery order that brings $40 in sales and pays $12 in commission has to clear food cost, packaging and the cook's time with what's left. Growing this channel can lower your margin while raising your sales.
- Comps, voids and waste no one writes down. Every free dessert and remade dish is food cost with no sale against it. If your POS records comps and voids, put the weekly total next to sales.
- The owner working for free. If you manage the floor and don't pay yourself a wage, your margin is overstated. More on that below.
What one point of margin is worth
At $1.6 million in sales, every percentage point is $16,000. Nori's whole profit is three points. That makes small changes large, and it lets you compare fixes that look unrelated.
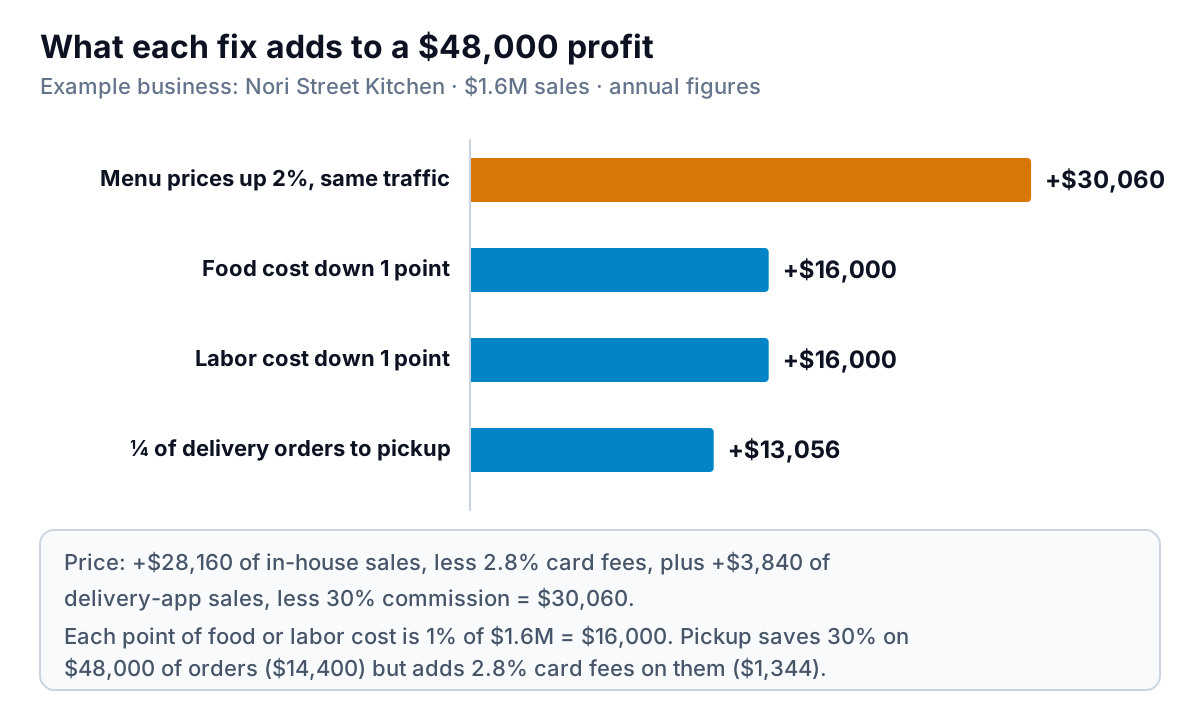
The arithmetic behind each bar:
- Prices up 2%, traffic unchanged: $28,160 more in-house sales, less 2.8% card fees, plus $3,840 more delivery sales, less the 30% commission. About $30,060 in all, because food cost in dollars doesn't change.
- Food cost down a point (33.5% to 32.5%) through tighter portioning, a re-costed menu or less waste: $16,000.
- Labor down a point (35.5% to 34.5%) by cutting slow shifts, not people: $16,000.
- A quarter of delivery orders moved to your own pickup, if those customers keep ordering: $48,000 of orders no longer pays $14,400 in commission, but now pays $1,344 in card fees. Net $13,056.
Two of these together would move Nori from 3.0% to roughly 5%. That's the practical answer to "how do I raise my restaurant profit margin": pick the two levers you can actually pull, price them in dollars, and do those first.
Decision rules
- If prime cost is above your target for three weeks running, fix it before anything else. It's two-thirds of your costs, and it's the part you control week to week.
- If sales are flat and margin is falling, look at price before you cut labor. Costs that rise with inflation need prices that do too.
- If sales are growing and margin is falling, check the channel mix. Growth through delivery or discounting can cost more than it earns.
- If occupancy is above 8–10% of sales at your own restaurant, you need more sales from the same room, through longer hours, a second daypart or catering, because rent won't shrink.
The 8–10% occupancy line is a rule of thumb for this example, not a survey figure; the survey medians above are your reference point.
The owner's pay problem
Nori's owner runs the floor six nights a week and isn't on the payroll. Her $48,000 is the profit, and it's also her pay. If she hired a general manager at, say, $70,000 plus about $5,600 in payroll taxes, Nori would lose $27,600 a year: a margin of −1.7%.
That doesn't mean she should close. It means she should know which business she owns: one that pays her $48,000 for a full-time job, plus whatever the restaurant would sell for. If the market wage for her role is higher than the profit, she's subsidising the restaurant with her time. Put a line on your P&L for the owner's market wage, even if you don't pay it, and look at the margin both ways.
Tracking it without waiting for the accountant
Most restaurants see their restaurant profit margin once a month, three weeks after the month ends, when the bookkeeper closes the books. By then the waste and the overtime have already happened. A better rhythm:
- Weekly: sales, food cost from counts, labor from payroll or the scheduling tool, and prime cost. Our restaurant KPI guide sets out the full weekly sheet.
- Monthly: the full P&L as percentages of sales, next to the same month last year.
- Quarterly: re-cost the menu and review rent, insurance and software contracts.
The data already lives in your systems: sales, comps and delivery mix in the POS; food purchases in supplier invoices and your accounting software; labor in payroll; rent and everything else in the general ledger. Most POS systems export sales summaries to CSV, and QuickBooks Online holds the P&L.
Parity connects QuickBooks Online and Square directly, or takes a CSV or Excel export from any other POS or payroll tool, and builds a dashboard: headline numbers with their trends, charts, what explains them, and a table of what needs attention, such as a week where labor jumped while covers fell. Every number is checked against queries on the full dataset before you see it. You can refine it by chat ("show prime cost by week", "split sales by delivery and dine-in"), save it as a template, and update it with next week's file. When you ask, it writes the monthly report for a partner or lender from the same data.
Connect QuickBooks or upload your POS and payroll exports and get a checked dashboard of sales, prime cost and profit. Build a report from your data free
Whatever tool you use, keep the test simple. Each month, you should be able to say what your pretax margin was, which line moved it most, and what one point of that line is worth in dollars. For Nori, the answer is $16,000, and that's reason enough to look every week.