Data Visualization
How to chart the numbers behind a business so the answer is obvious at a glance, with the data and the steps. 25 articles.
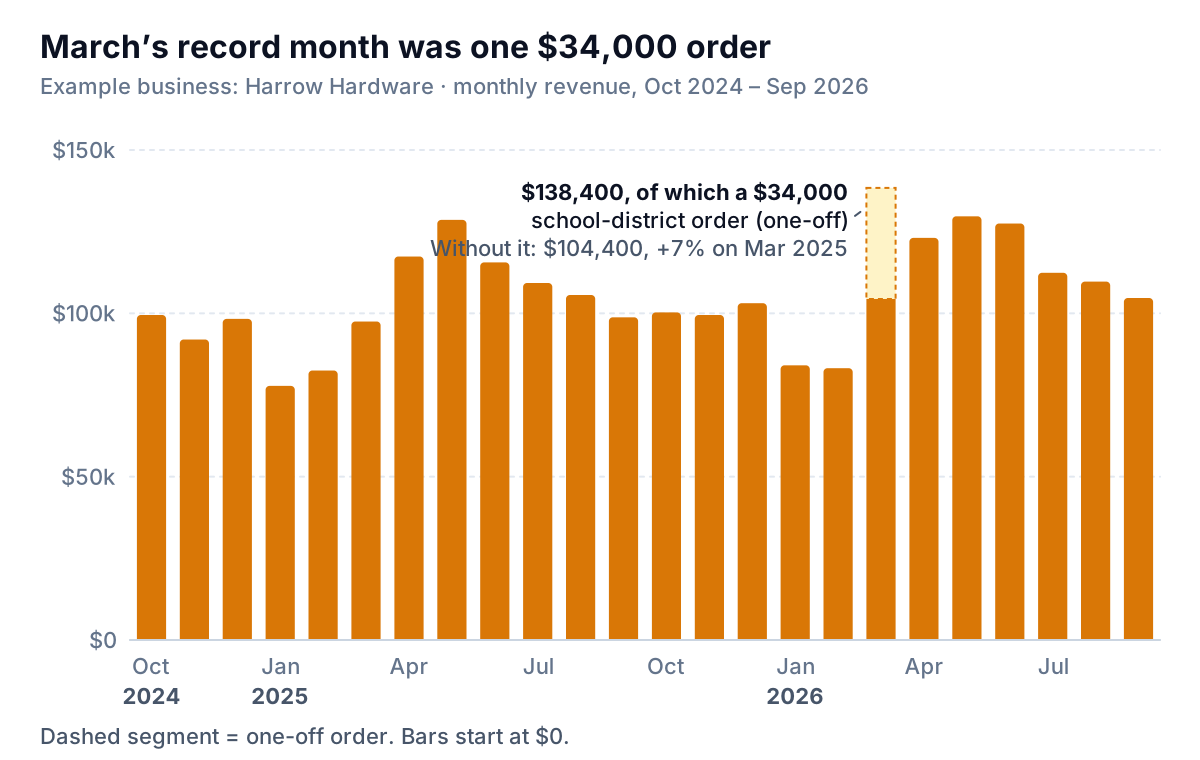
Revenue Chart: Which One Answers Your Question, and How to Build It
How to build a revenue chart that answers a real question: monthly columns, a trailing-12-month line, YTD against last year, and one-offs labelled.
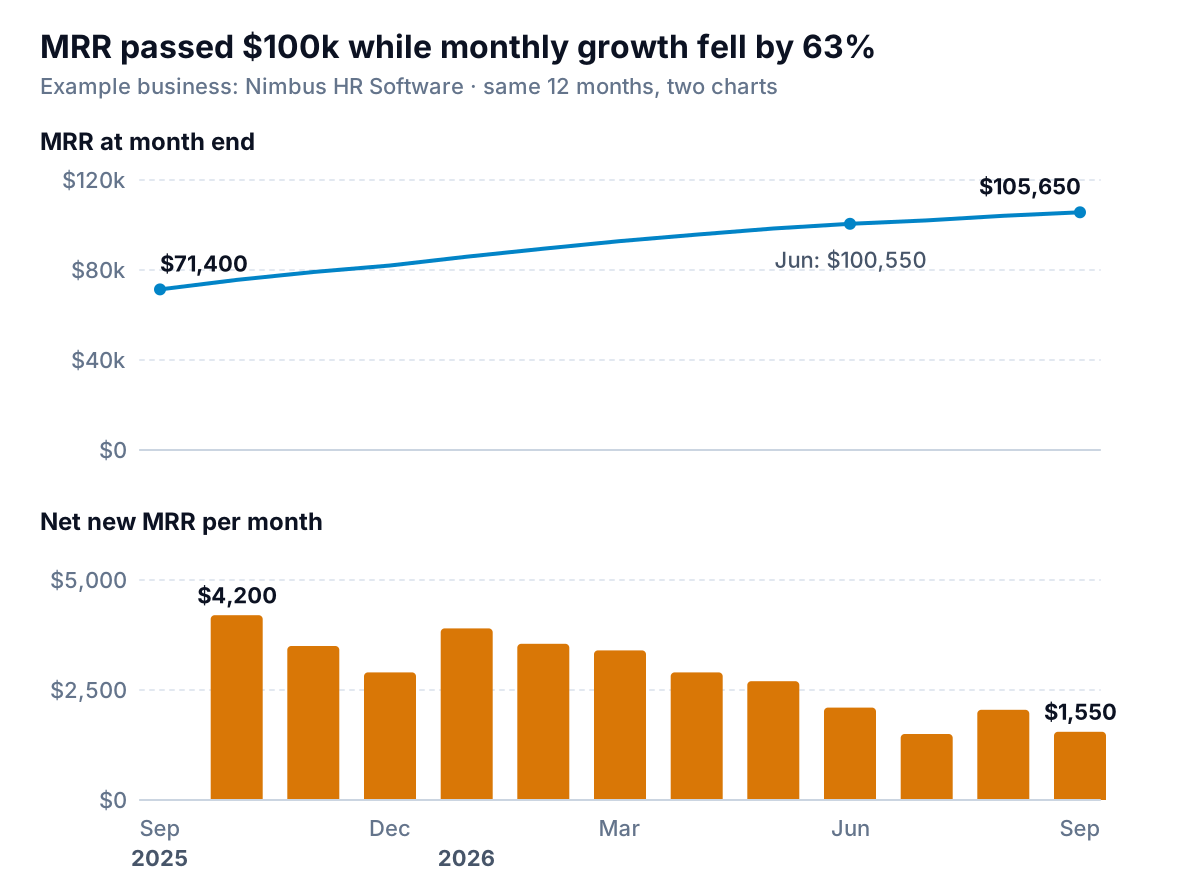
MRR Chart: The Level Line, the Movements Chart, and What Each Hides
Build an MRR chart that explains growth: a month-end MRR line plus a movements chart of new, expansion, contraction and churn MRR, made from a Stripe export.
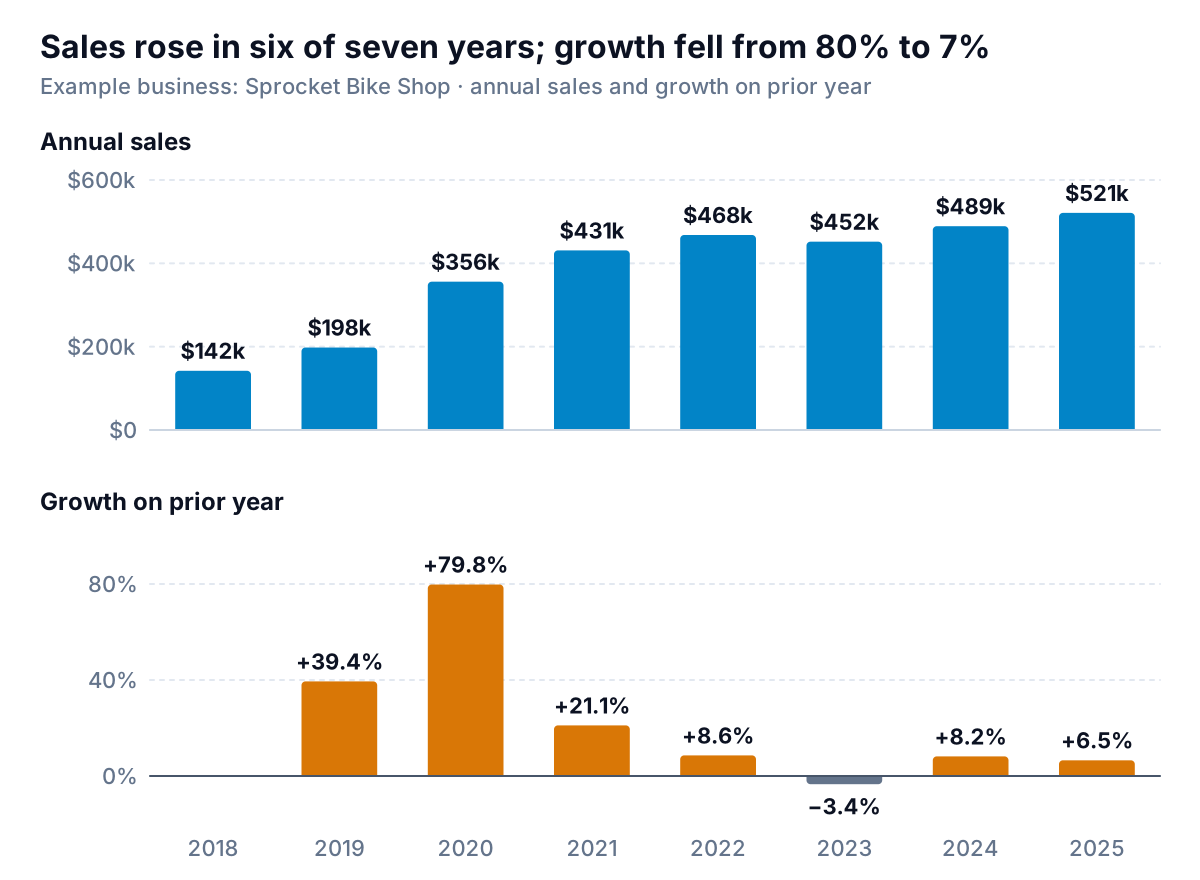
Sales Growth Chart: Growth Rates, Indexed Lines and Log Scales
How to make a sales growth chart that shows momentum: growth-rate bars, lines indexed to 100, log scales for long histories, and the small-base trap.
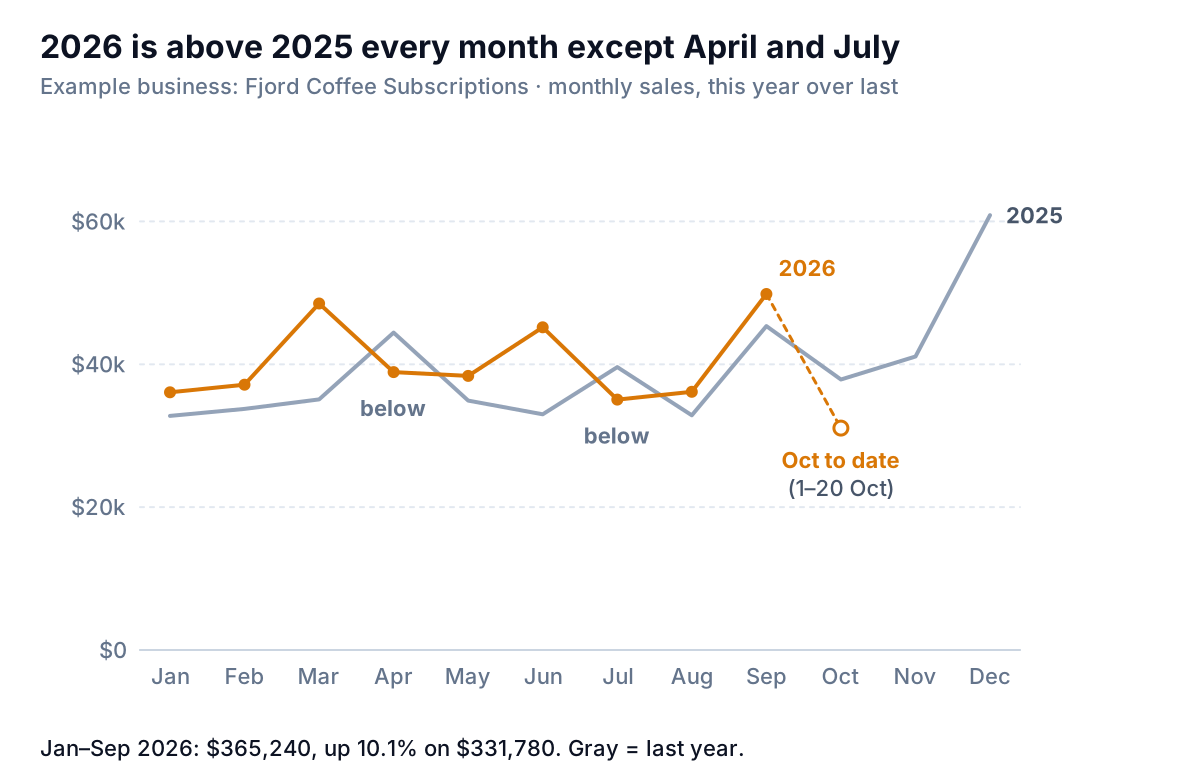
Year Over Year Comparison Chart: This Year vs Last, Without the Calendar Traps
Build a year over year comparison chart that's fair: overlaid lines, clustered columns or % change bars, plus trading days, 53-week years and partial months.
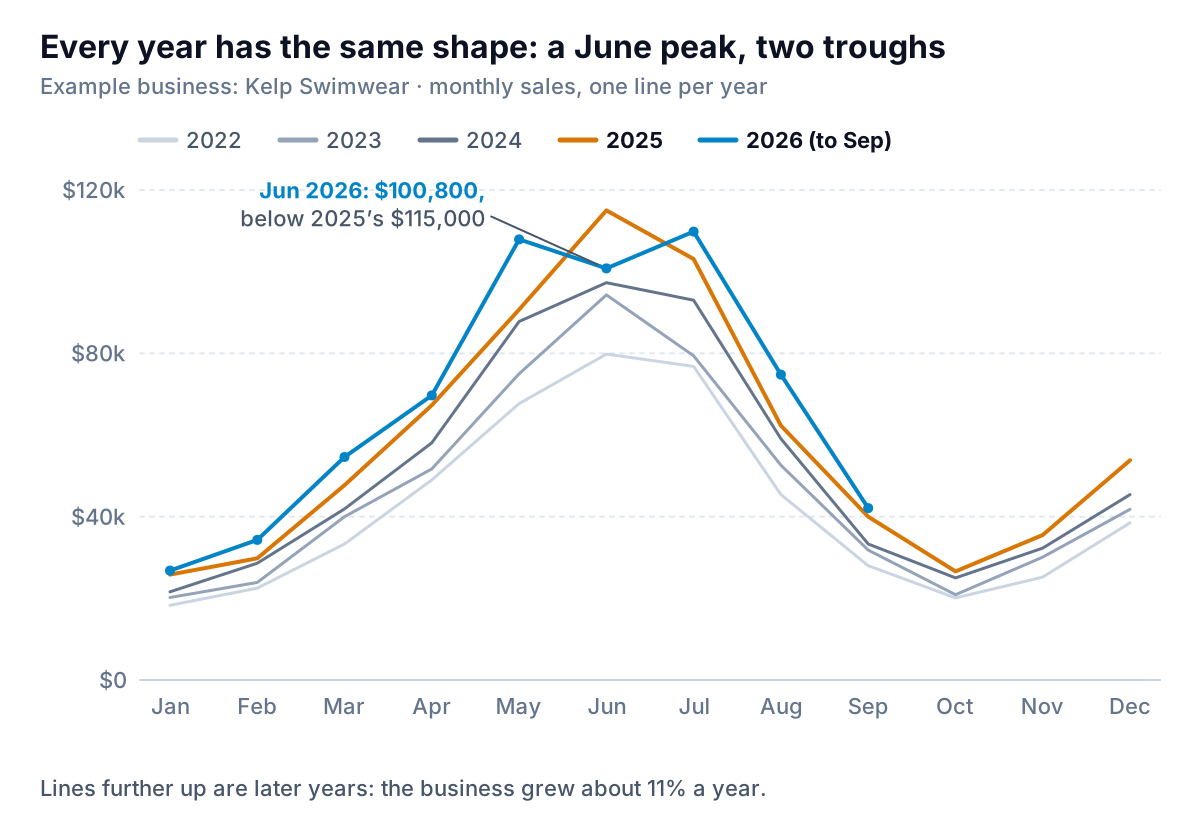
Seasonality Chart: Four Ways to See Which Dips Are Just the Calendar
Make a seasonality chart that separates season from trend: years overlaid by month, a seasonal index, a cycle plot and a seasonally adjusted sales line.
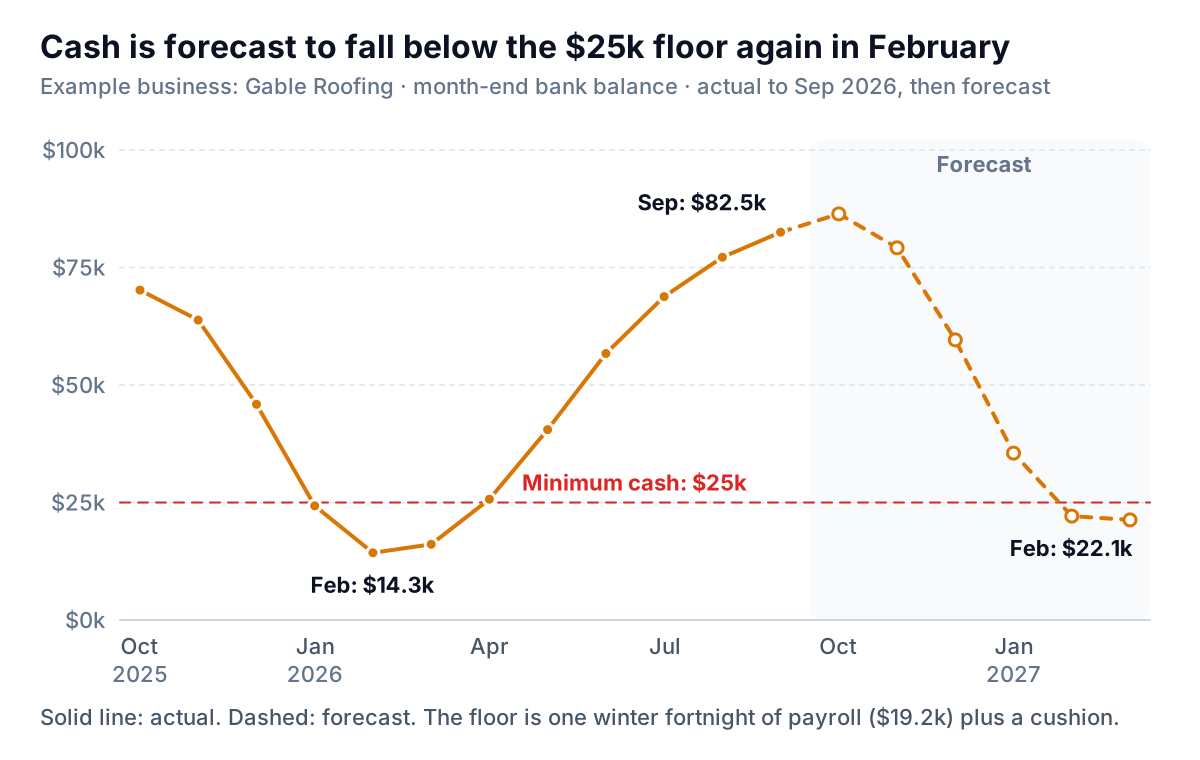
Cash Flow Chart: Four Charts That Show When Cash Gets Tight
How to build a cash flow chart that warns you early: a balance line with a minimum cash floor, in and out bars on one axis, a monthly waterfall, weekly lows.
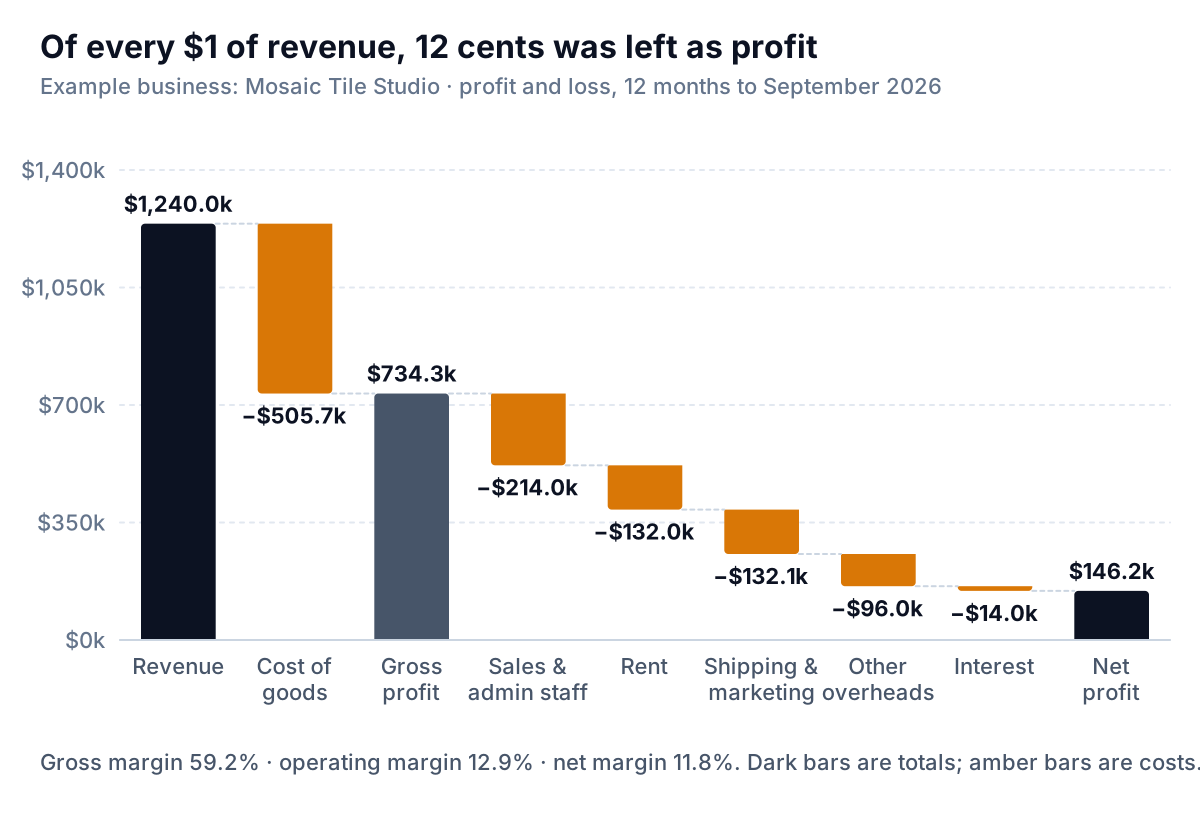
P&L Chart: Three Charts That Show Where the Profit Went
How to build a P&L chart that answers real questions: a revenue-to-profit waterfall, margin lines by quarter and costs as a share of revenue, with an example.
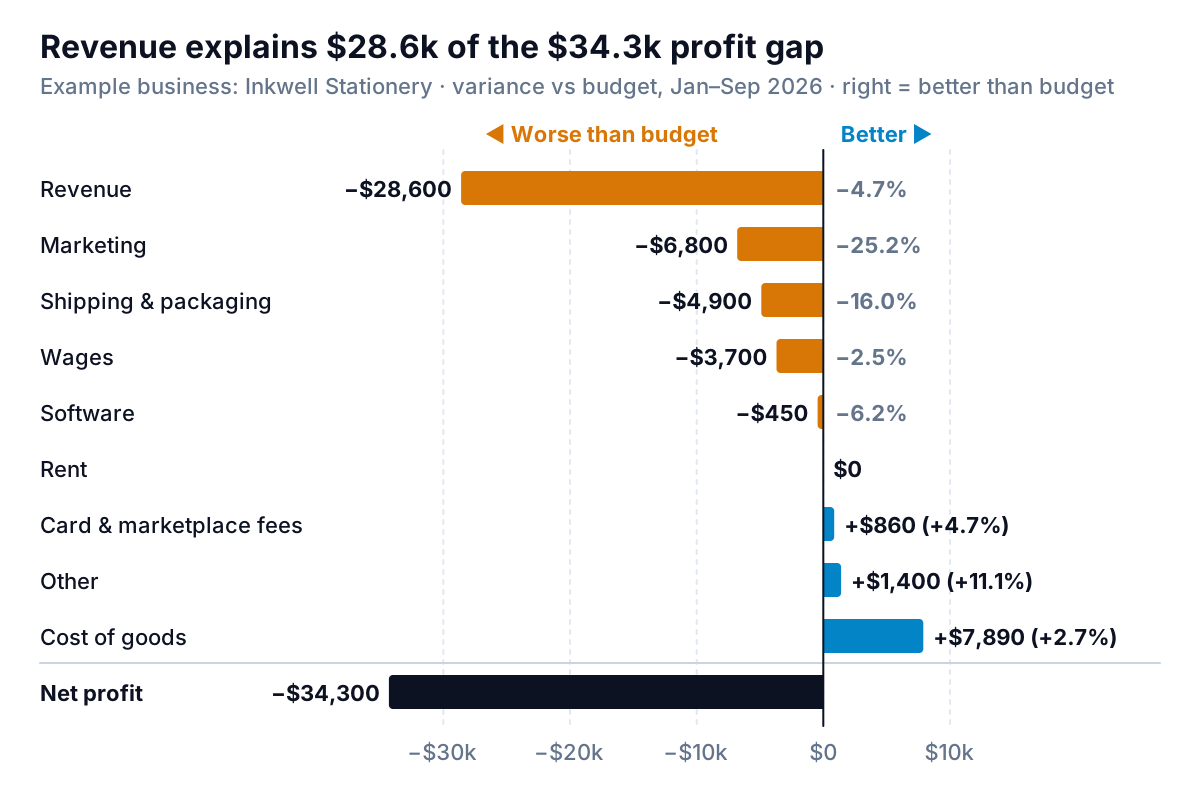
Budget vs Actual Chart: Show What Explains the Gap (Free Workbook)
Build a budget vs actual chart that explains the profit gap: sorted variance bars, bullet graphs and a year-to-date gap chart, with a free Excel workbook.
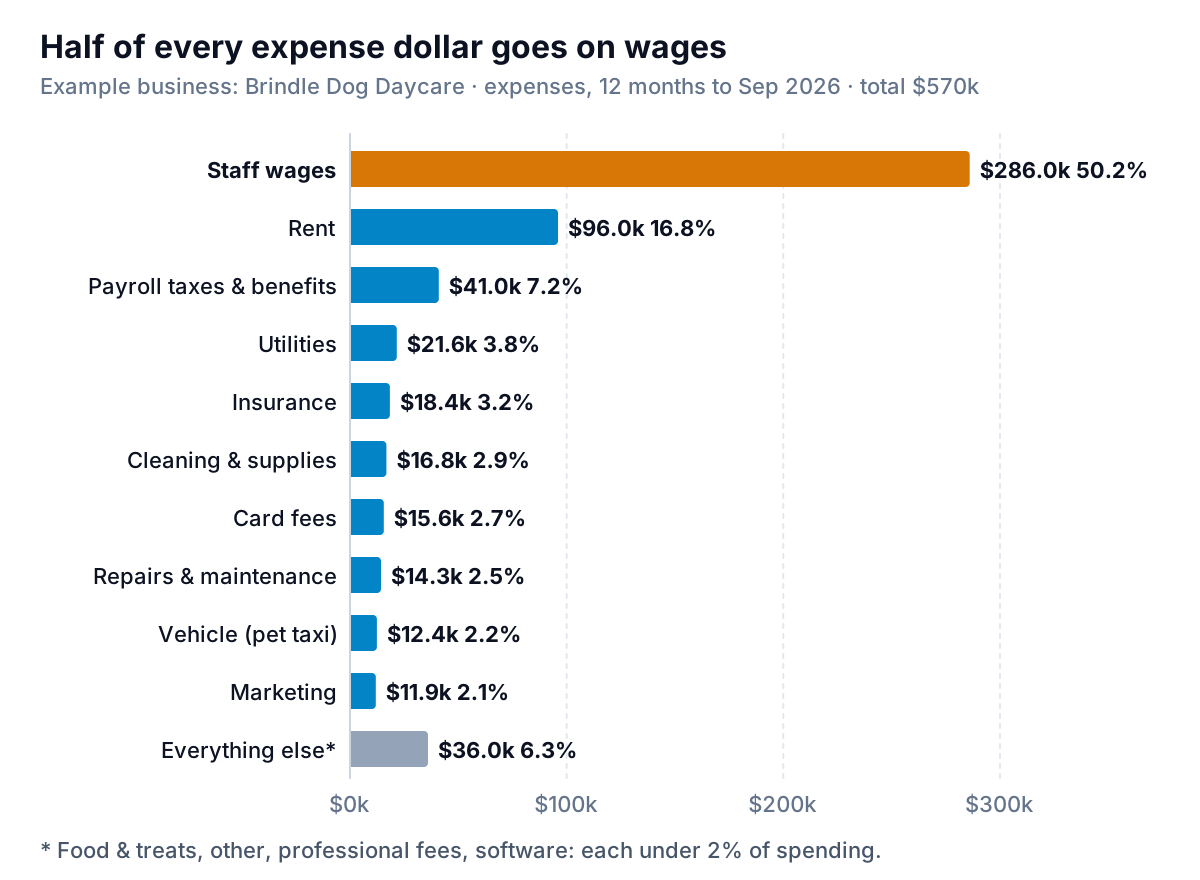
Expense Breakdown Chart: Sorted Bars, Pies, Treemaps and Change Over Time
Which expense breakdown chart to use: sorted bars over pies, rules for the Other bucket, treemaps, costs as a share of revenue, and pulling QuickBooks data.
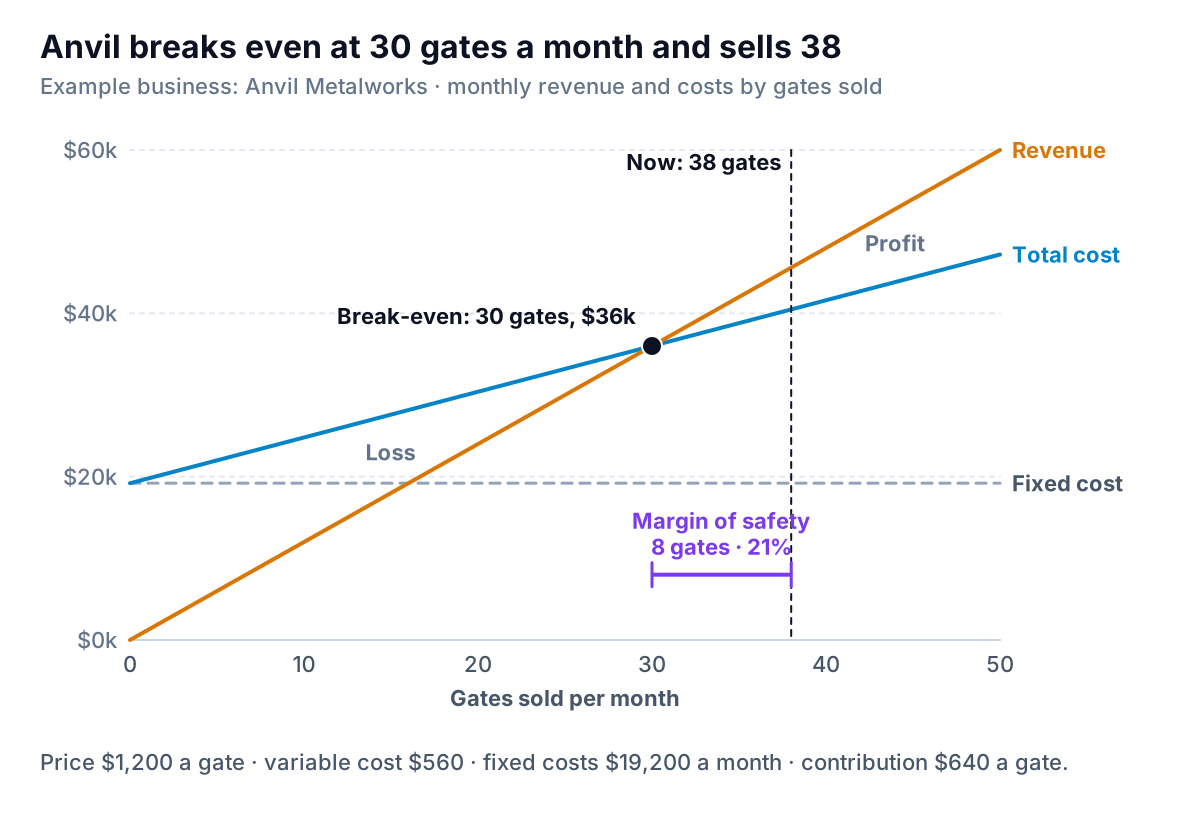
Break-Even Point Graph: Build It in Excel and Test Price and Cost Changes
How to build a break even point graph in Excel step by step, read the margin of safety, and see what a price rise or new fixed cost does. Free workbook.
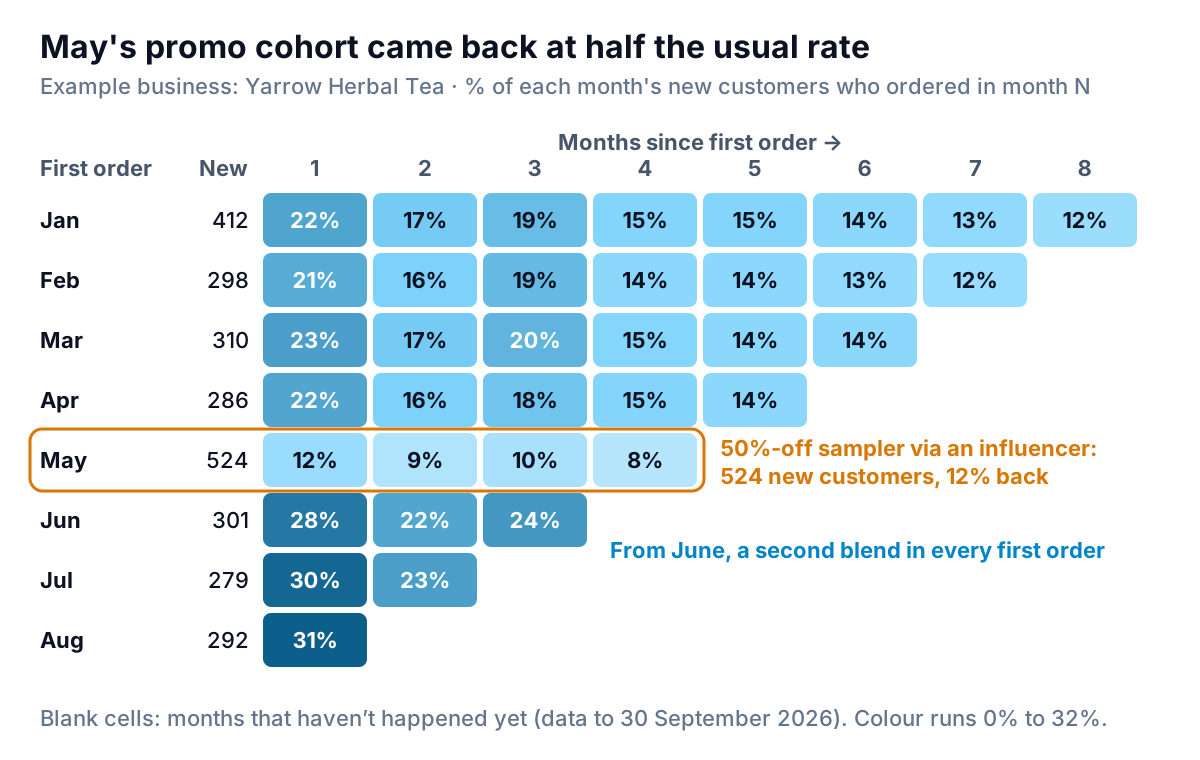
Cohort Retention Chart: Heatmap, Curves and the Formatting That Hides a Bad Cohort
How to build a cohort retention chart in Excel or Google Sheets: a colour-scale heatmap, retention curves, counts vs %, and the formatting mistakes to avoid.
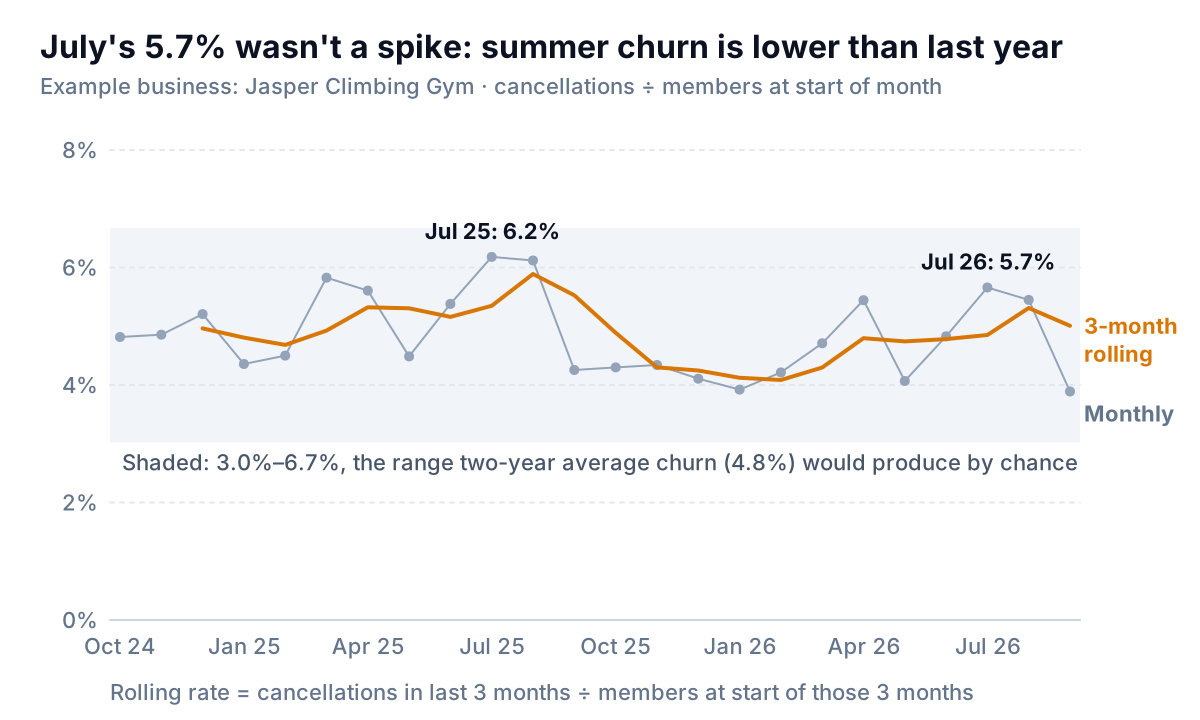
Churn Chart: The Rolling Rate, the Member Flow and the Survival Curve
How to build a churn chart that tells a real change from a bad month: a 3-month rolling rate, joins vs cancellations, and survival curves by join month.
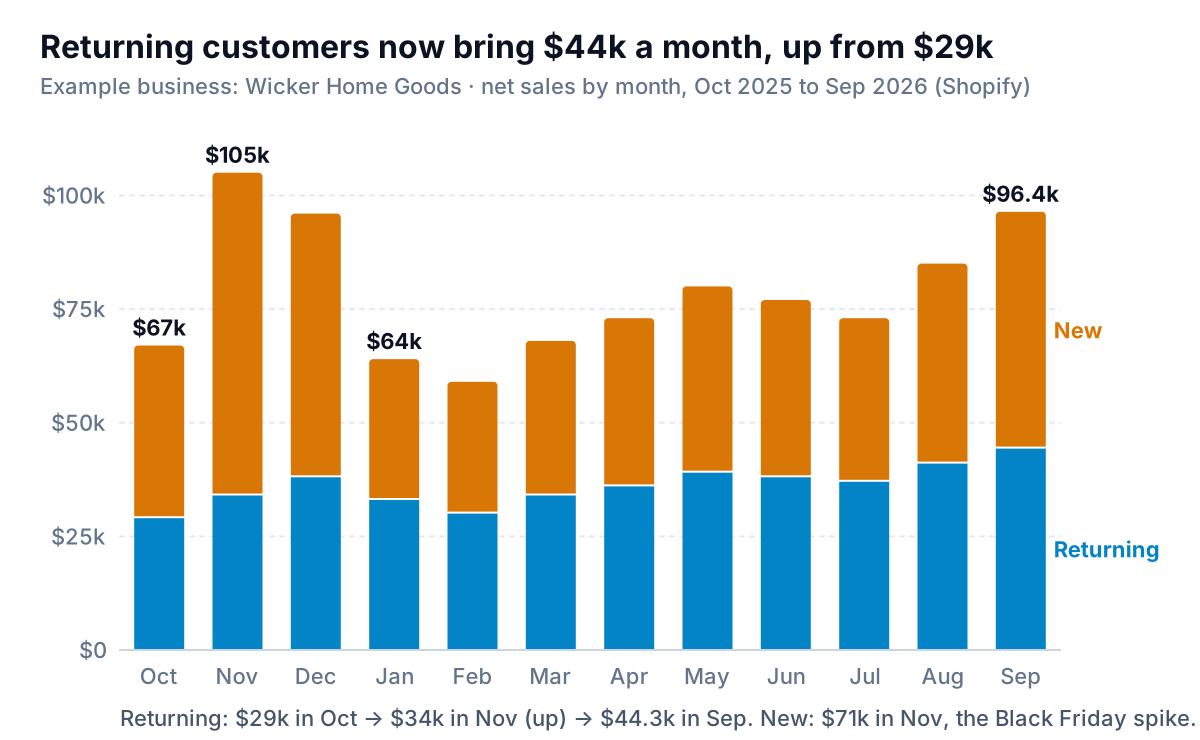
New vs Returning Customers: How to Chart the Split Without Fooling Yourself
How to chart new vs returning customers: stacked net sales columns, why the share line misleads, getting the split from Shopify, and four definitions.
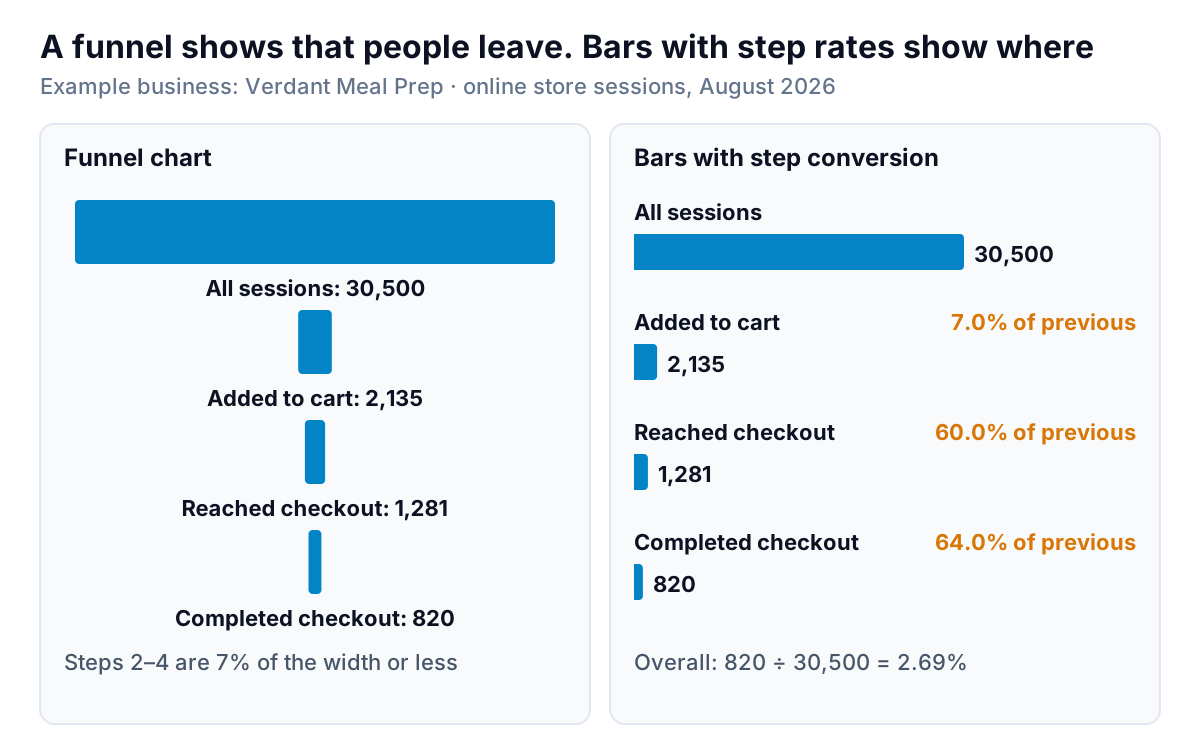
Funnel Chart: When to Use One, and the Bar Chart That Usually Works Better
When a funnel chart helps and when plain bars with step conversion rates work better, how to compare two periods, and how to build one in Excel and Sheets.
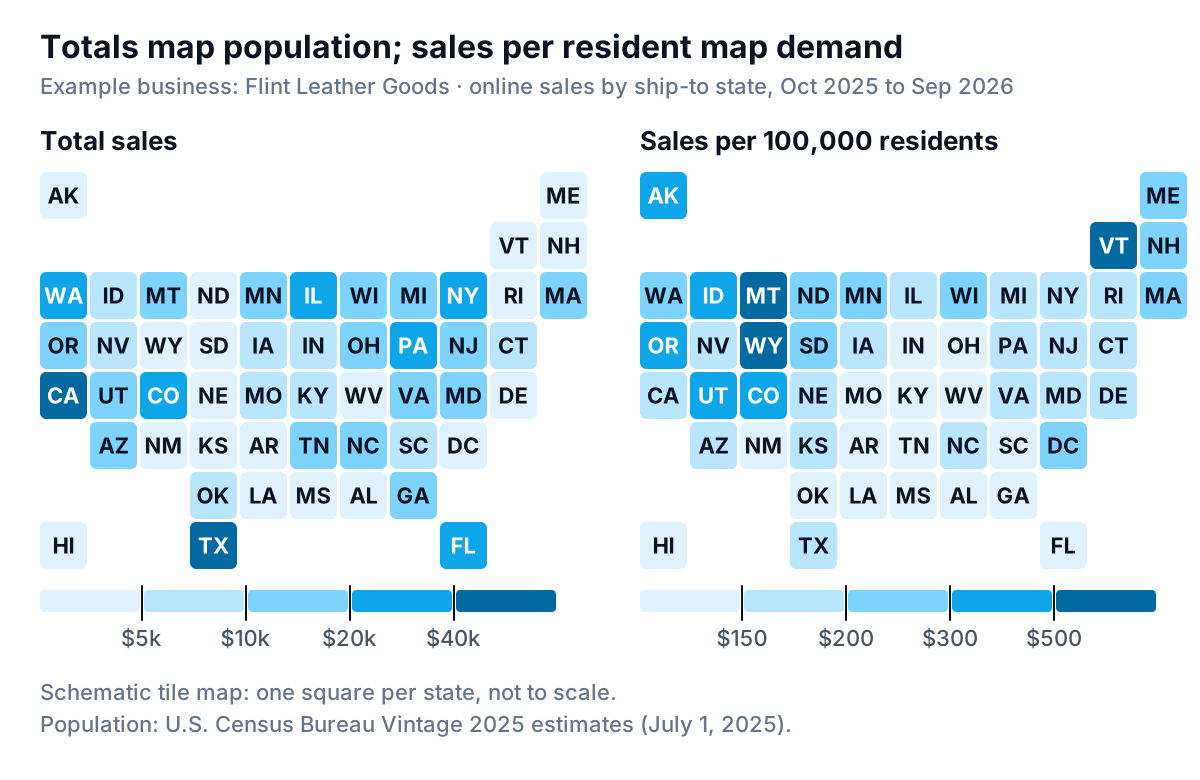
Sales Map: How to Chart Sales by State Without Mapping Population
How to build a sales map by state in Excel or Looker Studio: shape the data, divide by Census population, rank it, and know when a map is the wrong chart.
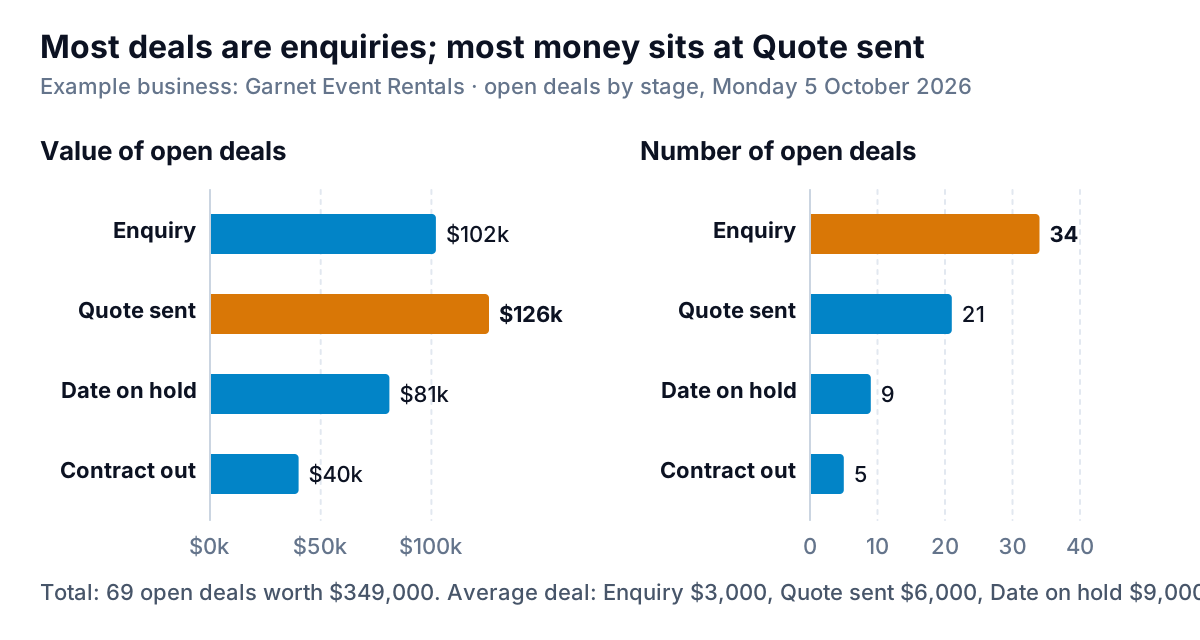
Sales Pipeline Chart: Four Charts That Show Where Deals Are and Where They Stop
Build a sales pipeline chart that works: value and count by stage, weighted pipeline, monthly snapshots and stage conversion, from HubSpot or a deal export.
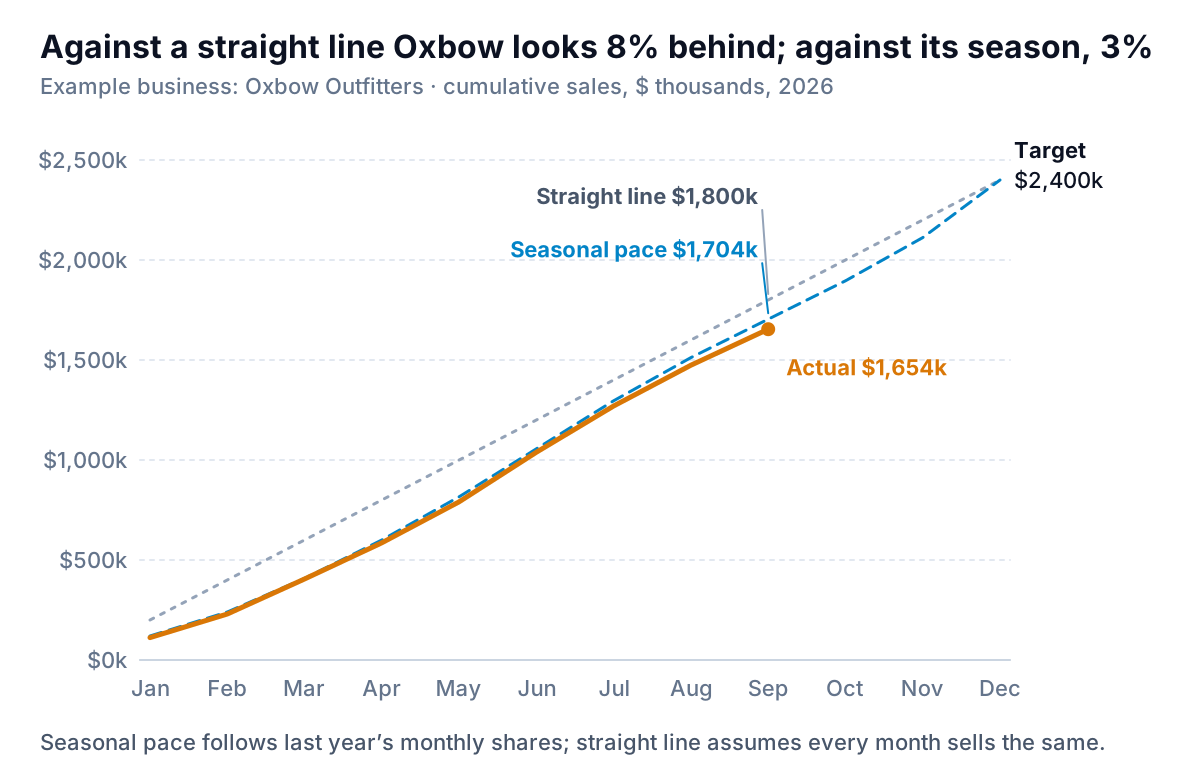
Sales Target Chart: Pace Lines, Bullet Charts and Progress Bars (Free Workbook)
Build a sales target chart that shows if you're on track: cumulative actual vs seasonal pace, a bullet chart per store, progress bars, and why gauges fail.
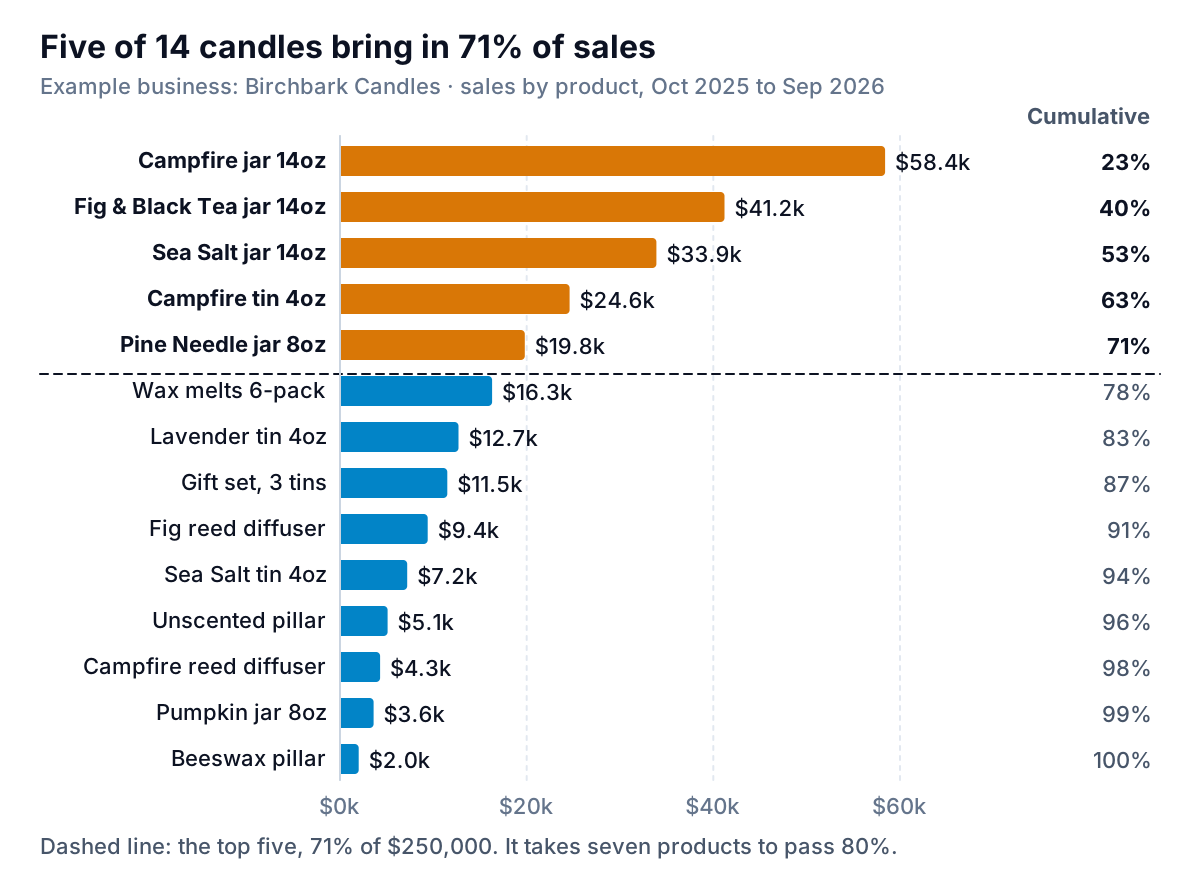
Sales by Product Chart: Rank, Concentration, Trend and Mix
Build a sales by product chart that answers a real question: sorted bars, a running total, small multiples per product line and 100% stacked mix, in Excel.
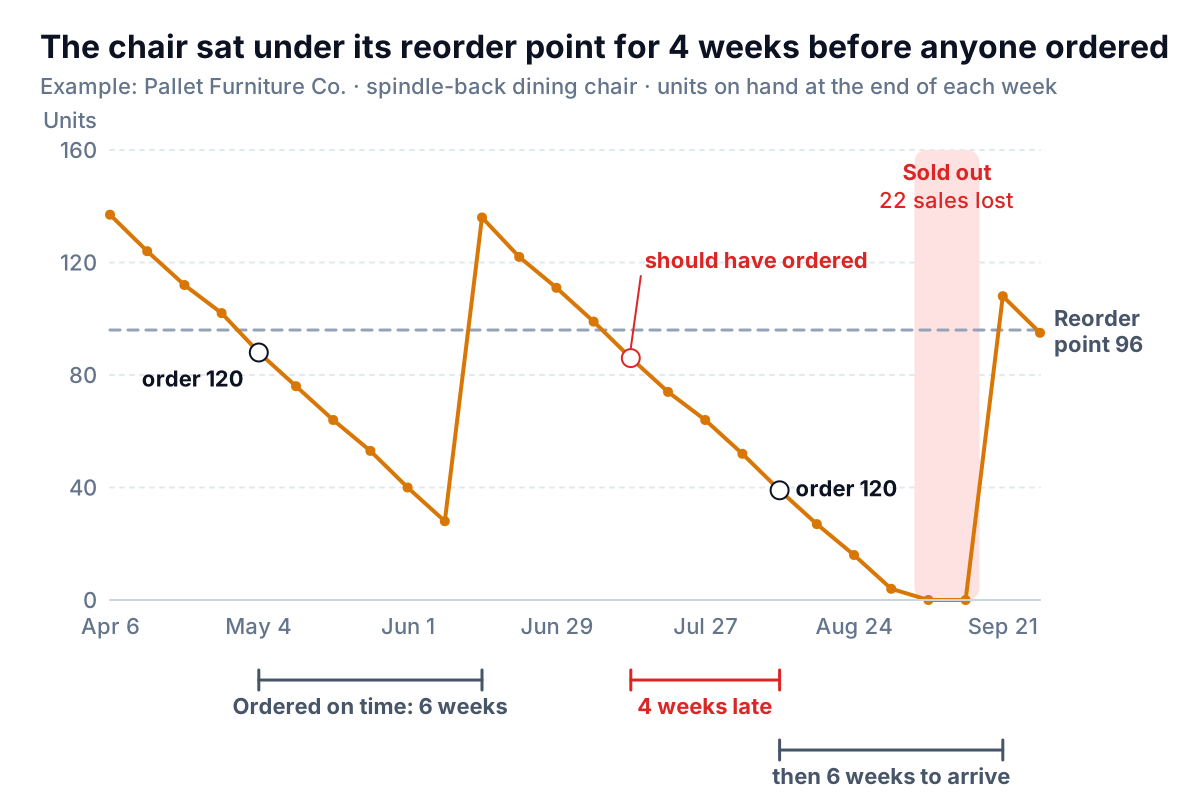
Inventory Chart: Stock Levels, Days on Hand and Aged Stock, Built Step by Step
Which inventory chart answers which question: stock vs reorder point, days on hand by category, and aged stock, with Excel and Sheets steps and a workbook.
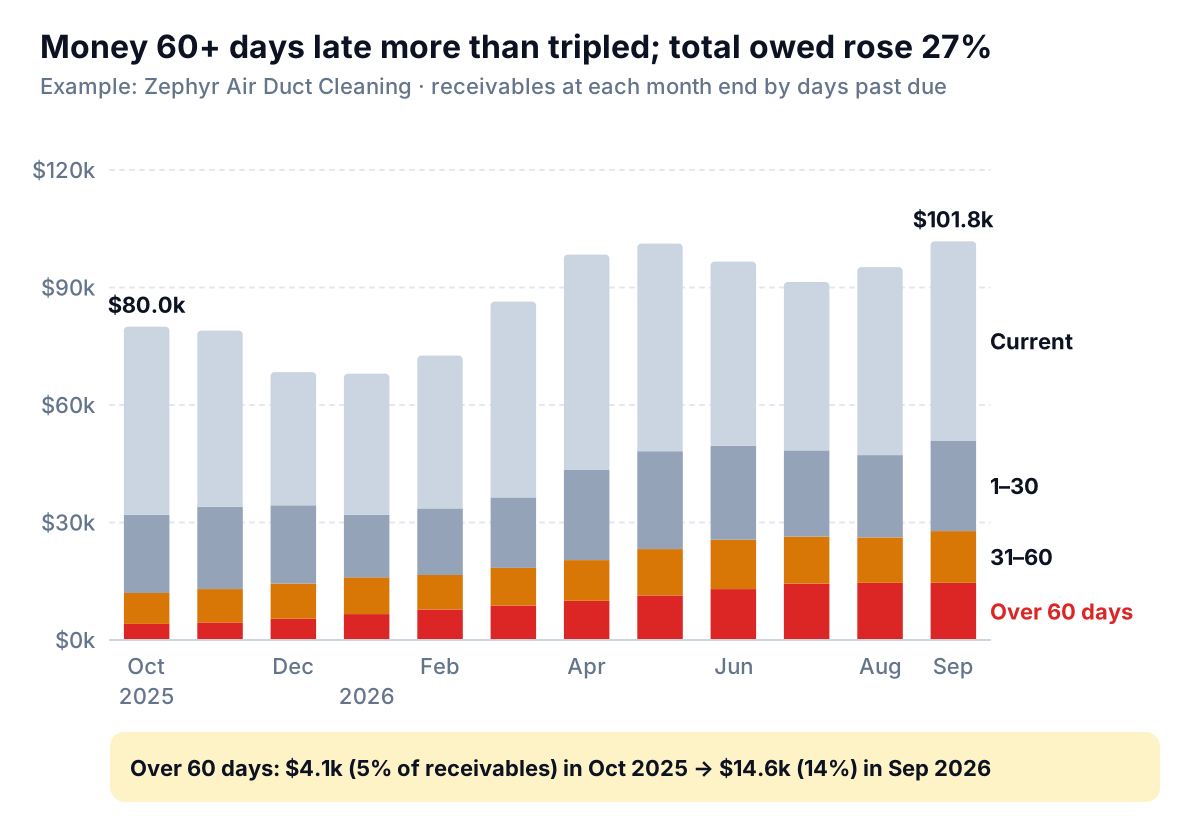
Accounts Receivable Aging Chart: Track Late Money, DSO and Who Owes It
Build an accounts receivable aging chart that shows late money growing: buckets stacked by month, DSO on invoiced sales, and top balances, in Excel or Sheets.
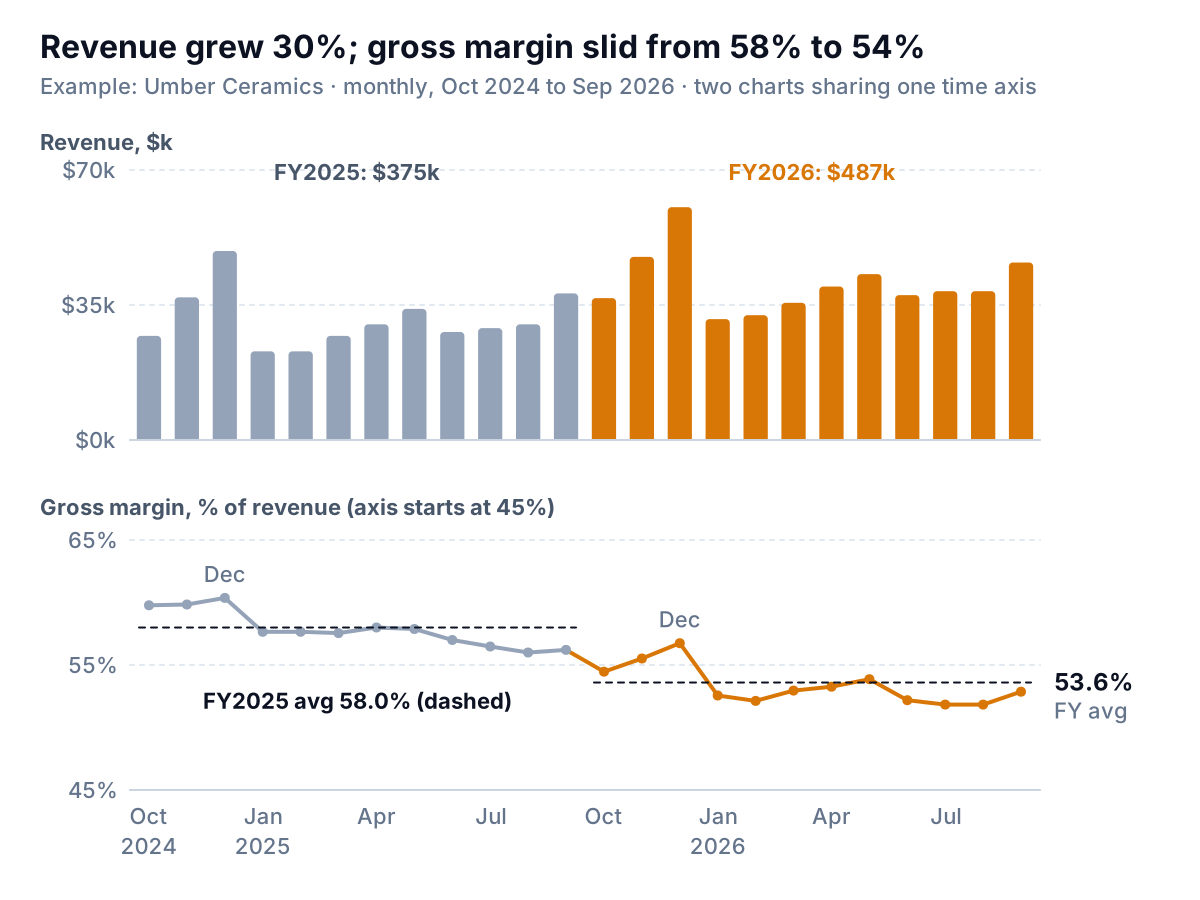
Gross Margin Chart: Why Two Axes Lie, and the Three Charts to Use Instead
How to build a gross margin chart that doesn't mislead: margin under revenue instead of a dual axis, a product scatter and a price-volume-mix bridge.
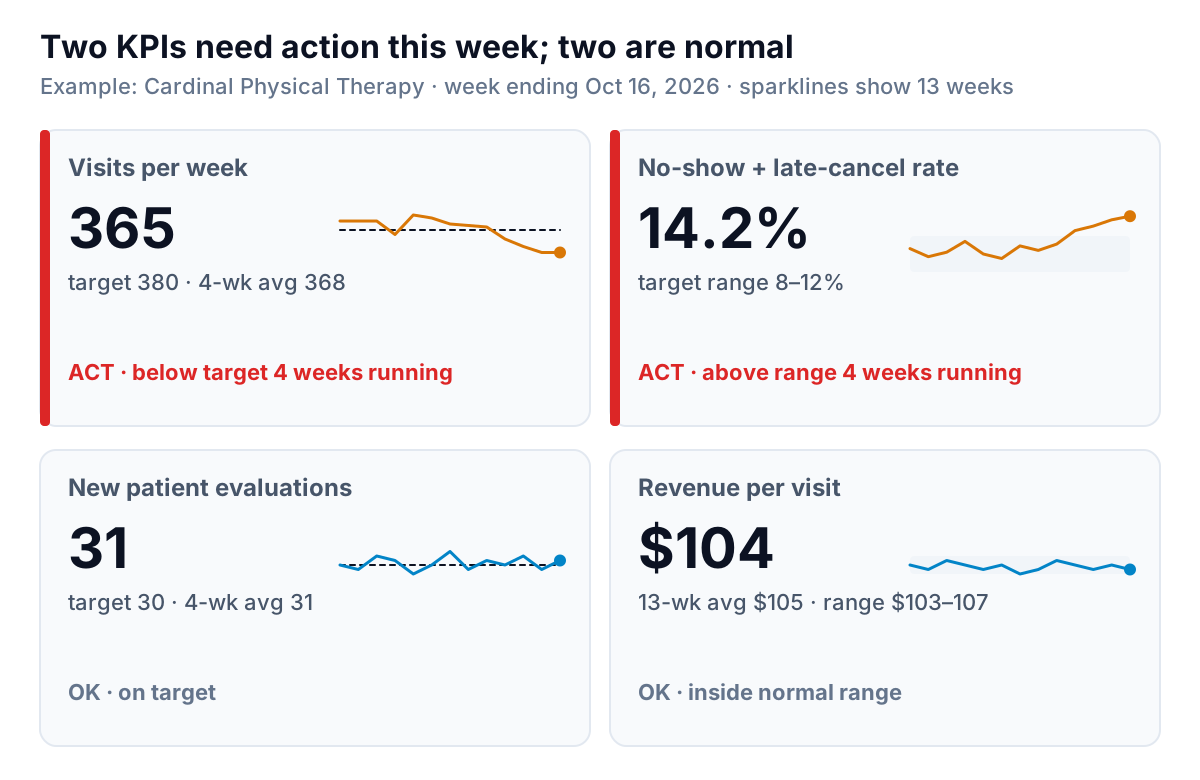
KPI Chart: Match Each Kind of KPI to a Chart, With Rules for When It Turns Red
Which KPI chart fits which number: big number with sparkline, bullet graph instead of a gauge, target bands and red/amber rules, built in Excel or Sheets.
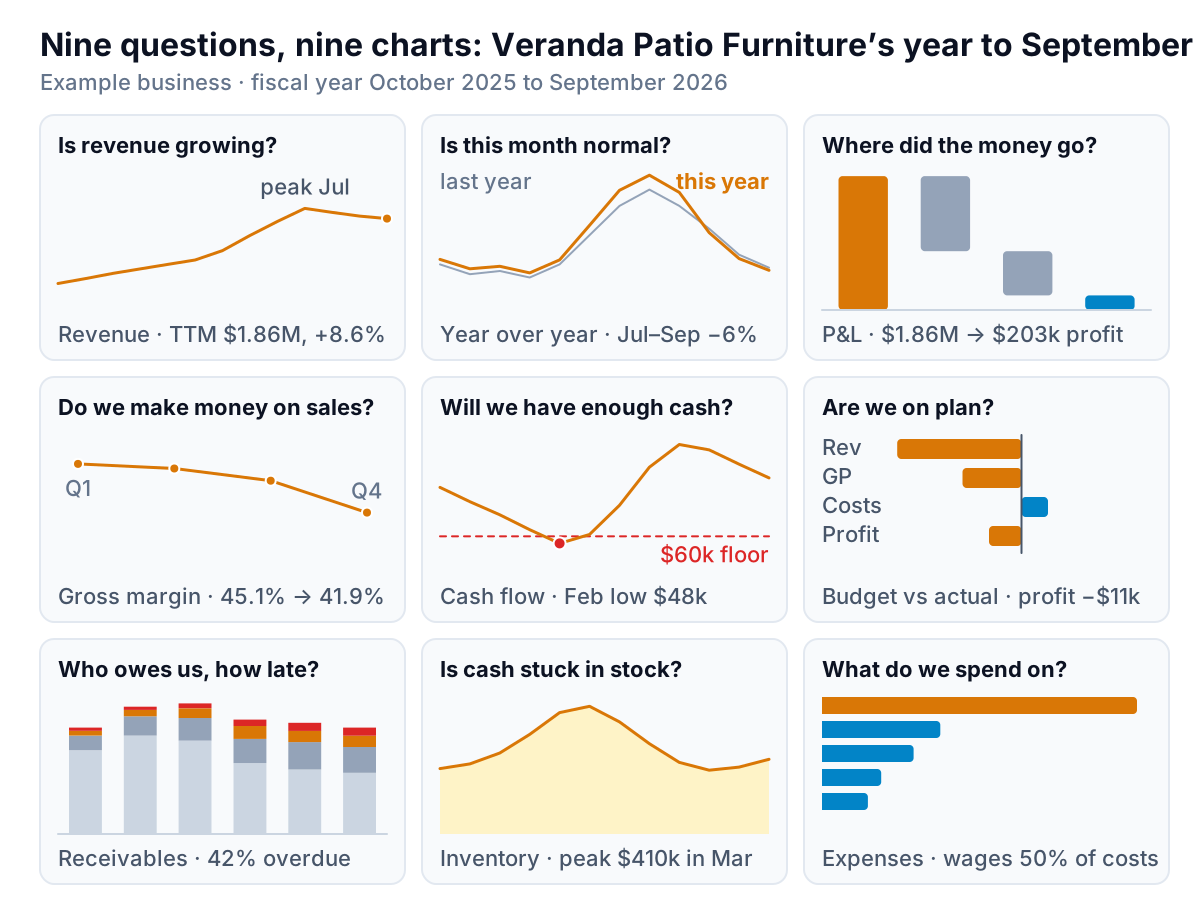
Financial Charts for a Small Business: Nine Questions, Nine Charts
The financial charts a small business needs, one per question: revenue, profit, margin, cash, budget, receivables and stock, and which go on a dashboard.
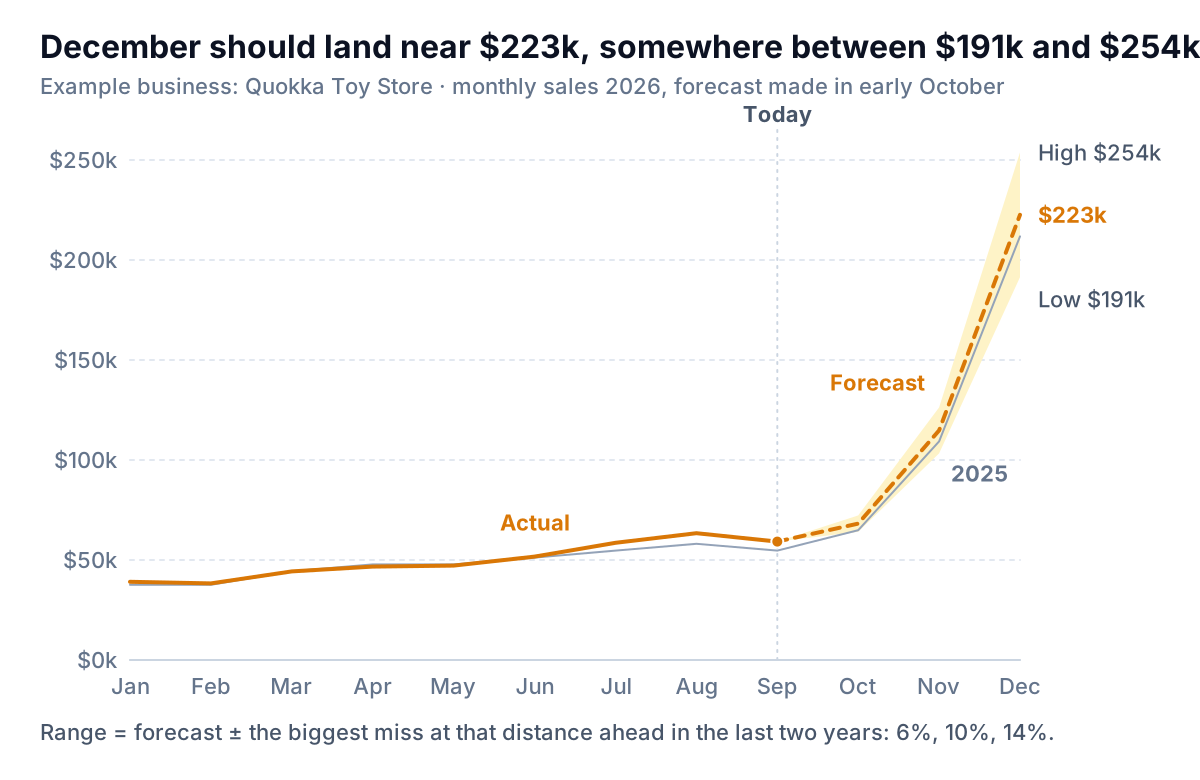
Forecast vs Actual Chart: Solid Lines, Dashed Lines and an Honest Range
How to build a forecast vs actual chart in Excel: actuals solid, forecast dashed, a range band, variance bars and forecast snapshots, with a free workbook.
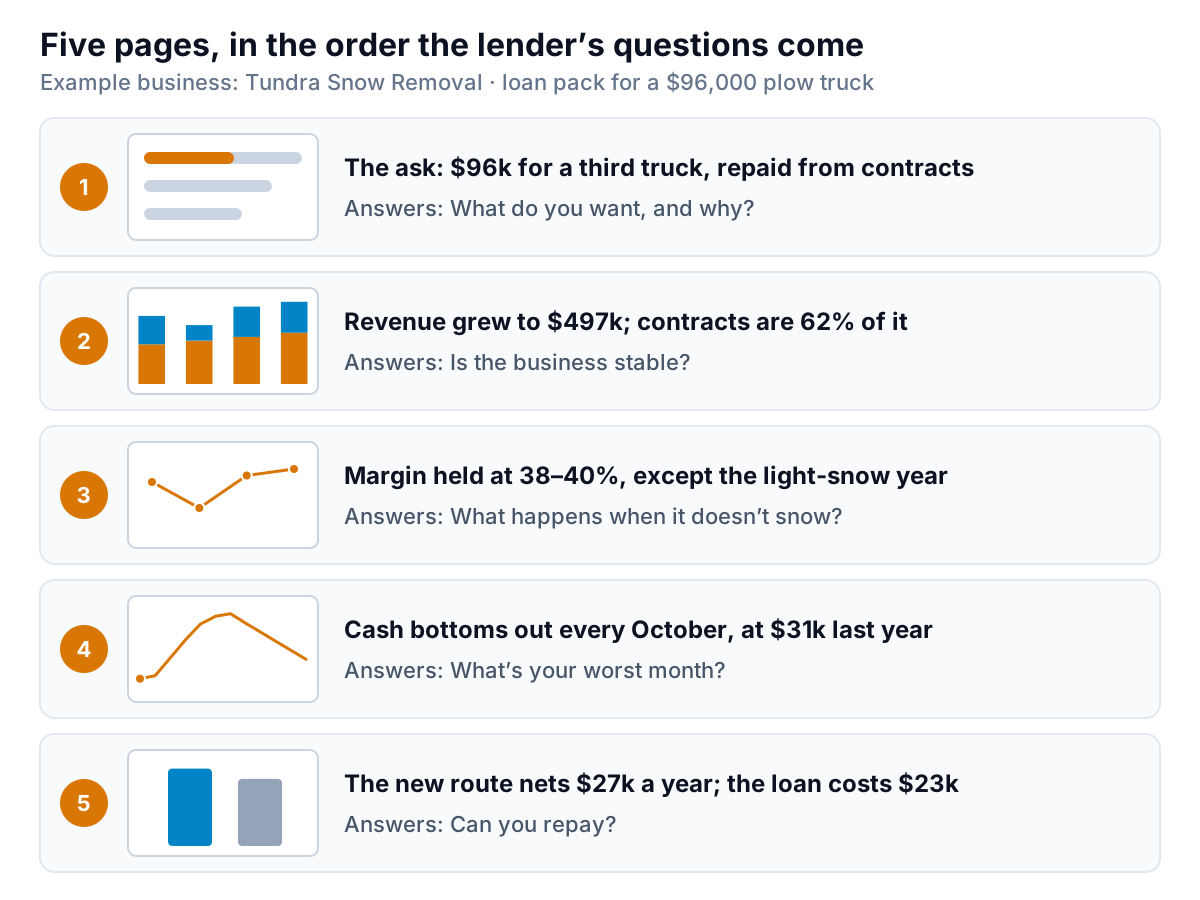
How to Present Financial Data to a Lender, Partner or Board
How to present financial data to a lender, partner or board: pick four to six charts, order them by the reader's questions, write takeaway titles, add tables.